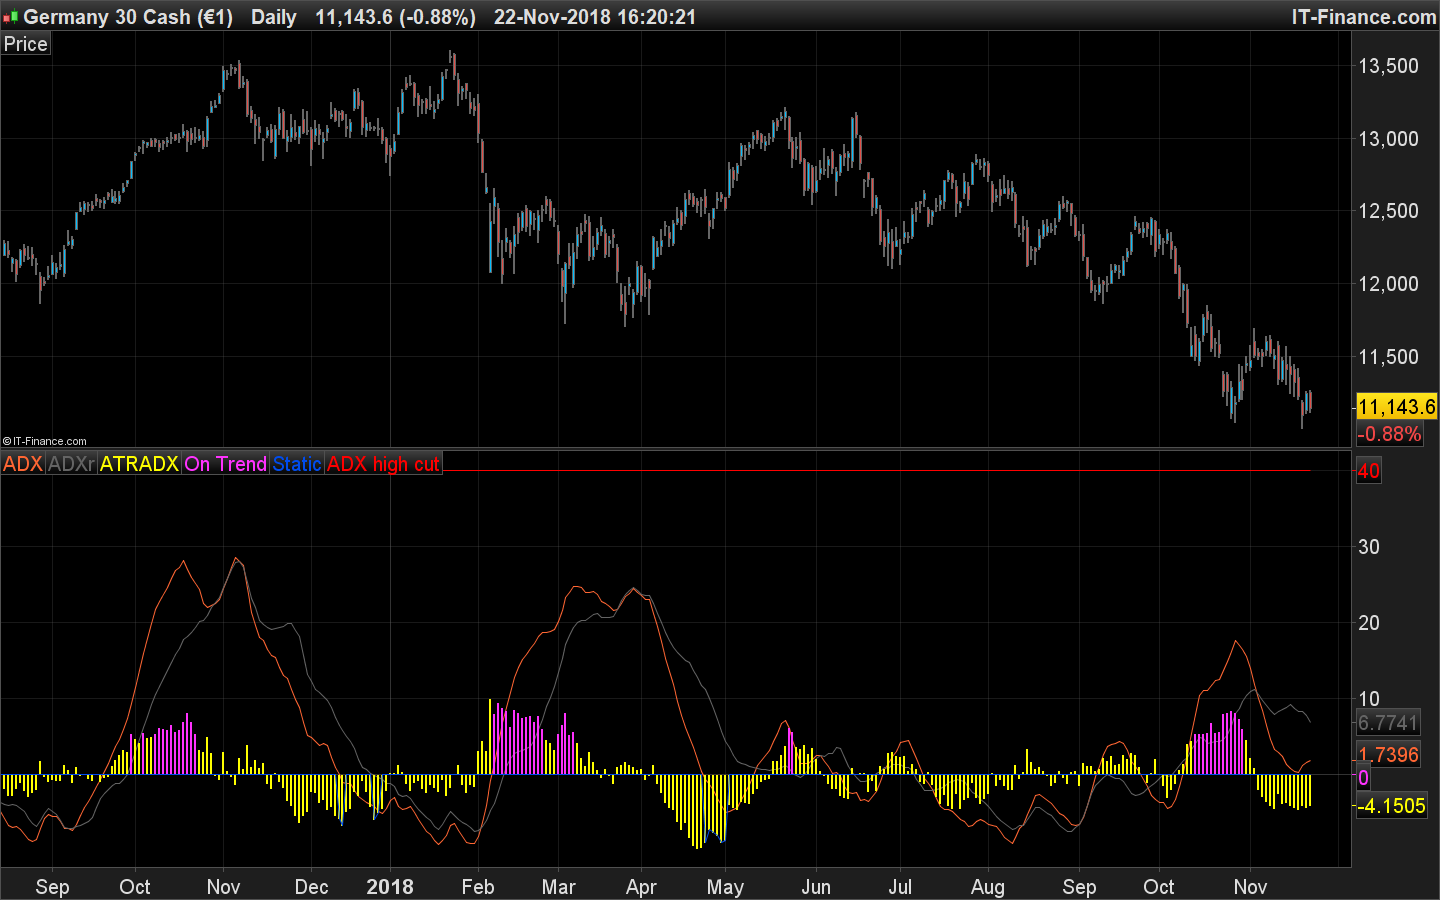
For some time now I wanted to have an indicator that would inform me about the progress (not the direction) of the current trend and its strength.
Many of you will be thinking that the ADX already fulfills that function, and in a certain way it is true. The ADX reports on the progress of the trend, and the distance between ADX and ADXr of its strength. But there’s a problem:
Those who know how the ADX is calculated will understand that if + DM and -DM are high, it gives a static signal. However, a value in range can be more or less volatile, and variations in its volatility indicate whether it is more or less likely that it will enter into a trend in a close manner.
Here comes into play the ATR, which was in fact programmed by J. Welles Wilder Jr, just like the ADX. In addition both indicators were published in 78 in the same book. You may ask yourself: But does not the ATR serve the same as the ADX?
Yes and no.
If the ADX grows, the ATR also tends to do so, especially the faster the trend. However, a strong trend with low noise and low ATR is possible.
Also the ATR has a problem, and that is expressed in absolute terms, so it does not make sense to compare the EUR / USD with BTC / USD and draw conclusions against their ATRs, since the first pair can be 0.008 in a day concrete and that of the second of 274. That is, more than 34,000 times greater.
I needed an indicator that would adapt to the value that was operating without too much adjustment, so I built a histogram that is a weighted sum of the relative variation of ATR and the distance between ADX and ADXr, with the possibility of adjusting the weight of each component as we wish .
Besides, representing the ADX in terms of 0 was not very useful, given that most times it will be at least more than 5. So it was a good option to give the possibility of setting line 0 at any value. For example in the classic 17 or 23 employees to discard side markets. In this way histogram and ADX are faced with the same baseline, as the MACD for example.
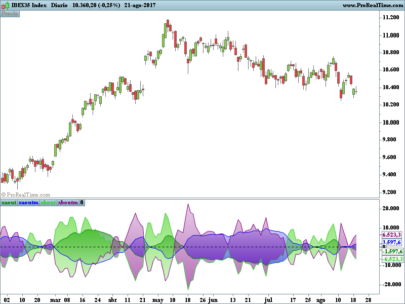
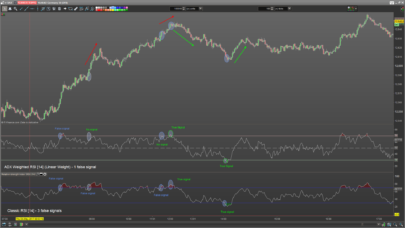
In the histogram I wanted to mark those combined ADR and ADX-ADXr values that were extreme. A high value would mean a strong trend with high volatility, a nervous price. A value under the opposite, a quiet value, excessively quiet, with a remarkable compression, possibly to the corner of an explosion.
As an extra, I thought it would be interesting to add another high cut-off point to quickly see if a level was exceeded, from which trend collapse is very likely. This level appears as a line and if it is exceeded, a violet ellipse is drawn automatically.
Without coiling more, I leave the code and tell me what improvements we could apply.
Desde hace algún tiempo quería tener un indicador que me informara en conjunto el progreso (que no dirección) de la tendencia actual y de su fuerza.
Muchos estaréis pensando que el ADX ya cumple esa función, y en cierta forma es cierto. El ADX informa sobre la el progreso de la tendencia, y la distancia entre ADX y ADXr de su fuerza. Pero hay un problema:
Los que sepáis como se calcula el ADX entenderéis que si +DM y -DM son elevados, da señal estática. Sin embargo un valor en rango puede ser más o menos volátil, y las variaciones en su volatilidad indican si es más o menos probable que entre en tendencia de una forma próxima.
Aquí entra en juego el ATR, que de hecho fue programado por J. Welles Wilder Jr, tal y cómo el ADX. Además ambos indicadores fueron publicados en el 78 en el mismo libro. Quizás te preguntes: ¿Pero no sirve para lo mismo el ATR que el ADX?
Sí y no.
Si el ADX crece, el ATR también suele hacerlo, especialmente cuanto más rápida es la tendencia. No obstante es posible una tendencia fuerte con poco ruido y ATR bajo.
Además el ATR tiene un problema, y es que se expresa en términos absolutos, por lo que no tiene sentido comparar el EUR/USD con BTC/USD y sacar conclusiones enfrentando sus ATRs, dado que el del primer par puede ser 0,008 en un día concreto y el del segundo de 274. Es decir,
más de 34.000 veces mayor.
Necesitaba un indicador que se adaptara al valor que estuviera operando sin demasiado ajuste, así que construí un histograma que es una suma ponderada de la variación relativa de ATR y la distancia entre ADX y ADXr, con posibilidad de ajustar el peso de cada componente según deseemos.
Además representar el ADX en función de 0 era poco útil, dado que la mayoría de veces será, al menos, mayor a 5. Por lo que era una buena opción dar la posibilidad de fijar la línea 0 en cualquier valor. Por ejemplo en los clásicos 17 o 23 empleados para descartar mercados laterales. De esta forma histograma y ADX quedan enfrentados a la misma línea base, como el MACD por ejemplo.
En el histograma quería marcar aquellos valores combinados de ATR y distancia de ADX-ADXr que fueran extremos. Un valor alto significaría una tendencia fuerte con volatilidad elevada, un precio nervioso. Un valor bajo todo lo contrario, un valor tranquilo, excesivamente tranquilo, con una compresión notable, posiblemente a la esquina de una explosión.
Como extra, me parecía interesante añadir otro punto de corte alto para ver de forma rápida si se superaba un nivel a partir del cual es muy probable un colapso tendencial. Este nivel aparece como una línea y además si se rebasa, se dibuja automáticamente una elipse violeta.
Sin enrollarme más, os dejo el código y me decís qué mejoras podríamos aplicar.
|
1 2 3 4 5 6 7 8 9 10 11 12 13 14 15 16 17 18 19 20 21 22 23 24 25 26 27 28 29 30 31 32 33 34 35 |
//Variables y valores por defecto: ADXp= 14 ADXcut= 20 ADXhcut= 60 ATRb= 14 ATRp= 2 ATRadj= 20 ADXtrend = ADX[ADXp]-ADXcut ADXrtrend = ADXR[ADXp]-ADXcut ADXhighcut = ADXhcut - ADXcut ADXstrength = ADX - ADXR ATRADX = ((AverageTrueRange[ATRp](close)-AverageTrueRange[ATRb](close))/AverageTrueRange[ATRb](close)*ATRadj)*1/3+ADXstrength*2/3 if ADXtrend>0 and ADXtrend>ADXrtrend and ATRADX>5 then TrendWarnH = ATRADX else TrendWarnH = 0 endif if ADXtrend<0 and ADXtrend<ADXrtrend and ATRADX<-5 then TrendWarnL = ATRADX else TrendWarnL = 0 endif if ADXtrend crosses over ADXhighcut then DRAWELLIPSE(barindex-2, ADXhighcut-2, barindex+2, ADXhighcut+2)coloured(255,50,255) endif RETURN ADXtrend coloured(255,102,51) as "ADX", ADXrtrend coloured(100,100,100) as "ADXr", ATRADX coloured(255,255,0) style(histogram) as "ATRADX", TrendWarnH coloured(255,50,255) style(histogram) as "On Trend", TrendWarnL coloured(0,76,238) as "Static", ADXhighcut coloured(255,0,0) as "ADX high cut" |
Variables y valores por defecto:
ADXp 14
ADXcut 20
ADXhcut 60
ATRb 14
ATRp 2
ATRadj 20
Share this
No information on this site is investment advice or a solicitation to buy or sell any financial instrument. Past performance is not indicative of future results. Trading may expose you to risk of loss greater than your deposits and is only suitable for experienced investors who have sufficient financial means to bear such risk.
ProRealTime ITF files and other attachments :
Find other exclusive trading pro-tools on ![]()
PRC is also on YouTube, subscribe to our channel for exclusive content and tutorials