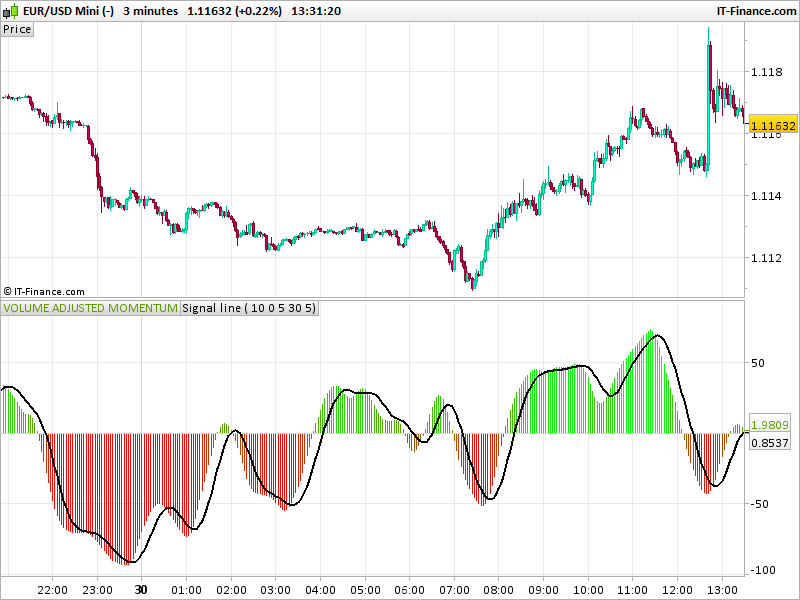
The ATR and Volume adjusted momentum oscillator include a ratio made of 2 double smoothed exponential average of the momentum compared to the absolute one.
The AbsMtm is a calculation of the momentum weighted with Volumes. So this technical indicator should be used on a security that deals with Volumes.
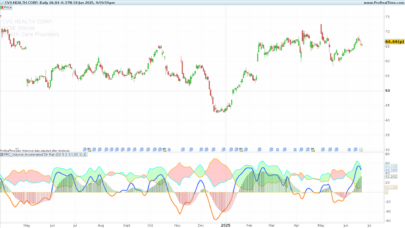
Trading signals can be compared to the MACD, the main oscillator is in histogram, while the signal line is a curve. Bullish and bearish signals are made with cross over and cross under the histogram and the signal line. You can also wait for the histogram to cross the 0 line which represents the frontier between the buyers and the sellers.
Translation of a MetaStock code by a request in the Spanish forum.
|
1 2 3 4 5 6 7 8 9 10 11 12 13 14 15 16 17 18 19 20 21 22 23 24 25 26 27 28 29 30 31 32 33 34 35 36 37 |
//PRC_ATR&Volume adjusted Momentum | indicator //30.05.2017 //Nicolas @ www.prorealcode.com //Sharing ProRealTime knowledge //translated from Metastock code // --- settings //avgP=10 //avgType=0 //moving average type //p1=5 //p2=30 //momp=5 //--- end of settings Mtm = (Close - close[momp] )/AverageTrueRange[momp] AbsMtm = (abs ( mtm)+ abs(Volume-volume[momp])) NumE = exponentialaverage[p2](exponentialaverage[p1](mtm)) DenE = exponentialaverage[p2](exponentialaverage[p1](absmtm)) Bensu = 100*(NumE/DenE) //Volume Change Volwma=WeightedAverage[13](Bensu) //signal line signal=average[avgP,avgType](volwma) if volwma>0 then r = 100-(volwma)*2 g = 150+abs(volwma)*2 else r = 150+abs(volwma)*2 g = 100-abs(volwma)*2 endif RETURN volwma coloured(r,g,0) style(histogram) as "VOLUME ADJUSTED MOMENTUM", signal style(line,2) as "Signal line" |
Share this
No information on this site is investment advice or a solicitation to buy or sell any financial instrument. Past performance is not indicative of future results. Trading may expose you to risk of loss greater than your deposits and is only suitable for experienced investors who have sufficient financial means to bear such risk.
ProRealTime ITF files and other attachments :PRC is also on YouTube, subscribe to our channel for exclusive content and tutorials










Volume on currency crosses?
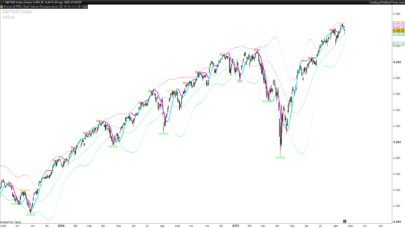
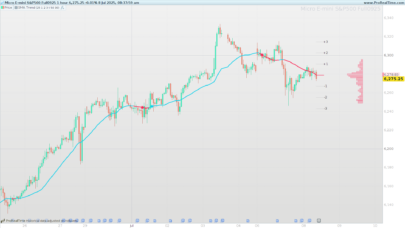
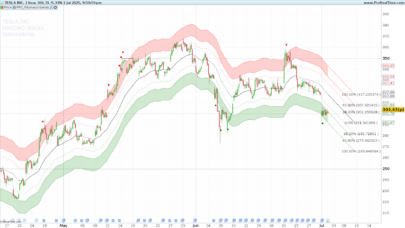
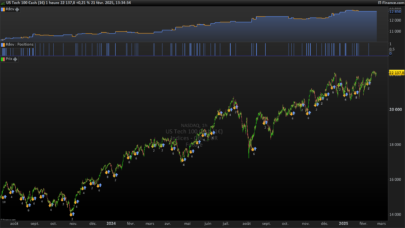
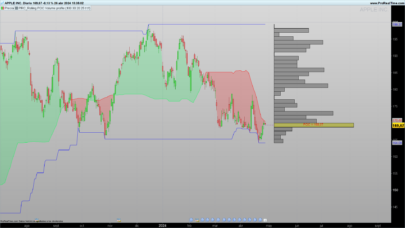
The featured image of the post do not deserve the indicator you are right, I attached other examples on US500.
The Volume weight is only an addition in the indicator formula, so as you stated it works also on instruments with no Volume.
When I buy and when I sell ?
It is described in the post already 🙂 The BUY/SELL signals are quite similar of what you can get with a MACD for instance.