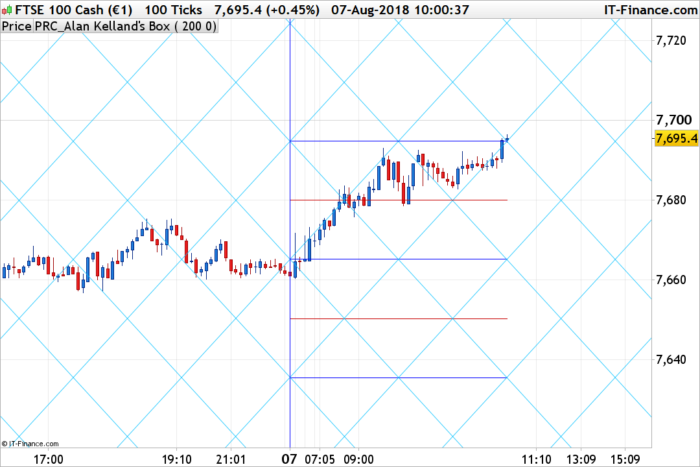
This indicator is in relation to the Alan Kelland’s trading method called the “Alan Square” or “DaBox”. You might find a lot of information about this on the internet.
It has been coded from its description, requested in the English forum.
The indicator can plot the Alan Square from different time horizons:
- 0 = daily timeframe
- 1 = weekly timeframe
- 2 = monthly timeframe
- 3 = yearly timeframe
Some useful infos about the indicator:
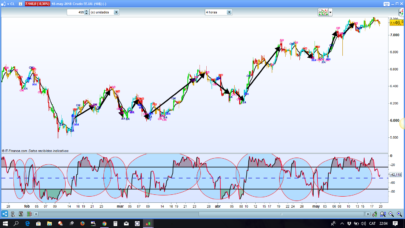
A draw tool growing in popularity is the Alan Square, named after its inventor Alan Kelland. Alan’s method is first and foremost price action. The square serves as a structure to create
- Opportunities
- Targets and
- Protection
The most important aspects are to look for only the best quality setups, focus on identifying follow through bars, and never fade a zone (i.e., never sell a support zone, never buy a resistance zone).
Background
Alan developed his methods trading the ten-minute all-sessions Dow Jones Index futures (YM contract). This article and the trading strategies described reflects his work using that instrument. They are suggested uses only and as such are not a complete compilation of all his methods. However, traders have successfully applied the square to the S&P futures, DAX, Crude Oil, Euro, Bund, Bond, Russell and even stocks. Similarly, while the method is geared towards 10-minute bars, Alan has also used the square on various intra-day time frames and Daily charts. You are encouraged to experiment and find what works for you.
Though Alan does not use indicators (e.g., MACD, Stochastic, etc), many traders do and have added them to their charts. Price action strategies that Alan has shared to take advantage of these opportunities, protections, and targets are summarized in this article.
Components
The major components of the Alan Square are:
1) Angulars
- a) Major – Up and Down angulars from the High, Low, and square Midpoint.
- b) Minor – Up and Down angulars parallel to the Major, but from the 25% and 75% quartiles.
Note: Only Major angulars create opportunities. Minor angulars are primarily used for protection.
2) Quartiles
- Yesterdays Low – 0% level (See below for how to determine Daily High and Daily Low)
- Yesterday’s High – 100% level
- Midpoint – 50% of yesterday’s Daily High and Daily Low
- Quartiles 25% and 75% of yesterday’s High-Low range
- Extensions (125% to 200% or more of High-Low range)
|
1 2 3 4 5 6 7 8 9 10 11 12 13 14 15 16 17 18 19 20 21 22 23 24 25 26 27 28 29 30 31 32 33 34 35 36 37 38 39 40 41 42 43 44 45 46 47 48 49 50 51 52 53 54 55 56 57 58 59 60 61 |
//PRC_Alan Kelland's Box | indicator //07.08.2018 //Nicolas @ www.prorealcode.com //Sharing ProRealTime knowledge // --- settings alpha = 100 //alpha transparency of angular lines mymyTimeframe = 0 //0=daily , 1=weekly , 2=monthly, 3=yearly // --- end of settings defparam drawonlastbaronly=true if myTimeframe=0 then hh=dhigh(1) ll=dlow(1) if intradaybarindex=0 then startbar=barindex endif elsif myTimeframe=1 then if DayOfWeek<DayOfWeek[1] then hh = Highest[BarIndex - lastWeekBarIndex](High)[1] ll = Lowest[BarIndex - lastWeekBarIndex](Low)[1] lastWeekBarIndex = BarIndex startbar=barindex Endif elsif myTimeframe=2 then If Month<>Month[1] then hh = Highest[BarIndex - lastMonthBarIndex](High)[1] ll = Lowest[BarIndex - lastMonthBarIndex](Low)[1] lastMonthBarIndex = BarIndex startbar=barindex endif elsif myTimeframe=3 then //yearly myTimeframe if year>year[1] then hh = Highest[BarIndex - lastYearBarIndex](High)[1] ll = Lowest[BarIndex - lastYearBarIndex](Low)[1] lastYearBarIndex = BarIndex startbar=barindex endif endif //horizontal drawvline(startbar) coloured(0,0,255) drawsegment(startbar,ll,barindex,ll) coloured(0,0,255) drawsegment(startbar,hh,barindex,hh) coloured(0,0,255) midpoint=(hh+ll)/2 drawsegment(startbar,midpoint,barindex,midpoint) coloured(0,0,255) quartile=(hh-ll)/4 drawsegment(startbar,ll+quartile,barindex,ll+quartile) coloured(200,0,0) drawsegment(startbar,ll+quartile*3,barindex,ll+quartile*3) coloured(200,0,0) //angulars mid=quartile*2 for i = 0 to 10 do drawline(startbar,ll+mid*i,barindex,hh+mid*i) coloured(0,191,255,alpha) drawline(startbar,ll-mid*i,barindex,hh-mid*i) coloured(0,191,255,alpha) drawline(startbar,hh-mid*i,barindex,ll-mid*i) coloured(0,191,255,alpha) drawline(startbar,hh+mid*i,barindex,ll+mid*i) coloured(0,191,255,alpha) next return |
Share this
No information on this site is investment advice or a solicitation to buy or sell any financial instrument. Past performance is not indicative of future results. Trading may expose you to risk of loss greater than your deposits and is only suitable for experienced investors who have sufficient financial means to bear such risk.
ProRealTime ITF files and other attachments :
Find other exclusive trading pro-tools on ![]()
PRC is also on YouTube, subscribe to our channel for exclusive content and tutorials


Really interesting! Thanks for sharing, have a great summer!
Sorry, a quick question I cannot see on forum please ?…Using ProScreener, how can we get the full list of stocks that meet the criteria, not just the top 50 ?
Thank you,
Interesting !
Anybody knows how could we add 4 hours timeframe simply to the 4 timeframes proposed without using the new timeframe feature available only in Probacktest ?
The indicator may be not as accurate with the initial version, see discussion here: https://www.prorealcode.com/topic/req-alans-box/
I’m waiting for a reply from @rapid
A me non funziona errore nella riga 11 e 13
//PRC_Alan Kelland’s Box | indicator
//07.08.2018
//Nicolas @ http://www.prorealcode.com
//Sharing ProRealTime knowledge
// — settings
alpha = 100 //alpha transparency of angular lines
mymyTimeframe = 0 //0=daily , 1=weekly , 2=monthly, 3=yearly
// — end of settings
defparam drawonlastbaronly=true
if myTimeframe=0 then
hh=dhigh(1)
ll=dlow(1)
if intradaybarindex=0 then
startbar=barindex
endif
elsif myTimeframe=1 then
if DayOfWeek<DayOfWeek[1] then
hh = Highest[BarIndex – lastWeekBarIndex](High)[1]
ll = Lowest[BarIndex – lastWeekBarIndex](Low)[1]
lastWeekBarIndex = BarIndex
startbar=barindex
Endif
elsif myTimeframe=2 then
If MonthMonth[1] then
hh = Highest[BarIndex – lastMonthBarIndex](High)[1]
ll = Lowest[BarIndex – lastMonthBarIndex](Low)[1]
lastMonthBarIndex = BarIndex
startbar=barindex
endif
elsif myTimeframe=3 then //yearly myTimeframe
if year>year[1] then
hh = Highest[BarIndex – lastYearBarIndex](High)[1]
ll = Lowest[BarIndex – lastYearBarIndex](Low)[1]
lastYearBarIndex = BarIndex
startbar=barindex
endif
endif
//horizontal
drawvline(startbar) coloured(0,0,255)
drawsegment(startbar,ll,barindex,ll) coloured(0,0,255)
drawsegment(startbar,hh,barindex,hh) coloured(0,0,255)
midpoint=(hh+ll)/2
drawsegment(startbar,midpoint,barindex,midpoint) coloured(0,0,255)
quartile=(hh-ll)/4
drawsegment(startbar,ll+quartile,barindex,ll+quartile) coloured(200,0,0)
drawsegment(startbar,ll+quartile*3,barindex,ll+quartile*3) coloured(200,0,0)
//angulars
mid=quartile*2
for i = 0 to 10 do
drawline(startbar,ll+mid*i,barindex,hh+mid*i) coloured(0,191,255,alpha)
drawline(startbar,ll-mid*i,barindex,hh-mid*i) coloured(0,191,255,alpha)
drawline(startbar,hh-mid*i,barindex,ll-mid*i) coloured(0,191,255,alpha)
drawline(startbar,hh+mid*i,barindex,ll+mid*i) coloured(0,191,255,alpha)
next
return