Buongiorno,
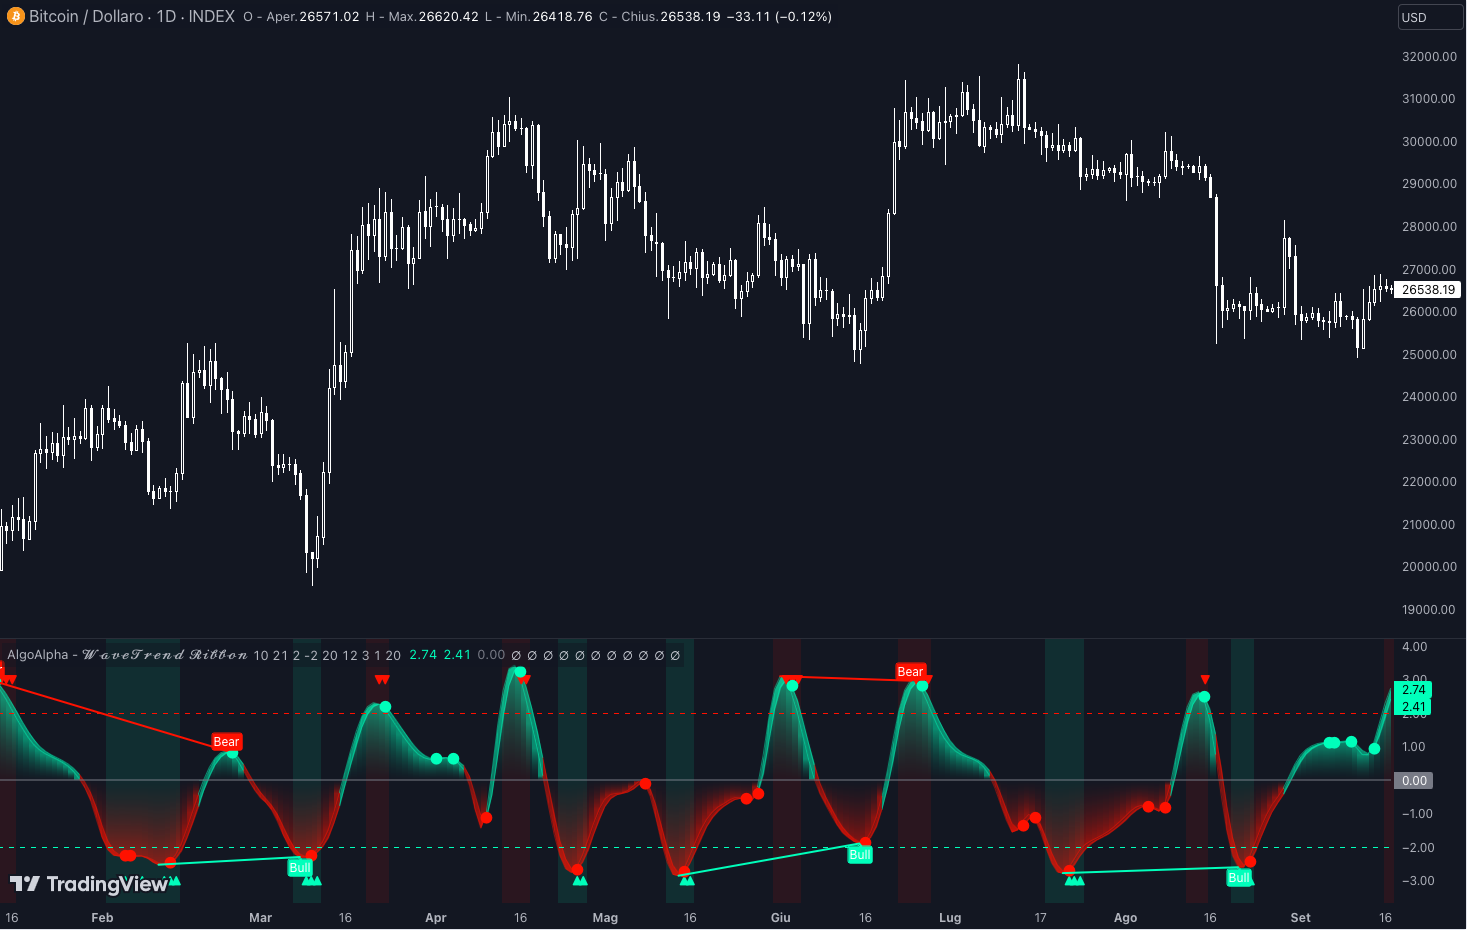
richiedo consueta cortese aiuto per tradurre il seguente codice che mi sembra interessante e che abbina la logica wave trend con il concetto di divergenza ( finora da me trovato in abbinamento al RSI).
Grazie per la collaborazione.
https://it.tradingview.com/script/mFXrPy9V-WaveTrend-Ribbon-AlgoAlpha/
//@version=5
indicator(“WaveTrend Ribbon [AlgoAlpha]”, shorttitle=”AlgoAlpha – wave trend ribbon”, overlay=false)
// WaveTrend parameters
n1 = input(10, “Channel Length”)
n2 = input(21, “Average Length”)
obLevel = input(2.0, “Overbought Z-score Level”)
osLevel = input(-2.0, “Oversold Z-score Level”)
lengthZ = input(20, “Length for Z-score Calculation”)
hmaLength = input(12, “HMA Length for Z-score Smoothing”)
wmaLength = input(3, “WMA Length for Z-Score”)
upColor = input.color(#00ffbb, “Up Color”)
downColor = input.color(#ff1100, “Down Color”)
// WaveTrend calculation
ap = hlc3
esa = ta.ema(ap, n1)
d = ta.ema(math.abs(ap – esa), n1)
ci = (ap – esa) / (0.015 * d)
tci = ta.ema(ci, n2)
// Z-score calculation
meanWT = ta.sma(tci, lengthZ)
stdDevWT = ta.stdev(tci, lengthZ)
zScore = (tci – meanWT) / stdDevWT
zScore := ta.hma(zScore, hmaLength)
zma = ta.wma(zScore, wmaLength)
// Overbought/Oversold conditions
obCondition = zScore > obLevel
osCondition = zScore < osLevel
// Plotting
//p1 = plot(zScore, color= zScore > zma ? color.new(upColor, 30) : color.new(downColor, 30), title=”WaveTrend Z-Score”)
//p2 = plot(zma, color= zScore > zma ? color.new(upColor, 30) : color.new(downColor, 30), title=”WaveTrend Z-Score”)
p1 = plot(zScore, color = zScore > 0 ? color.new(upColor, 50) : color.new(downColor, 50), title=”WaveTrend Z-Score”)
p2 = plot(zma, color = zScore > 0 ? color.new(upColor, 50) : color.new(downColor, 50), title=”WaveTrend Z-Score”)
m = plot(0, color = color.gray)
hline(obLevel, “Overbought”, color=downColor)
hline(osLevel, “Oversold”, color=upColor)
bgcolor(obCondition ? color.new(downColor, 90) : na)
bgcolor(osCondition ? color.new(upColor, 90) : na)
//fill(p1, p2, zScore > zma ? color.new(upColor, 30) : color.new(downColor, 30))
fill(p1, p2, zScore > 0 ? color.new(upColor, 50) : color.new(downColor, 50))
fill(p1, m, zScore, 0, zScore > 0 ? color.new(upColor, 50) : color.new(downColor, 50), color.new(chart.bg_color, 80))
// Reversal signals
plotchar(obCondition and zScore[1] > zScore ? 3 : na , char = “▼”, location=location.absolute, color=downColor, title=”Overbought Reversal”, size = size.tiny)
plotchar(osCondition and zScore[1] < zScore ? -3 : na, char = “▲”, location=location.absolute, color=upColor, title=”Oversold Reversal”, size = size.tiny)
plotchar(ta.cross(zScore, zma) ? zma : na, char = “●”, location=location.absolute, color= zScore > 0 ? color.new(upColor, 0) : color.new(downColor, 0), title=”Trend Swing”, size = size.tiny)
plotBullish = input(title=”Plot Bullish”, defval=true, group = “Divergences”)
plotHiddenBull = input(title=”Plot Hidden Bullish”, defval=false, group = “Divergences”)
plotBear = input(title=”Plot Bearish”, defval=true, group = “Divergences”)
plotHiddenBear = input(title=”Plot Hidden Bearish”, defval=false, group = “Divergences”)
bearColor = downColor
bullColor = upColor
hiddenBullColor = color.new(upColor, 80)
hiddenBearColor = color.new(downColor, 80)
textColor = color.white
noneColor = color.new(color.white, 100)
osc = zScore
lbR = input(title=”Pivot Lookback Right”, defval=1)
lbL = input(title=”Pivot Lookback Left”, defval=20)
plFound = na(ta.pivotlow(osc, lbL, lbR)) ? false : true
phFound = na(ta.pivothigh(osc, lbL, lbR)) ? false : true
_inRange(cond) =>
bars = ta.barssince(cond == true)
-80 <= bars and bars <= 80
// Regular Bullish
oscHL = osc[lbR] > ta.valuewhen(plFound, osc[lbR], 1) and _inRange(plFound[1])
priceLL = low[lbR] < ta.valuewhen(plFound, low[lbR], 1)
bullCond = plotBullish and priceLL and oscHL and plFound
plot(plFound ? osc[lbR] : na, offset=-lbR, title=”Regular Bullish”, linewidth=2, color=(bullCond ? bullColor : noneColor))
plotshape(bullCond ? osc[lbR] : na, offset=-lbR, title=”Regular Bullish Label”, text=” Bull “, style=shape.labelup, location=location.absolute, color=bullColor, textcolor=textColor)
// Hidden Bullish
oscLL = osc[lbR] < ta.valuewhen(plFound, osc[lbR], 1) and _inRange(plFound[1])
priceHL = low[lbR] > ta.valuewhen(plFound, low[lbR], 1)
hiddenBullCond = plotHiddenBull and priceHL and oscLL and plFound
plot(plFound ? osc[lbR] : na, offset=-lbR, title=”Hidden Bullish”, linewidth=2, color=(hiddenBullCond ? hiddenBullColor : noneColor))
plotshape(hiddenBullCond ? osc[lbR] : na, offset=-lbR, title=”Hidden Bullish Label”, text=” H Bull “, style=shape.labelup, location=location.absolute, color=bullColor, textcolor=textColor)
// Regular Bearish
oscLH = osc[lbR] < ta.valuewhen(phFound, osc[lbR], 1) and _inRange(phFound[1])
priceHH = high[lbR] > ta.valuewhen(phFound, high[lbR], 1)
bearCond = plotBear and priceHH and oscLH and phFound
plot(phFound ? osc[lbR] : na, offset=-lbR, title=”Regular Bearish”, linewidth=2, color=(bearCond ? bearColor : noneColor))
plotshape(bearCond ? osc[lbR] : na, offset=-lbR, title=”Regular Bearish Label”, text=” Bear “, style=shape.labeldown, location=location.absolute, color=bearColor, textcolor=textColor)
// Hidden Bearish
oscHH = osc[lbR] > ta.valuewhen(phFound, osc[lbR], 1) and _inRange(phFound[1])
priceLH = high[lbR] < ta.valuewhen(phFound, high[lbR], 1)
hiddenBearCond = plotHiddenBear and priceLH and oscHH and phFound
plot(phFound ? osc[lbR] : na, offset=-lbR, title=”Hidden Bearish”, linewidth=2, color=(hiddenBearCond ? hiddenBearColor : noneColor))
plotshape(hiddenBearCond ? osc[lbR] : na, offset=-lbR, title=”Hidden Bearish Label”, text=” H Bear “, style=shape.labeldown, location=location.absolute, color=bearColor, textcolor=textColor)
//Alerts
alertcondition(bullCond, “Bullish Divergence”, “Bullish Divergence”)
alertcondition(bearCond, “Bearish Divergence”, “Bearish Divergence”)
alertcondition(ta.crossover(zScore, zma), “Bullish Swing”, “Bullish Swing”)
alertcondition(ta.crossunder(zScore, zma), “Bearish Swing”, “Bearish Swing”)
alertcondition(osCondition and zScore[1] < zScore, “Bullish Reversal”, “Bullish Reversal”)
alertcondition(osCondition and zScore[1] < zScore, “Bearish Divergence”, “Bearish Divergence”)