traduzione codice TW Rolling Point of Control (POC) [AlgoAlpha]

Viewing 6 posts - 1 through 6 (of 6 total)
  • Author
    Posts
  • #231872 quote
    Msport71Msport71
    Participant
    Senior

    Buongiorno,

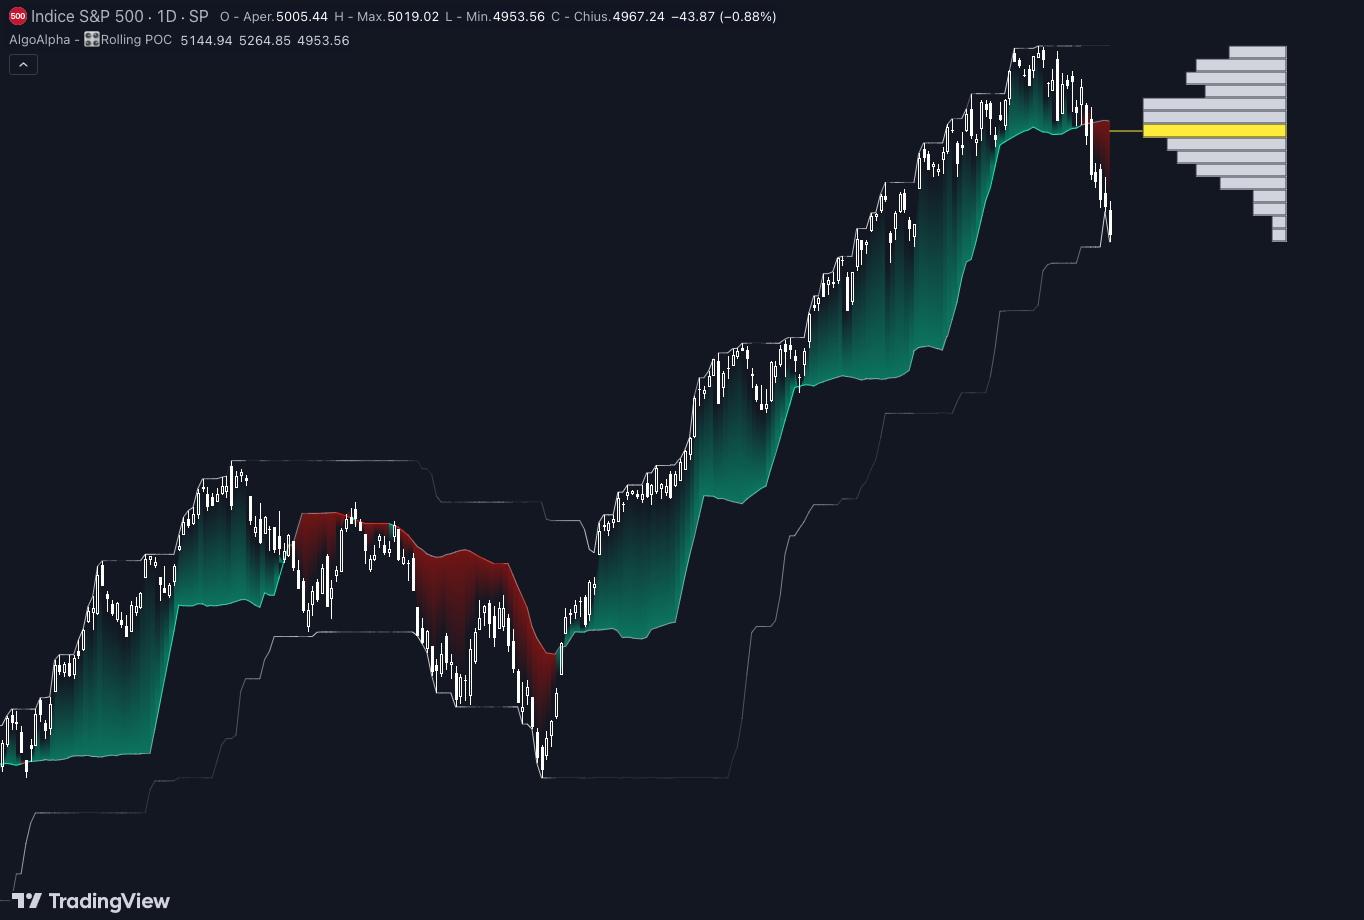
    sono a richiedere cortese traduzione codice in oggetto che sembra molto interessante, semrerebbe canale di Donchian con l’aggiunta dell’analisi volumetrica con il POC.

    Ringrazio sempre per la cortese collaborazione.


    https://it.tradingview.com/script/fy2QqfLG-Rolling-Point-of-Control-POC-AlgoAlpha/

    //@version=5
    indicator(“Rolling Point of Control [AlgoAlpha]”, “AlgoAlpha – Rolling POC”,overlay = true, max_boxes_count = 500)

    ptype = input.string(“Volume Profile”, “Profile Type”, [“Volume Profile”, “Price Profile”])
    plook = input.int(40, “Profile Lookback”)
    res = input.int(15, “Profile Resolution”)
    scale = input.int(30, “Profile Horizontal Scale”)
    hlen = input.int(25, “Trend Period”)
    s = input.bool(true, “Smooth POC”)
    f = input.bool(true, “Show Fill”)
    h = input.bool(true, “Show Profile”)
    t = input.bool(false, “Show Trend”)
    green = input.color(#00ffbb, “Up Color”)
    red = input.color(#ff1100, “Down Color”)
    yel = input.color(color.yellow, “Highlight Color”)

    neut = chart.fg_color
    var poc = 0.0
    var left = 0
    top_boundaries = array.new_float(res)
    bottom_boundaries = array.new_float(res)
    binlen = array.new_float(res)
    var boxes = array.new_box()
    var lines = array.new_line()
    highs = array.new_float()
    lows = array.new_float()
    volumes = array.new_float()

    for i = 0 to bar_index – (bar_index – plook)
    highs.push(high[i])
    lows.push(low[i])
    volumes.push(volume[i])

    maxx = array.max(highs)
    minn = array.min(lows)
    size = array.size(highs)

    while boxes.size() > 0
    boxes.shift().delete()
    while lines.size() > 0
    lines.shift().delete()

    if size > 0
    step = (maxx – minn) / res
    granularity = res
    for i = 0 to granularity – 1
    bin_size = 0.0
    bottom = minn + (i*step)
    top = minn + ( (i+1)*step )
    bottom_boundaries.insert(i, bottom)
    top_boundaries.insert(i, top)
    for j = 0 to array.size(highs) – 1
    candle_above_hbar = lows.get(j) > top
    candle_below_hbar = highs.get(j) < bottom
    is_candle_in_bucket = not (candle_above_hbar or candle_below_hbar)
    bin_size += is_candle_in_bucket ? (ptype == “Volume Profile” ? volumes.get(j) : 1) : 0
    array.insert(binlen, i, bin_size)
    boc = binlen.max()
    boci = binlen.indexof(boc) > 0 ? binlen.indexof(boc) : 0
    poc := math.avg(top_boundaries.get(boci), bottom_boundaries.get(boci))

    hpoc = ta.wma(poc, hlen)
    rh = ta.highest(plook)
    rl = ta.lowest(plook)

    for i = 0 to res – 1
    box_right = bar_index + 7 + scale//binlen.max()
    box_left = box_right – math.round(binlen.get(i))/math.round(binlen.max()) * scale
    box_top = array.get(top_boundaries, i)
    box_bottom = array.get(bottom_boundaries, i)
    left := box_left
    boxes.push(h ? box.new(box_left, box_top, box_right, box_bottom, border_style = line.style_solid, border_color = color.black, border_width = 1, bgcolor = binlen.max() == binlen.get(i) ? yel : neut) : na)

    lines.push(h ? line.new(bar_index, poc, left, poc, color = yel) : na)

    poc := s ? ta.sma(poc, math.round(math.sqrt(plook))) : poc // smoothens POC after line is drawn

    pocgreen = color.from_gradient(close-poc, 0, ta.highest(close-poc, plook/2), color.new(green, 0), color.new(chart.fg_color, 40))
    pocred = color.from_gradient(poc-close, 0, ta.highest(poc-close, plook/2), color.new(red, 0), color.new(chart.fg_color, 40))
    rangehighcol = color.from_gradient(rh-close, 0, ta.highest(rh-close, plook/2), color.new(neut, 0), color.new(chart.fg_color, 90))
    rangelowcol = color.from_gradient(close-rl, 0, ta.highest(close-rl, plook/2), color.new(neut, 0), color.new(chart.fg_color, 90))

    price = plot(close > poc ? low : high, display = display.none)
    pocline = plot(poc, color = close > poc ? pocgreen : pocred)
    hma = plot(hpoc, color = hpoc > hpoc[1] ? green : red, display = t ? display.all : display.none)
    hma1 = plot(hpoc[1], color = hpoc > hpoc[1] ? green : red, display = t ? display.all : display.none)
    plot(rh, color = rangehighcol)
    plot(rl, color = rangelowcol)

    fill(price, pocline, close > poc ? low : high, poc, close > poc ? color.new(green, 100) : color.new(red, 100), close > poc ? color.new(green, 60) : color.new(red, 60), display = f ? display.all : display.none)
    fill(hma, hma1, hpoc > hpoc[1] ? green : red, display = t ? display.all : display.none)

    //Alerts
    alertcondition(ta.cross(close, poc), “Price Crossing Point of Control”)
    alertcondition(ta.crossover(close, poc), “Price Crossing Over Point of Control”)
    alertcondition(ta.crossunder(close, poc), “Price Crossing Under Point of Control”)

    alertcondition(ta.cross(hpoc, hpoc[1]), “Trend Change”)
    alertcondition(ta.crossover(hpoc, hpoc[1]), “Bullish Trend Change”)
    alertcondition(ta.crossunder(hpoc, hpoc[1]), “Bearish Trend Change”)

    Screenshot-2024-04-24-at-09-01-49-Rolling-Point-of-Control-POC-AlgoAlpha-—-Indicatore-di-AlgoAlpha.png Screenshot-2024-04-24-at-09-01-49-Rolling-Point-of-Control-POC-AlgoAlpha-—-Indicatore-di-AlgoAlpha.png
    #231968 quote
    Iván GonzálezIván González
    Moderator
    Legend

    Ecco la traduzione.
    https://www.prorealcode.com/prorealtime-indicators/rolling-poc-volume-profile-indicator/

    //------------------------------------------------------//
    //PRC_Rolling POC Volume profile
    //version = 0
    //26.04.24
    //Iván González @ www.prorealcode.com
    //Sharing ProRealTime knowledge
    //------------------------------------------------------//
    defparam drawonlastbaronly = true
    //-----Inputs-------------------------------------------//
    plook=40
    res=15
    scale=30
    hlen=25
    smoothPOC=1
    showchannel=1
    showtrend=0
    //------------------------------------------------------//
    //-----Create arrays for High, Low and volume-----------//
    maxx = highest[plook](high)
    minn = lowest[plook](low)
    step = (maxx-minn)/res //height of the rectangle
    volsum=summation[plook](volume)
    startbar = barindex+7
    //------------------------------------------------------//
    //-----Calculation POC----------------------------------//
    for i=0 to res-1 do
    binsize=0
    volsize=0
    mybot=minn+(i*step)
    mytop=minn+((i+1)*step)
    $bottomboundaries[i]=mybot
    $topboundaries[i]=mytop
    for j=0 to plook-1 do
    if close[j]>=mybot and close[j]<=mytop then
    volsize=volsize+volume[j]
    endif
    next
    $VolLen[i]=volsize
    volbar = (volsize*res/volsum)*scale
    drawrectangle(startbar,mytop,startbar+volbar,mybot)fillcolor("black",70)
    next
    
    for k=0 to res-1 do
    if $VolLen[k]=ArrayMax($VolLen) then
    x = k
    break
    endif
    next
    
    poc = ($topboundaries[x]+$bottomboundaries[x])/2
    //------------------------------------------------------//
    //-----POC Bar and line---------------------------------//
    drawrectangle(startbar,$topboundaries[x],startbar+($VolLen[x]*res/volsum)*scale,$bottomboundaries[x])fillcolor("yellow",90)
    drawsegment(barindex,poc,startbar,poc)coloured("purple")style(dottedline)
    mypoc = round(poc,2)
    drawtext("POC = #mypoc#",round((startbar+startbar+($VolLen[x]*res/volsum)*scale)/2),poc+0.35*tr)coloured("red")
    //-----POC Smoothed
    if smoothPOC then
    smPOC = average[max(1,round(sqrt(plook)))](poc)
    else
    smPOC = poc
    endif
    if close > smpoc then
    r=0
    g=255
    b=80
    else
    r=255
    g=0
    b=0
    endif
    colorbetween(close,smPOC,r,g,b,50)
    //------------------------------------------------------//
    //-----Trend--------------------------------------------//
    if showtrend then
    hpoc = weightedaverage[hlen](poc)
    if hpoc >= hpoc[1] then
    rhpoc=0
    ghpoc=255
    else
    rhpoc=255
    ghpoc=0
    endif
    else
    hpoc = undefined
    endif
    //------------------------------------------------------//
    //-----Max and Min Channel------------------------------//
    if showchannel then
    rh = highest[plook](high)
    rl = lowest[plook](low)
    else
    rh = undefined
    rl = undefined
    endif
    //------------------------------------------------------//
    return smPOC as "POC smoothed" coloured(r,g,b),rh as "Max High"coloured("blue"), rl as "Min Low"coloured("blue"),hpoc as "Trend" coloured(rhpoc,ghpoc,0)style(line,3)
    #231974 quote
    StenozarStenozar
    Participant
    Master

    Ciao Ivan,

    ho copiato il codice ma mi viene un errore che dice: “Uno dei seguenti caratteri sarebbe più appropriato di un nome di variabile: next”

    come si può fare per correggere?

    #231977 quote
    Msport71Msport71
    Participant
    Senior

    Grazie e mille!

    A me funziona correttamente.

    #231978 quote
    JC_BywanJC_Bywan
    Moderator
    Master

    Buongiorno,

    forse stai usando la PRTv11 mentre questo codice è nella v12 solo a causa dell’istruzione fillcolor. E se v11 trova il fillcolor prima di “next”, crederà che fillcolor sia un nome di variabile personale e non come “next” dopo di esso, invece della definizione della variabile.

    Nella v11 puoi sostituire fillcolor(“black”,70) linea 40 con questo, se vuoi un rettangolo pieno:

    coloured("black",70) bordercolor("black",70)

    Oppure, se vuoi un rettangolo cavo nella v11:

    coloured("black",70)

    Stessa cosa linea 53 per fillcolor(“yellow”,90)

    Iván González thanked this post
    #231982 quote
    StenozarStenozar
    Participant
    Master

    Grazie, confermo che il problema era proprio quello, perchè utilizzo la v11.

    Grazie

Viewing 6 posts - 1 through 6 (of 6 total)

  • You must be logged in to reply to this topic.

ProRealAI ProRealAI New

Stuck on this ProBuilder code?

Describe what this topic is trying to build, in plain English, and ProRealAI writes the ProRealTime™ indicator, screener or system for you.

Available in 7 languages
Try ProRealAI

traduzione codice TW Rolling Point of Control (POC) [AlgoAlpha]


ProBuilder: Indicatori & Strumenti Personalizzati

New Reply
Author
author-avatar
Msport71 @carlo-pasca Participant
Summary

This topic contains 5 replies,
has 4 voices, and was last updated by StenozarStenozar

2 years, 4 months ago.

Topic Details
Forum: ProBuilder: Indicatori & Strumenti Personalizzati
Language: Italian
Started: 04/24/2024
Status: Active
Attachments: 1 files
ProRealCode ProRealCode
Loading...