traduzione codice TW Squeeze & Release

Viewing 8 posts - 1 through 8 (of 8 total)
  • Author
    Posts
  • #231101 quote
    Msport71
    Participant
    Senior

    Buongiorno


    scusate ho problemi ha postare e richiedere una traduzione del codice non so da cosa dipenda

    #231102 quote
    Msport71
    Participant
    Senior

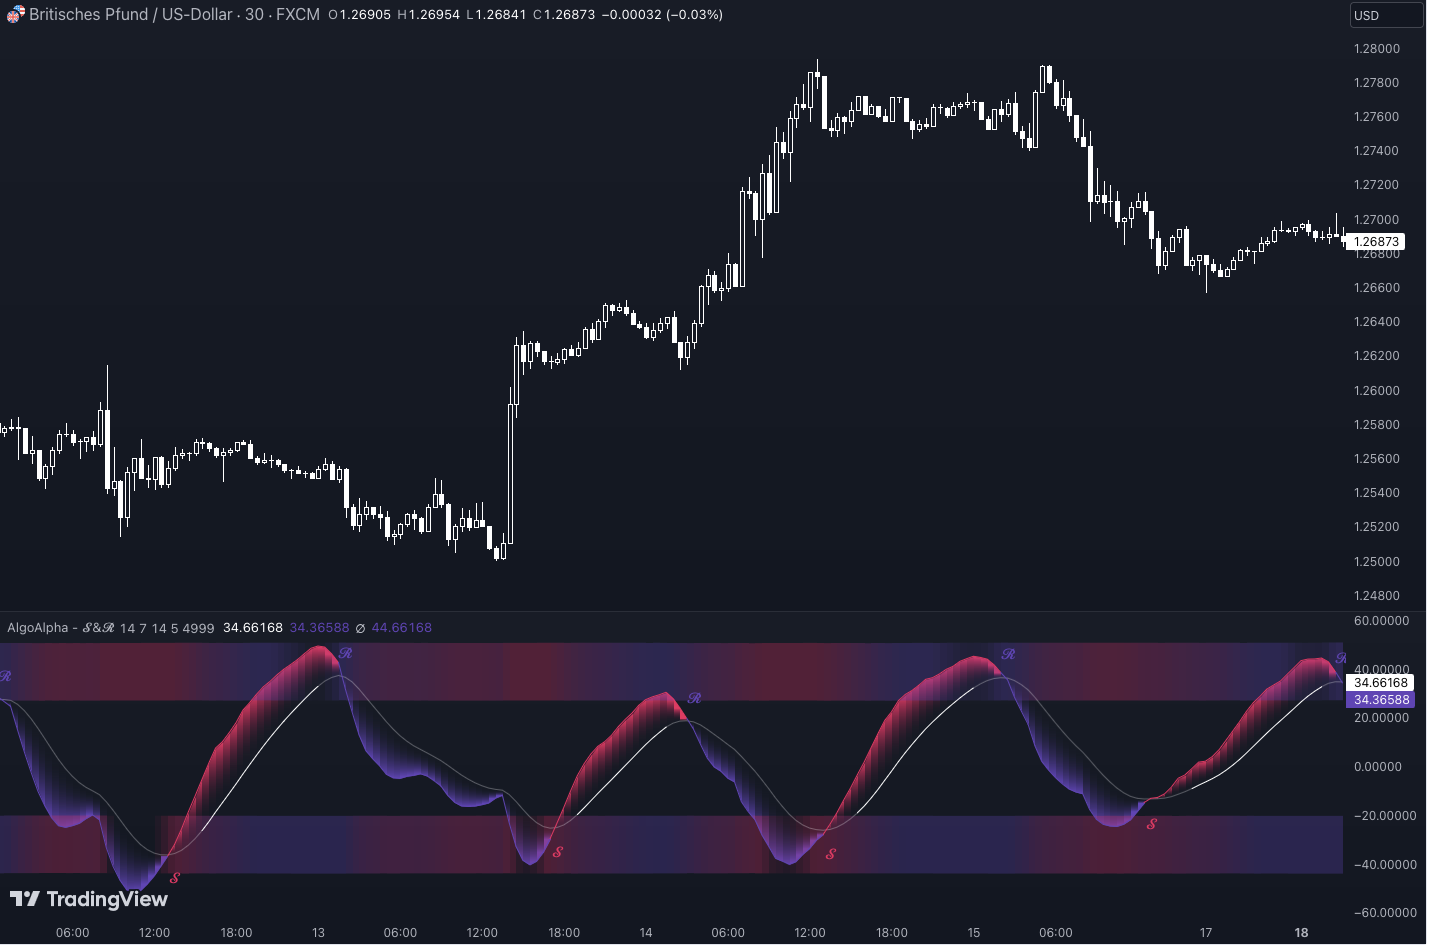
    https://it.tradingview.com/script/2rpsjnzA-Squeeze-Release-AlgoAlpha/


    allego link e foto senza script per vedere se dipende da quello


    Grazie

    Schermata-2024-04-05-alle-09.04.49.png Schermata-2024-04-05-alle-09.04.49.png
    #231253 quote
    Msport71
    Participant
    Senior

    Buon pomeriggio,


    sono appena riuscito a postare senza problemi nuova richiesta per altro codice di TW.

    A questo punto ho ragione di pensare che vi sia un filtro del forum che blocca i miei tentativi di postare lo script del codice (sia con copia e incolla direttamente nel topic oppure in un file di testo in pdf o word)

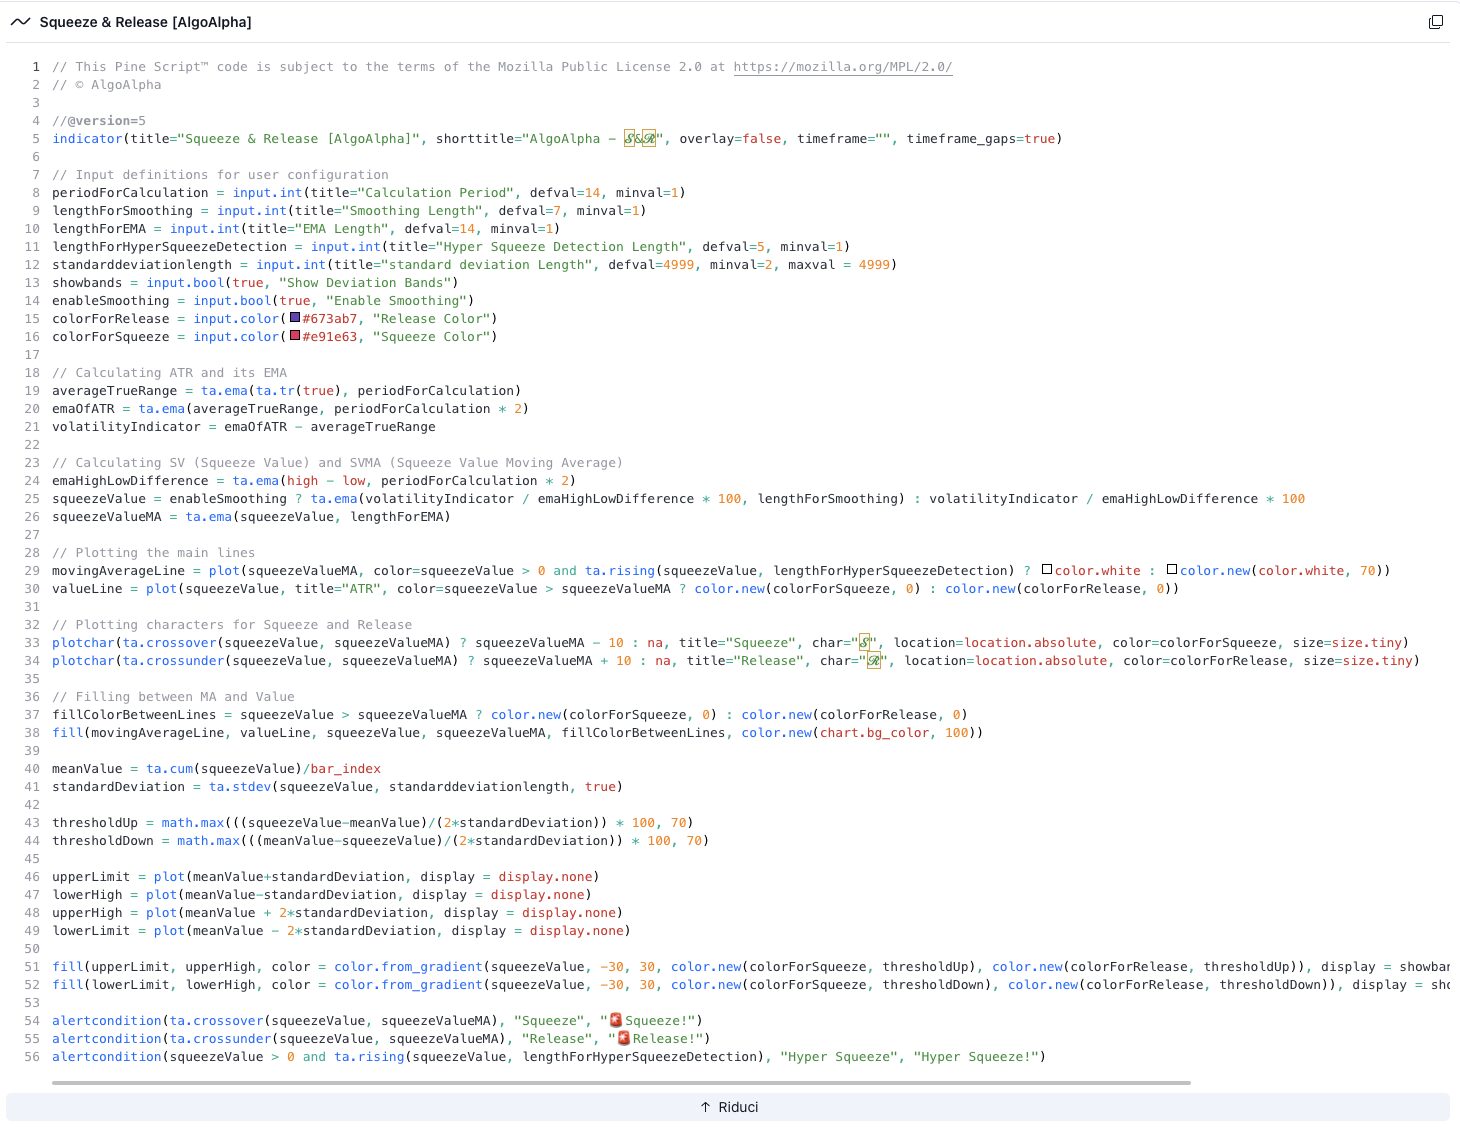
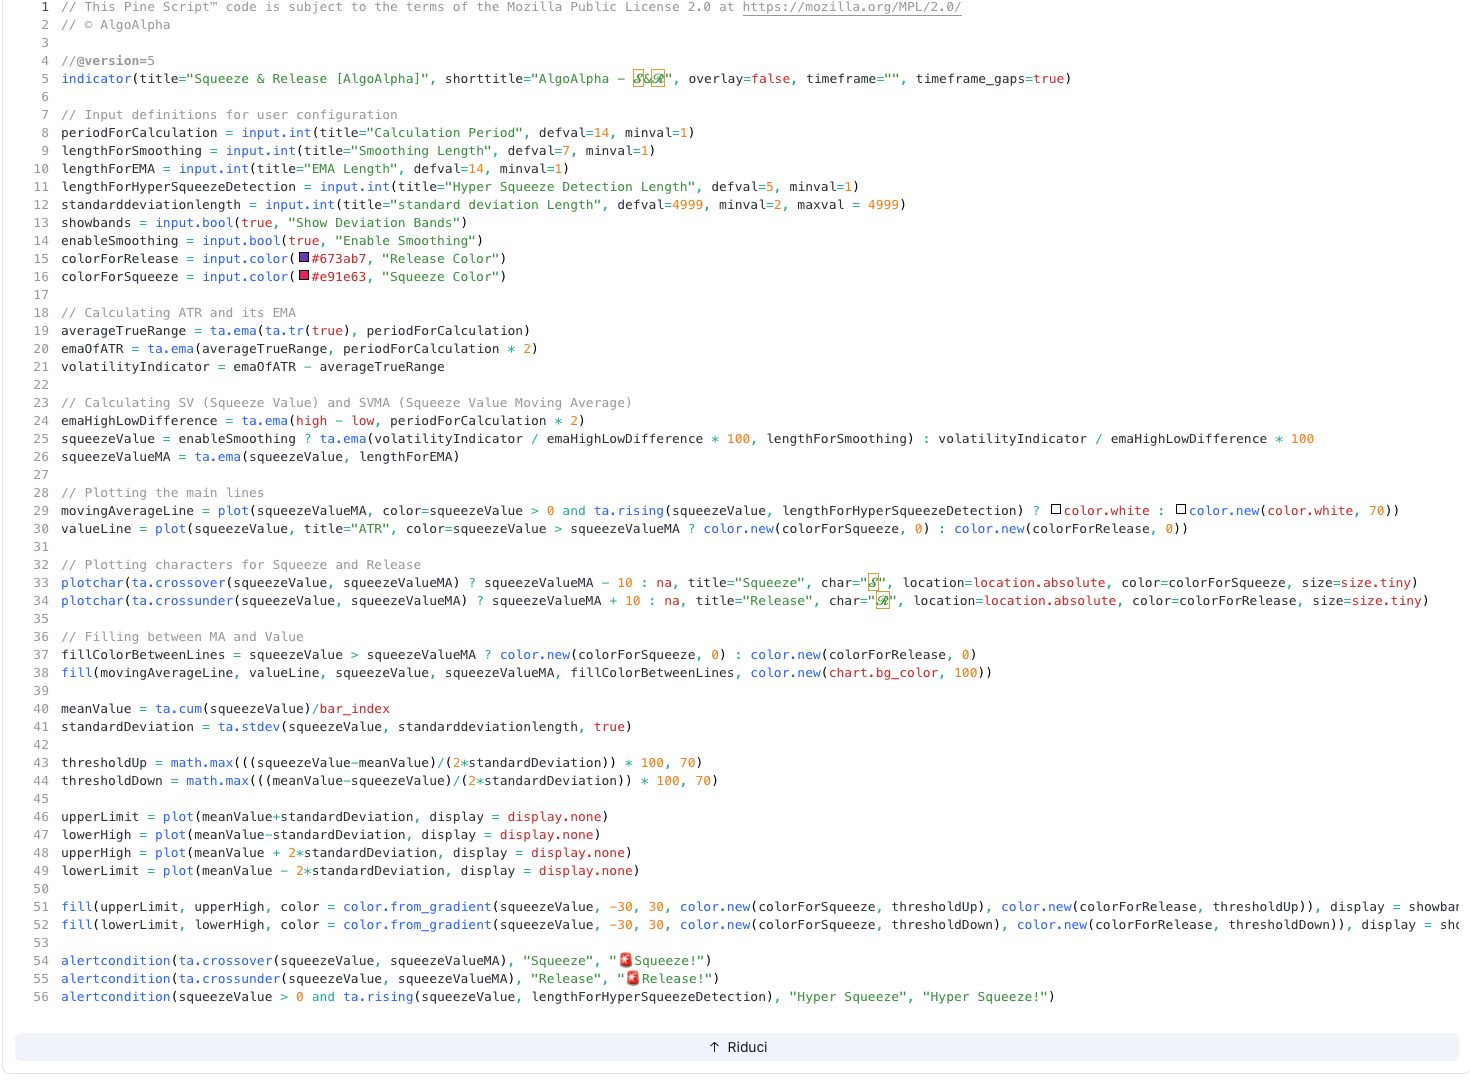
    Provo a postarlo come screenshot. Magari qualcuno dei moderatori è in grado di capire se c’è un termine o un carattere contenuto nello script che non va bene e bypassare il problema.

    Grazie per l’attenzione

    Screenshot-2024-04-08-at-18-20-55-Squeeze-—-Indicatori-e-segnali-—-TradingView.jpg Screenshot-2024-04-08-at-18-20-55-Squeeze-—-Indicatori-e-segnali-—-TradingView.jpg Schermata-2024-04-08-alle-18.25.01.jpg Schermata-2024-04-08-alle-18.25.01.jpg
    #231311 quote
    Nicolas
    Keymaster
    Legend

    Rispondo per prova (admin)

    #231313 quote
    JC_Bywan
    Moderator
    Master

    Rispondo per prova2 (admin)

    // This Pine Script™ code is subject to the terms of the Mozilla Public License 2.0 at https://mozilla.org/MPL/2.0/
    // © AlgoAlpha
    //@version=5
    indicator(title=”Squeeze & Release [AlgoAlpha]”, shorttitle=”AlgoAlpha -S and R”, overlay=false, timeframe=””, timeframe_gaps=true)
    // Input definitions for user configuration
    periodForCalculation = input.int(title=”Calculation Period”, defval=14, minval=1)
    lengthForSmoothing = input.int(title=”Smoothing Length”, defval=7, minval=1)
    lengthForEMA = input.int(title=”EMA Length”, defval=14, minval=1)
    lengthForHyperSqueezeDetection = input.int(title=”Hyper Squeeze Detection Length”, defval=5, minval=1)
    standarddeviationlength = input.int(title=”standard deviation Length”, defval=4999, minval=2, maxval = 4999)
    showbands = input.bool(true, “Show Deviation Bands”)
    enableSmoothing = input.bool(true, “Enable Smoothing”)
    colorForRelease = input.color(#673ab7, “Release Color”)
    colorForSqueeze = input.color(#e91e63, “Squeeze Color”)
    // Calculating ATR and its EMA
    averageTrueRange = ta.ema(ta.tr(true), periodForCalculation)
    emaOfATR = ta.ema(averageTrueRange, periodForCalculation * 2)
    volatilityIndicator = emaOfATR – averageTrueRange
    // Calculating SV (Squeeze Value) and SVMA (Squeeze Value Moving Average)
    emaHighLowDifference = ta.ema(high – low, periodForCalculation * 2)
    squeezeValue = enableSmoothing ? ta.ema(volatilityIndicator / emaHighLowDifference * 100, lengthForSmoothing) : volatilityIndicator / emaHighLowDifference * 100
    squeezeValueMA = ta.ema(squeezeValue, lengthForEMA)
    // Plotting the main lines
    movingAverageLine = plot(squeezeValueMA, color=squeezeValue > 0 and ta.rising(squeezeValue, lengthForHyperSqueezeDetection) ? color.white : color.new(color.white, 70))
    valueLine = plot(squeezeValue, title=”ATR”, color=squeezeValue > squeezeValueMA ? color.new(colorForSqueeze, 0) : color.new(colorForRelease, 0))
    // Plotting characters for Squeeze and Release
    plotchar(ta.crossover(squeezeValue, squeezeValueMA) ? squeezeValueMA – 10 : na, title=”Squeeze”, char=”S”, location=location.absolute, color=colorForSqueeze, size=size.tiny)
    plotchar(ta.crossunder(squeezeValue, squeezeValueMA) ? squeezeValueMA + 10 : na, title=”Release”, char=”R”, location=location.absolute, color=colorForRelease, size=size.tiny)
    // Filling between MA and Value
    fillColorBetweenLines = squeezeValue > squeezeValueMA ? color.new(colorForSqueeze, 0) : color.new(colorForRelease, 0)
    fill(movingAverageLine, valueLine, squeezeValue, squeezeValueMA, fillColorBetweenLines, color.new(chart.bg_color, 100))
    meanValue = ta.cum(squeezeValue)/bar_index
    standardDeviation = ta.stdev(squeezeValue, standarddeviationlength, true)
    thresholdUp = math.max(((squeezeValue-meanValue)/(2*standardDeviation)) * 100, 70)
    thresholdDown = math.max(((meanValue-squeezeValue)/(2*standardDeviation)) * 100, 70)
    upperLimit = plot(meanValue+standardDeviation, display = display.none)
    lowerHigh = plot(meanValue-standardDeviation, display = display.none)
    upperHigh = plot(meanValue + 2*standardDeviation, display = display.none)
    lowerLimit = plot(meanValue – 2*standardDeviation, display = display.none)
    fill(upperLimit, upperHigh, color = color.from_gradient(squeezeValue, -30, 30, color.new(colorForSqueeze, thresholdUp), color.new(colorForRelease, thresholdUp)), display = showbands ? display.all : display.none)
    fill(lowerLimit, lowerHigh, color = color.from_gradient(squeezeValue, -30, 30, color.new(colorForSqueeze, thresholdDown), color.new(colorForRelease, thresholdDown)), display = showbands ? display.all : display.none)
    alertcondition(ta.crossover(squeezeValue, squeezeValueMA), “Squeeze”, “Squeeze!”)
    alertcondition(ta.crossunder(squeezeValue, squeezeValueMA), “Release”, “Release!”)
    alertcondition(squeezeValue > 0 and ta.rising(squeezeValue, lengthForHyperSqueezeDetection), “Hyper Squeeze”, “Hyper Squeeze!”)
    #231314 quote
    JC_Bywan
    Moderator
    Master

    Ok, ho dovuto sostituire nello script tradingview S e R con un font più classico, ed eliminare le luci davanti a Squeeze e Release

    #231316 quote
    Iván González
    Moderator
    Legend

    Esatto, quello era il problema 🙁

    //PRC_Squeeze & Release
    //version = 0
    //08.04.24
    //Iván González @ www.prorealcode.com
    //Sharing ProRealTime knowledge
    //-----Inputs-----------------------------------------//
    periodForCalculation=14 //Calculation Period
    lengthForSmoothing=7 //Smoothing Length
    lengthForEMA=14 //EMA Length
    lengthForHyperSqueezeDetection=5 //Hyper Squeeze Detection Length
    standarddeviationlength=min(barindex,4999) //
    enableSmoothing=1 //Enable Smoothing
    //-----------------------------------------------------//
    //-----Calculating ATR and its EMA---------------------//
    atr = average[periodForCalculation,1](TR(close))
    emaofATR = average[periodForCalculation*2,1](atr)
    volatilityIndicator = emaofATR - atr
    //-----------------------------------------------------//
    //-----Calculating SV (Squeeze Value) and SVMA (Squeeze Value Moving Average)//
    emaHighLowDifference=average[periodForCalculation*2](high-low)
    if enableSmoothing then
    squeezeValue=average[lengthForSmoothing,1](volatilityIndicator / emaHighLowDifference * 100)
    else
    squeezeValue=volatilityIndicator / emaHighLowDifference * 100
    endif
    squeezeValueMA=average[lengthForEMA,1](squeezeValue)
    //-----------------------------------------------------//
    //-----Color Main Line---------------------------------//
    if squeezeValue>0 and squeezeValue>=highest[lengthForHyperSqueezeDetection](squeezeValue) then
    ra=0
    ga=0
    ba=0
    alpha=100
    else
    ra=124
    ga=124
    ba=124
    alpha=70
    endif
    
    if squeezeValue > squeezeValueMA then
    //colorForSqueeze r=233/g=30/b=99
    r=233
    g=30
    b=99
    else
    //colorForRelease r=103/g=58/b=103
    r=103
    g=58
    b=103
    endif
    //-----------------------------------------------------//
    //----Plotting characters for Squeeze and Release-------//
    if squeezeValue crosses over squeezeValueMA then
    drawtext("S",barindex,squeezeValueMA - 10)coloured(233,30,99)
    elsif squeezeValue crosses under squeezeValueMA then
    drawtext("R",barindex,squeezeValueMA + 10)coloured(103,58,103)
    endif
    //-----------------------------------------------------//
    //-----Filling between MA and Value--------------------//
    COLORBETWEEN(squeezeValueMA,squeezeValue,r,g,b)
    //-----------------------------------------------------//
    if barindex <= periodForCalculation*3+lengthForEMA then
    meanvalue=0
    squeezeValue=0
    else
    meanValue=summation[barindex](squeezeValue)/barindex
    standardDeviation=std[standarddeviationlength](squeezeValue)
    endif
    
    thresholdUp=max((squeezeValue-meanValue)/(2*standardDeviation) * 100, 70)
    thresholdDown=max((meanValue-squeezeValue)/(2*standardDeviation) * 100, 70)
    
    upperLimit=meanValue+standardDeviation
    lowerHigh=meanValue-standardDeviation
    upperHigh=meanValue + 2*standardDeviation
    lowerLimit=meanValue - 2*standardDeviation
    
    colorbetween(upperLimit,upperHigh,r,g,b,30)
    colorbetween(lowerHigh,lowerLimit,r,g,b,30)
    
    //-----------------------------------------------------//
    return squeezeValue as "ATR"coloured(r,g,b)style(line,2),squeezeValueMA as "MovingAverageLine"coloured(ra,ga,ba)style(line,3)
    
    #231327 quote
    Msport71
    Participant
    Senior

    Grazie a tutti per l’aiuto.

    Buona serata.

Viewing 8 posts - 1 through 8 (of 8 total)
  • You must be logged in to reply to this topic.

ProRealAI ProRealAI New

Stuck on this ProBuilder code?

Describe what this topic is trying to build, in plain English, and ProRealAI writes the ProRealTime™ indicator, screener or system for you.

Available in 7 languages
Try ProRealAI

traduzione codice TW Squeeze & Release


ProBuilder: Indicatori & Strumenti Personalizzati

New Reply
Author
author-avatar
Msport71 @carlo-pasca Participant
Summary

This topic contains 7 replies,
has 4 voices, and was last updated by Msport71
2 years, 5 months ago.

Topic Details
Forum: ProBuilder: Indicatori & Strumenti Personalizzati
Language: Italian
Started: 04/05/2024
Status: Active
Attachments: 3 files
Logo Logo
Loading...