Bard
BardParticipant
Master
It is also interesting to note that the strategy definitely performed better on Sunday’s, Monday’s and Friday’s and performance dipped off midweek. Perhaps as a start of the week and end of the week only strategy it has some potential but then we start to enter the world of data mining and we don’t want to go there. https://www.prorealcode.com/topic/day-month-year-strategy-robustness-tester/#post-106753
Friday’s can have heavy volume and in not always the same direction the market opens in. Friday’s direction can also set the tone for the coming week with Monday continuing in the same direction. I haven’t studied if this is statistically significant but from personal experience I always lost more money on Friday’s than any other day. I think because of those reversals and also because of trade reports like NFP’s coming out which could occasionally be dramatic. It got to the point where, when Fridays rolled around, I would usually just go “Meh”.. and play guitar instead!
Friday’s can have heavy volume
Quite often a lot of that volume can be at the end of the day when markets are just about to close for the weekend and traders are closing down their positions to be safe just in case WW3 or a pandemic breaks out over the weekend whilst they have no way to exit. In fact for the brave buying when everyone else is selling on a Friday evening just before the close can be quite lucrative as long as you can accept the risk of WW3 and don’t mind paying over weekend fees.
Hi everybody,
I just found this topic and I thing is really great idea, thanks Vonassi and all the contributors.
I am starting to try it with my systems and I have a couple of questions:
- I am using the 10-10, 20-5 and 21-5 values that it seems you use and it looks to me like the 20/5 and 21/5 results are quite similar, is there any reason to use these and not others with more differences?
- In my tries and some of the posted here I found that some times the worst or best results are the ones that have less trades, so few that I think is not very representative. As the score is based in the difference betwenn the best and the worst these seem to have too much importance in the score IMO. Do you think it would be a good idea to not use the bests and the worsts results in the calculation of the score?
Yes I think I said before somewhere in this topic that you have be wary of tests with low numbers of trades and adust QTY and RANDOM accordingly. It is better to have fewer tests but with more trades in each of them than more tests and the ones at the extremes having very few trades. A test with only a handful of trades but they all win is as meaningless as a test with only a handful of trades but they all lose. Every strategy will have different requirements for the QTY and RANDOM combination that will return a meaningful test.
Using just the best and the worst is not a good idea because the best could be 1 trade that won a lot so 100% win percentage and massive average gain per trade.
Hey @vonasi i think i’ve found something strange into the RT. I noticed that if i run a test and then i close and restart the platform, doing again the test without changing NOTHING will retrieve different results (on some algos just small differences, on others also 10pts of score average of difference) Am i missing something on the theorics of the RT or is something really wrong? (I am 100% sure that i perform the tests good, i do that since months, but i noticed casually now this strange thing) If this can help, this is the robustness code that i use:
//Robustness Tester
once j = 0
once flag = 1

if flag = 1 then
j = j + 1
if j > qty then
flag = -1
j = j - 1
endif
endif

if flag = -1 then
j = j - 1
if j = 0 then
j = j + random
flag = 1
endif
endif

tradeon = 0
if opendate >= 20000101 then
if barindex mod qty = 0 or barindex mod qty = j then
tradeon = 1
endif
endif
The only explanation can be that the data is different after the platform restart. If the first bar is a different starting point then you will get different trades and so different results.
Having said that if the startdate that you are using in the code is midway through the data sample then the results should be the same.
The robustness tester just allows trading in a variety of sequences of bars and these sequences will be the same every time if QTY and RANDOM are set the same so the only explanation for different results can be different data or different starting point or different ending point to the data tested.
After your instructions, I made a new RT routine: i set a fixed start end date for the backtest and matched the start date value with the opendate in the code.
Now everything seems work fine 🙂
EDIT: is the format of the date in the code: yearmonthday or yeardaymonth?
Hey
@vonasi, sorry for being disturbing.
I was thinking: i have an algo that works on morning entry on a forex pair; it opens at the same hour on random days when some conditions are reached, and closes at a certain hour apart from when a sl/tp is reached (Sometimes it opens a second trade if the first one is closed before the “ending” hour).
With an algo like this, is a robustness test useful? If not, what would be the benefit of randomizing the trades if they’re linked to a certain hour for the opening (also if with some conditions needed)
Doing the RT on this algo shows a final 3 pairs average of over 70 pts, that’s why im doubtful.
My robustness tester is all about seeing the trades that your normal back test might not see because it is already on the market. Whether that is a daily strategy that might be on the market for a day and so misses tomorrows trade or a 1 second strategy that is on the market for five seconds and so misses four other possible trades in those five seconds the reason for it is the same thing. If you have a strategy where the trades are widely spaced and few and far between and not on the market for very long then the robustness test will tell you not a lot about your strategy.
I am more of a daily/weekly kind of strategy guy (because spread is our enemy) and at the moment I am learning an awful lot about my strategy ideas from my SEB testing (strategy every bar). I am running back tests that let me see 100% of all possible trades available in my data sample and then I can compare that to the standard back test that often only lets me see 40% or less of all possible trades. If 100% of all trades perform equally or better than 40% of trades then that is a fantastic out of sample test.
As I am a daily or weekly based trader then I can get away with 31 SEB tests or 312 SEB tests depending on how long I expect trades to be open for which is just about workable. It is time consuming to analyse the data but the results mean an awful lot. My VRT robustness tester is a powerful tool but it is not a tool that works equally on all strategies. My SEB testing however lets me see every possible trade but requires a lot of manual input of dragging and dropping into Excel to get the results. Trading on faster time frames exponentially increases this work load. I would love it if PRT could introduce a tool that allowed us to just check entry conditions on each individual bar and then let that trade play out and then add all the results together for each individual bar and then provide us with an all possible trade equity curve and statistics. That would be a very very powerful tool for eliminating curve fitting.
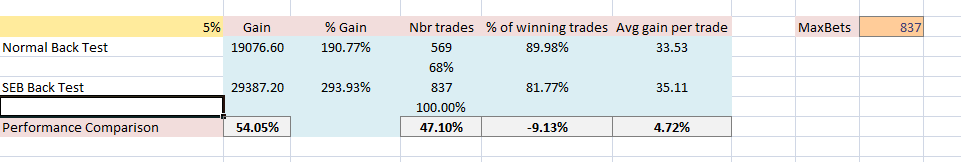
In the attached image you can see the comparison between a standard back test and the analysis of a SEB back test for a very simple daily DJI strategy.
The SEB test tested 47% more trades and the return was 54% higher. That is good. The win rate was 9% lower (bad).However the average gain per trade was almost 5% higher. That strategy definitely did not fail in the 68% in sample normal back test and 32% out of sample extra SEB trades.
Search for SEB or strategy every bar in the forums to find the topic and see how you can improve your OOS testing…. oh and beg PRT to add something similar with equity curves to the platform!
Your explanation was valid and exhaustive as usual, thank you for the patience.
Your SEB trading project is one of the most interesting things i’ve ever heard since i’m here, you are always one step ahead; congrats 🙂
But I have to make a note, don’t you think that besides diversifying on the markets, it can also be useful to diversify on timeframes and therefore in your case, try to have even “faster” algos in the portfolio?
For me faster time frames are just more difficult to see set ups in. Also they tend to lend themselves to strategies that spend less time in the market and the less time you spend in the market the harder it is to win the battle against spread. A 4 pip spread means that when trying to win 100 pips you need to pay 4% for that trade. Go for 1000 pips and you are only paying 0.4%. Looking for 1000 pips on a 5 minute chart is much harder than looking for it on a daily chart.
The lack of historical data on faster time frames is also a massive disadvantage. I think that when creating a strategy we need to remove as many disadvantages as possible and for me that means daily and weekly time frames and not minute and second time frames. I am not adverse to making decisions on slow time frames and then trying to find a better entry point on a faster time frame so as to benefit from lower spread when the market is actually open but so far my tests have not shown a massive advantage in doing this and in fact sometimes a disadvantage as price has moved so far from when I made my decision to enter – probably because a lot of other traders saw the same opportunity that I did!
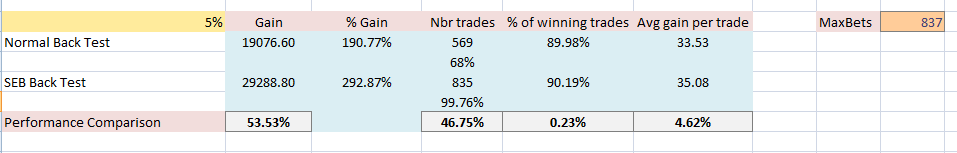
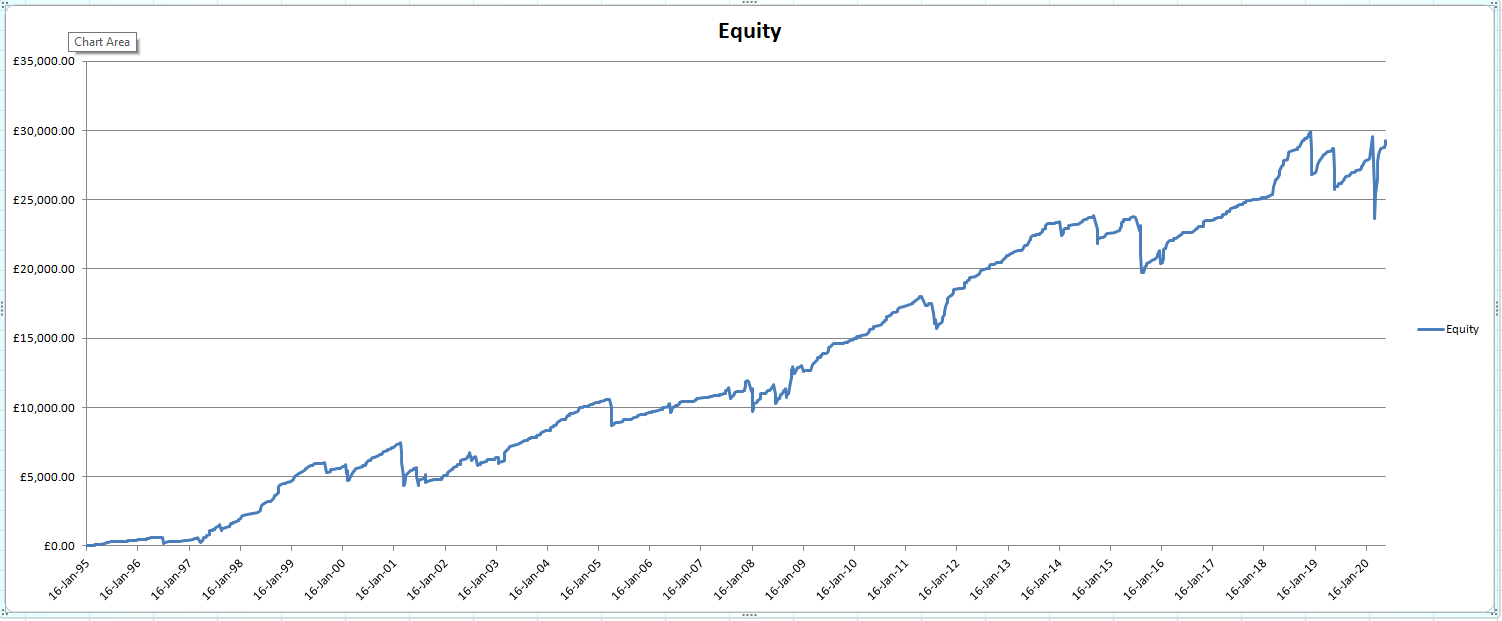
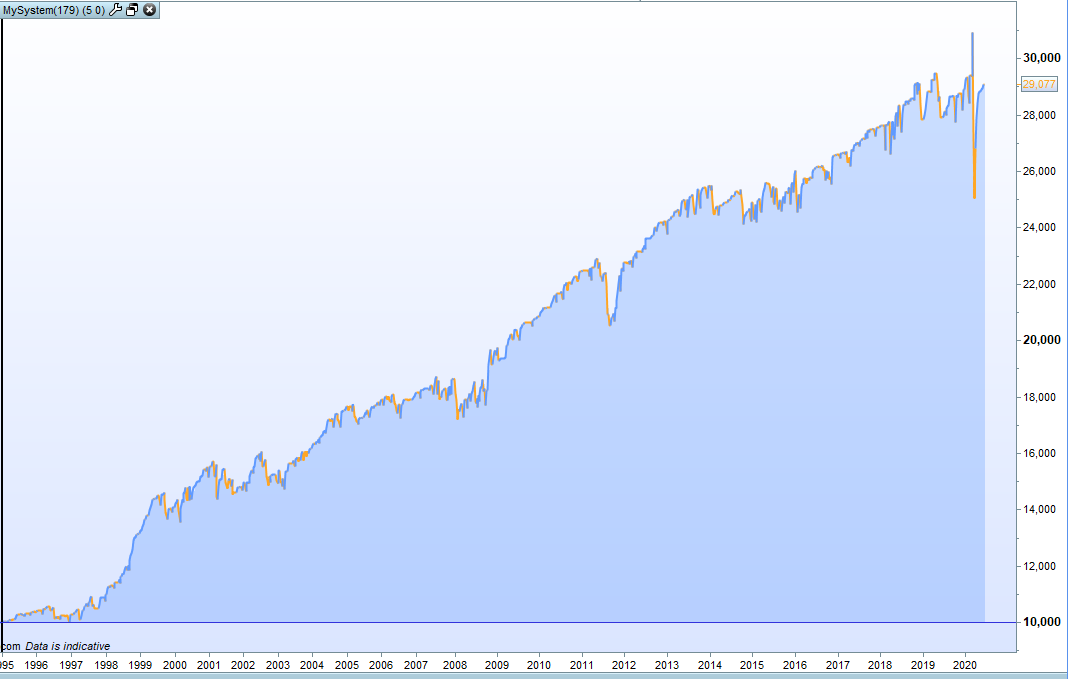
I just realised that my SEB results shown in the recent post were incorrect because the win rate was calculated using an average in which some days had no trades and so they dragged the win rate down – so I re-ran the test but using just 31 SEB tests (1 for each day of a month). This lower amount of tests also allowed me to drag and drop into Excel and create an equity curve to compare with the original back test equity curve. Results attached.
Adding in an extra almost 47% of out of sample trades increased the gain by over 53% which is good. The win rate was 0.23% higher and the average gain per trade went up by 4.62% which are both good results for adding in out of sample data to the original back test.
The equity curve is pretty similar in shape (except it finishes over £10212 higher!) There has not been much profit in the last couple of volatile years but the strategy has almost recovered any losses from that time. Definitely one to watch on a bit of forward testing as the out of sample trades performed better than the in sample trades. Knowing that we have tested virtually all possible trades and they performed better than the limited number of trades in a normal back test can give us confidence that we didn’t just get lucky and hit all the good trades while missing all the bad trades.
Dear
@Vonasi, thanks for this nice tool. I like to consult your opinion for my recent usage.
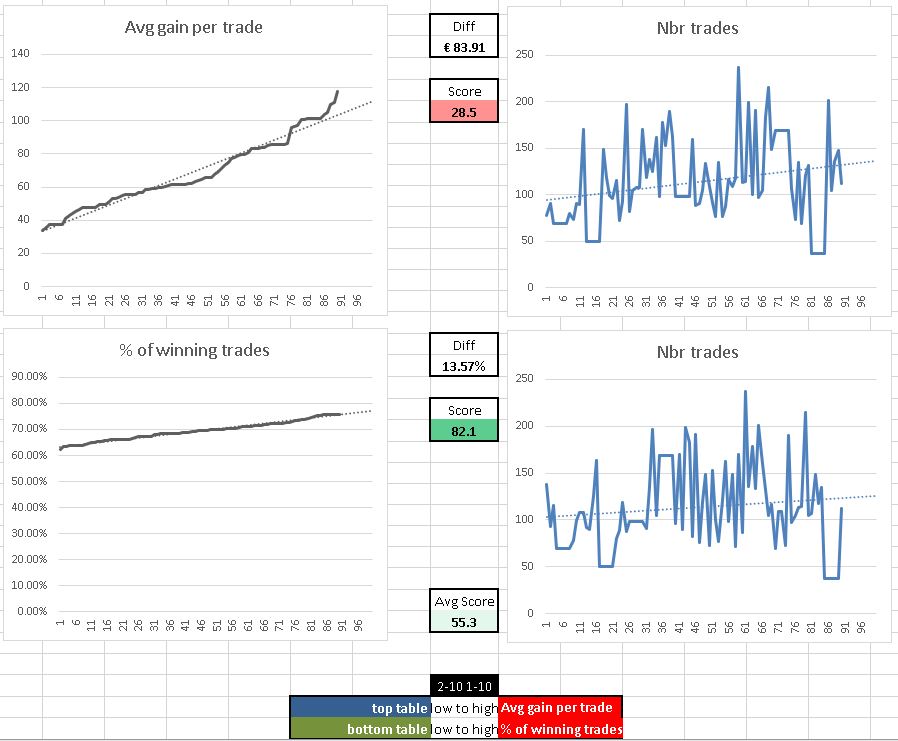
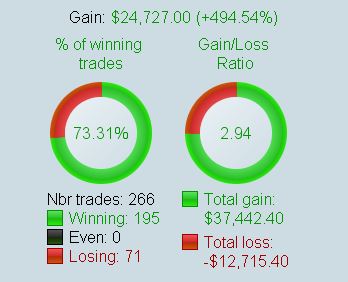
I have a strategy with about 266 trades, so I tested with VST initially using setting of 10-10, and in some of the combinations, the no. of tests came out too little, one of them just have 37 trades. So I feel this combination is not so applicable to my strategy, since the difference of trades are too much. I think this is one of your feedback in earlier post that people should adjust accordingly.
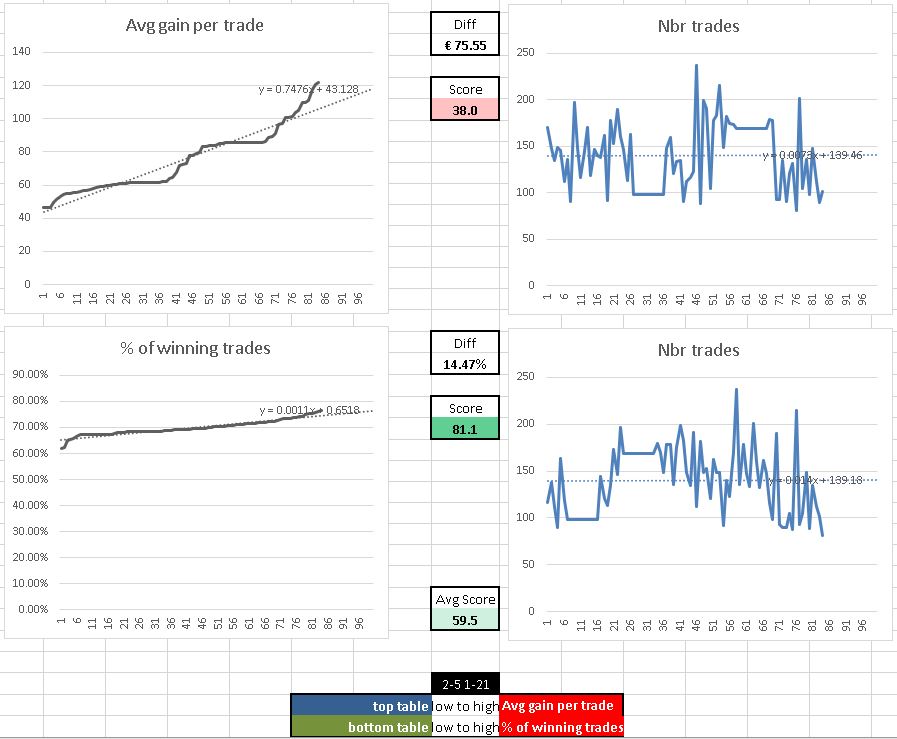
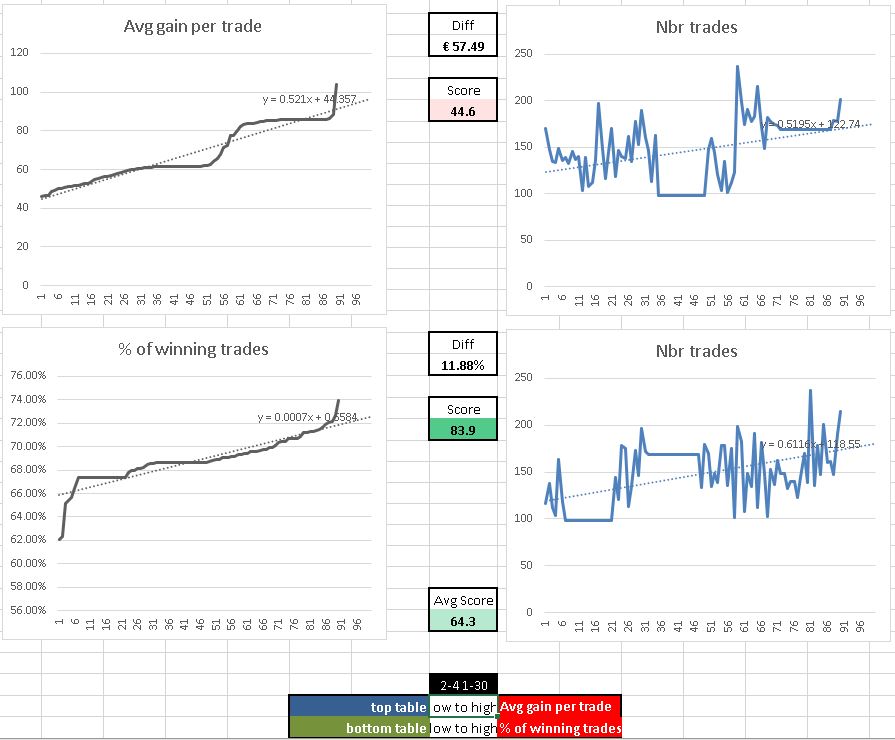
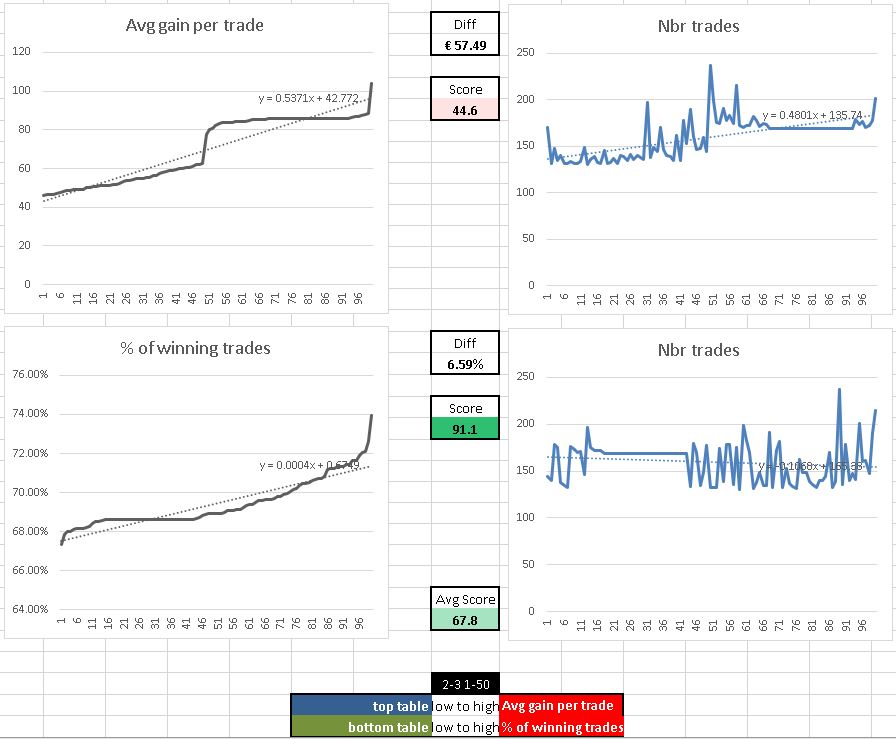
After that, I noticed the QTY is impacting no. of trades, so I reduce it and tested with 3 other sets of configurations, 5-21, 4-30 and 3-50. The lowest number of trades come back up close to 100 trades, which I think more reasonable.
The result on the 5-21, 4-30 and 3-50 is obviously better, but I’m cautious as well. In your opinion, is such changes reasonable? As I change the QTY to much lower so like to get your opinion. I attached also all 4 results in case it helps to illustrate my doubt.
Thanks in advance for your feedback.
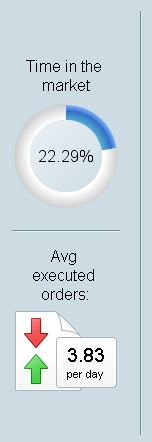
This is the original strategy result, for reference