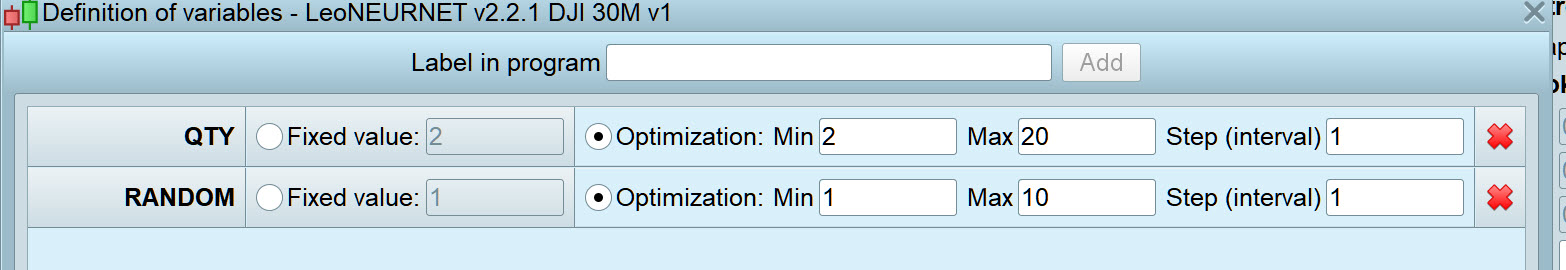
Ooops! – QTY should be 2 to 10 (not 1 to 10) and RANDOM 1 to 5. both steps of 1.
QTY should be 2 to 10
Yeah I did – 2 to 10 for Qty – as I was very deliberately following the idiots guide at that point as I didn’t know what I was doing! 🙂
So yeah all my results are good! I even just double checked! 🙂
Your image shows 2 to 20 and 1 to 10 not 2 to 10 and 1 to 5!
Yeah but that is okay?
I didn’t know what effect anything would have at that point so I went for a bigger range than you had said.
I take it you mean Qty 1 to 10 and RANDOM 1 to 5 … both in steps of 1?
I was just double checking as you said Qty 10 and RANDOM 5
Yeah I did – 2 to 10 for Qty –
I forgot what I used until I checked,
I only commented on the settings because you were creating a Google sheet for 10 5 and if you dragged 20 10 data in then all the charts would be wrong.
I’m addicted now! 🙂
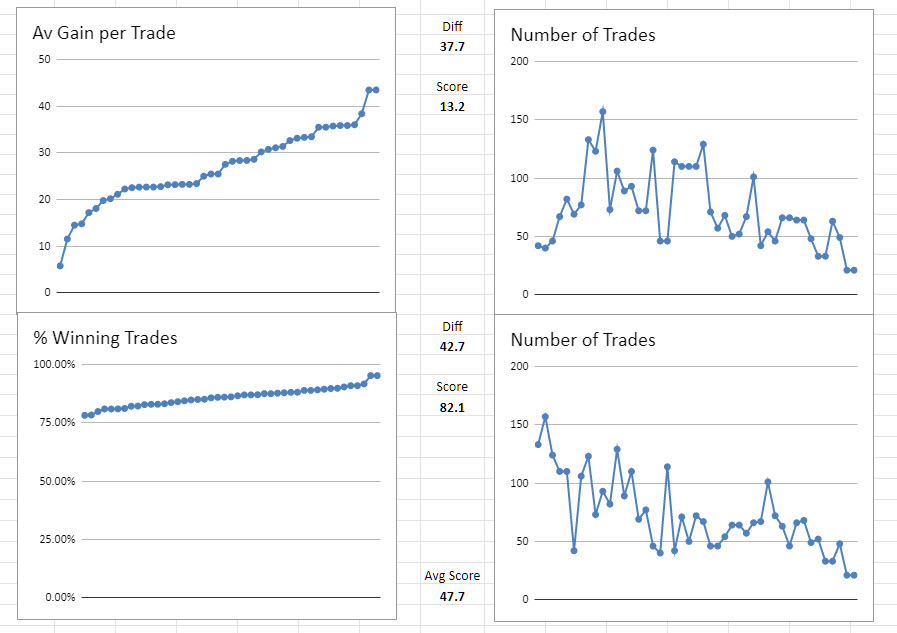
It’s good as it kinda confirms what I suspected – but all the same never fully trusted – that certain of my running Systems are okay to leave running and most others benefit from my intervention / exit if they show a healthy profit on a particular trade … bird in hand worth two in the bush!
Attached are VRT results from a System I’ve had running for over a year and which has steadily been adding to profit (up and down, but nothing alarming) and I can’t recall ever stepping in and been horrified at a mounting loss on any particular trade.
I would say the VRT stats while not fantastic bear out above previous thoughts on this System?
I am going to add the VRT score number ( 47.7 / 48 in this case ) to my System title in future so I know if any System is good, bad or mid!
Thank you Vonasi for sharing this valuable tool with us all and thank her ashore for leaving you in peace aboard your yacht over the last few days. It’s a pity you weren’t a bit nearer I could have returned the favour by coming round with my paint brushes or scraped a few barnacles off! 🙂
I’m glad you finally got your head around the tester and created your analysis graphs!
Perhaps you should share your Google version of the data analyser on here to save others having to fight the same war again?
Regarding that analysis graph – I would ignore the trades where the number of trades is quite low as they are a poor data sample for a test – in fact I have taken to clearing those rows from the worksheet which results in a broken line but gives a more accurate score if they are at either end of the graphed line.
On the point of barnacles – I never let another man touch my barnacles!
Re share … good idea!
Below is a link to a google sheets version of the Vonasi Robustness Tester (we can name it what you want?).
VRT Share
Google sheets does not allow drag and drop of data, but today I found an easy way to get data into sheets … no more drag to notebook then import as csv as I have been doing! 🙁
All we need to do is select the top row in PRT optimiser results then ctrl + c, wait 2 or 3 seconds then ctrl + v into a google sheet!
I guess the few seconds wait is to allow select all … but you can’t see any signs that the whole sheet is selected.
So with the above copy and paste and VTR Share Template you can complete the Analysis in a few minutes … after you get into a routine!
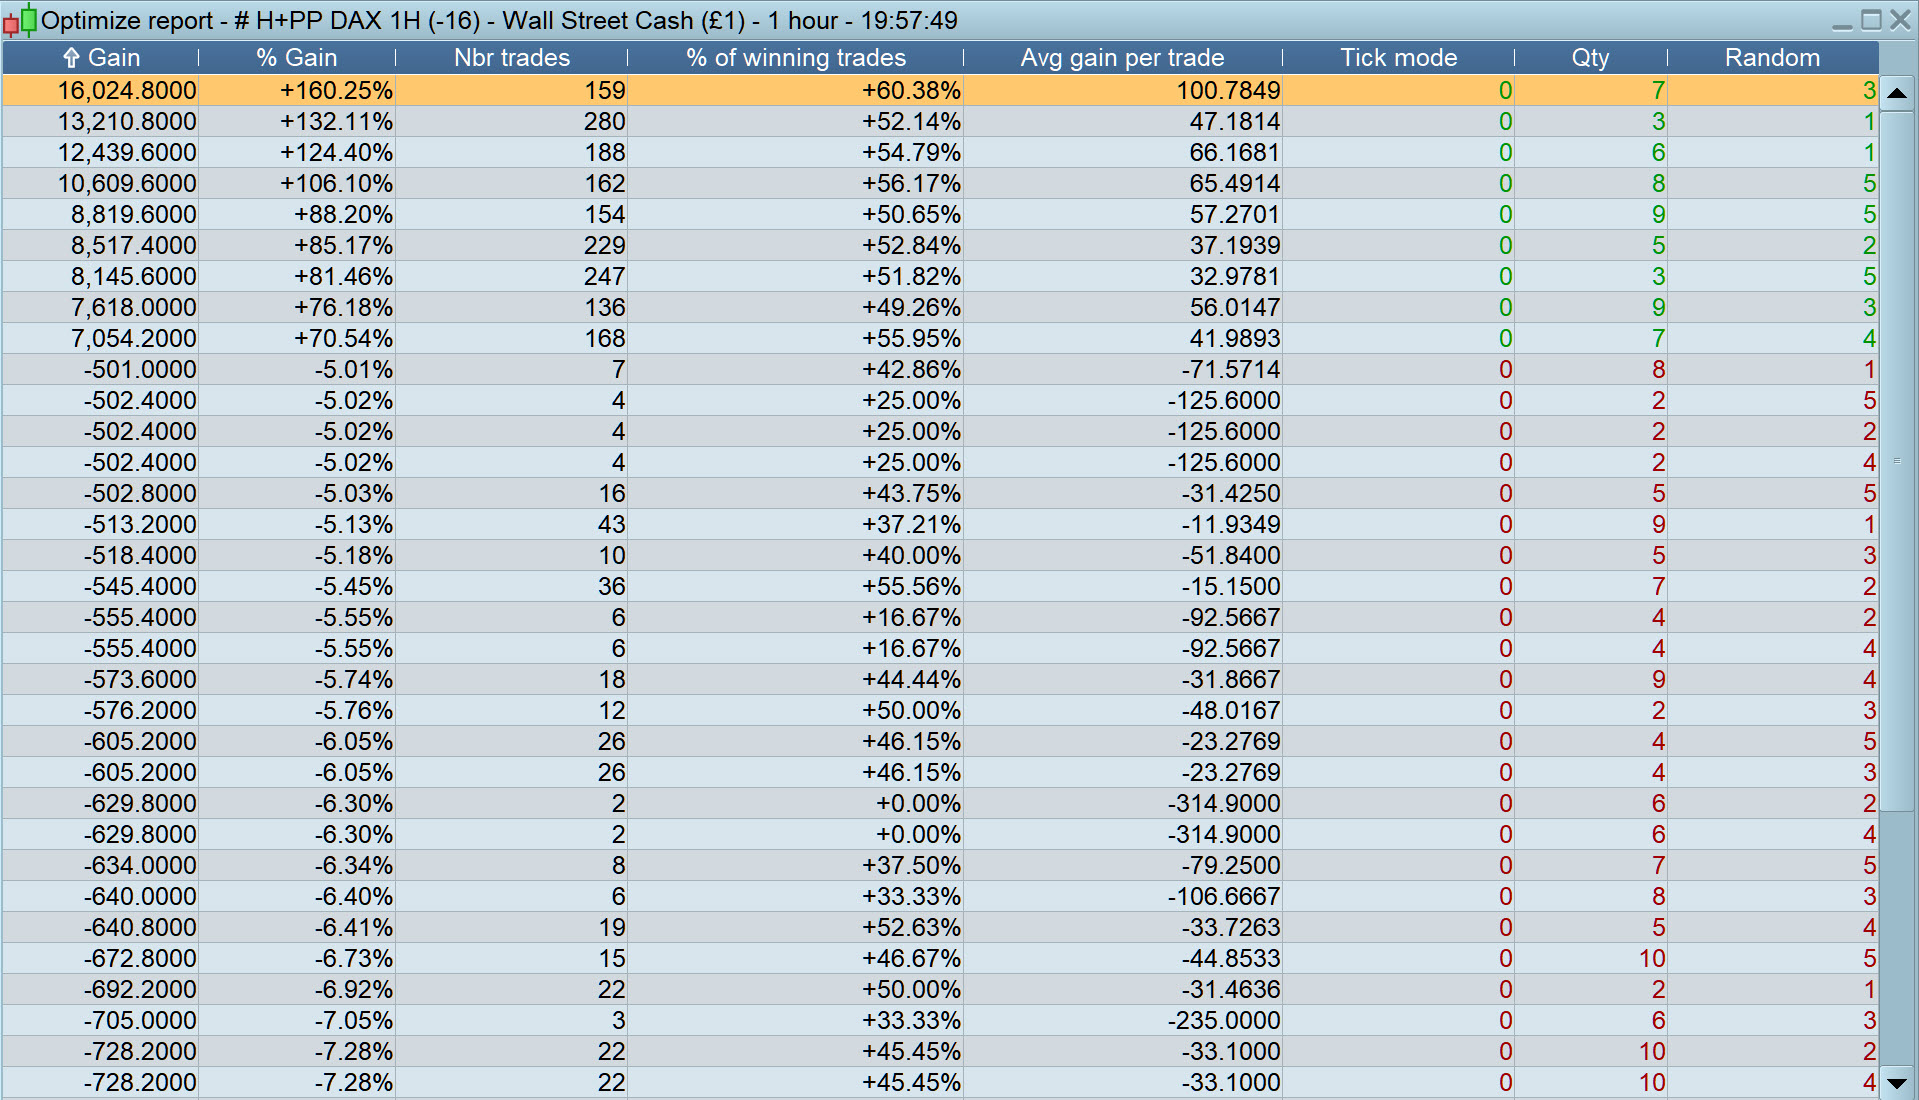
Vonasi I had a few thoughts … is there any point doing more than 100 combinations as when we sort by low to high then the best av per trade and % winning trades disappear below the fold (as they say) due to PRT Optimser results limited to 100 rows?
Not only is there no point, > 100 combos would give false results surely??
So whats the gig with this one??
Seems weird that the randomiser should result in loads of trades in 9 periods and markedly few trades in the other 36 periods??
hahaha solved it … I had a Quit if strategyprofit < 500.
Ill run it again with the Quit rem’d out! 🙂
is there any point doing more than 100 combinations
Probably not as 100 is already an awful lot of tests – far more than the one that we usually base our decision on!
GraHal – when I click on your link to access the Google sheet it says I need to request access. Could you unlock it for everybody?
Done … try it now (I thought I had unlocked it!).
Btw I agree with you … better / easier to have a separate sheet(s) for different Qty / Random ranges.