Is the error that the variables QTY and RANDOM are not declared? If so then as well as changing the TRADEON = 1 also remove the // from in front of the QTY and RANDOM setting lines.
hello, Robustness Tester is Great Btw….
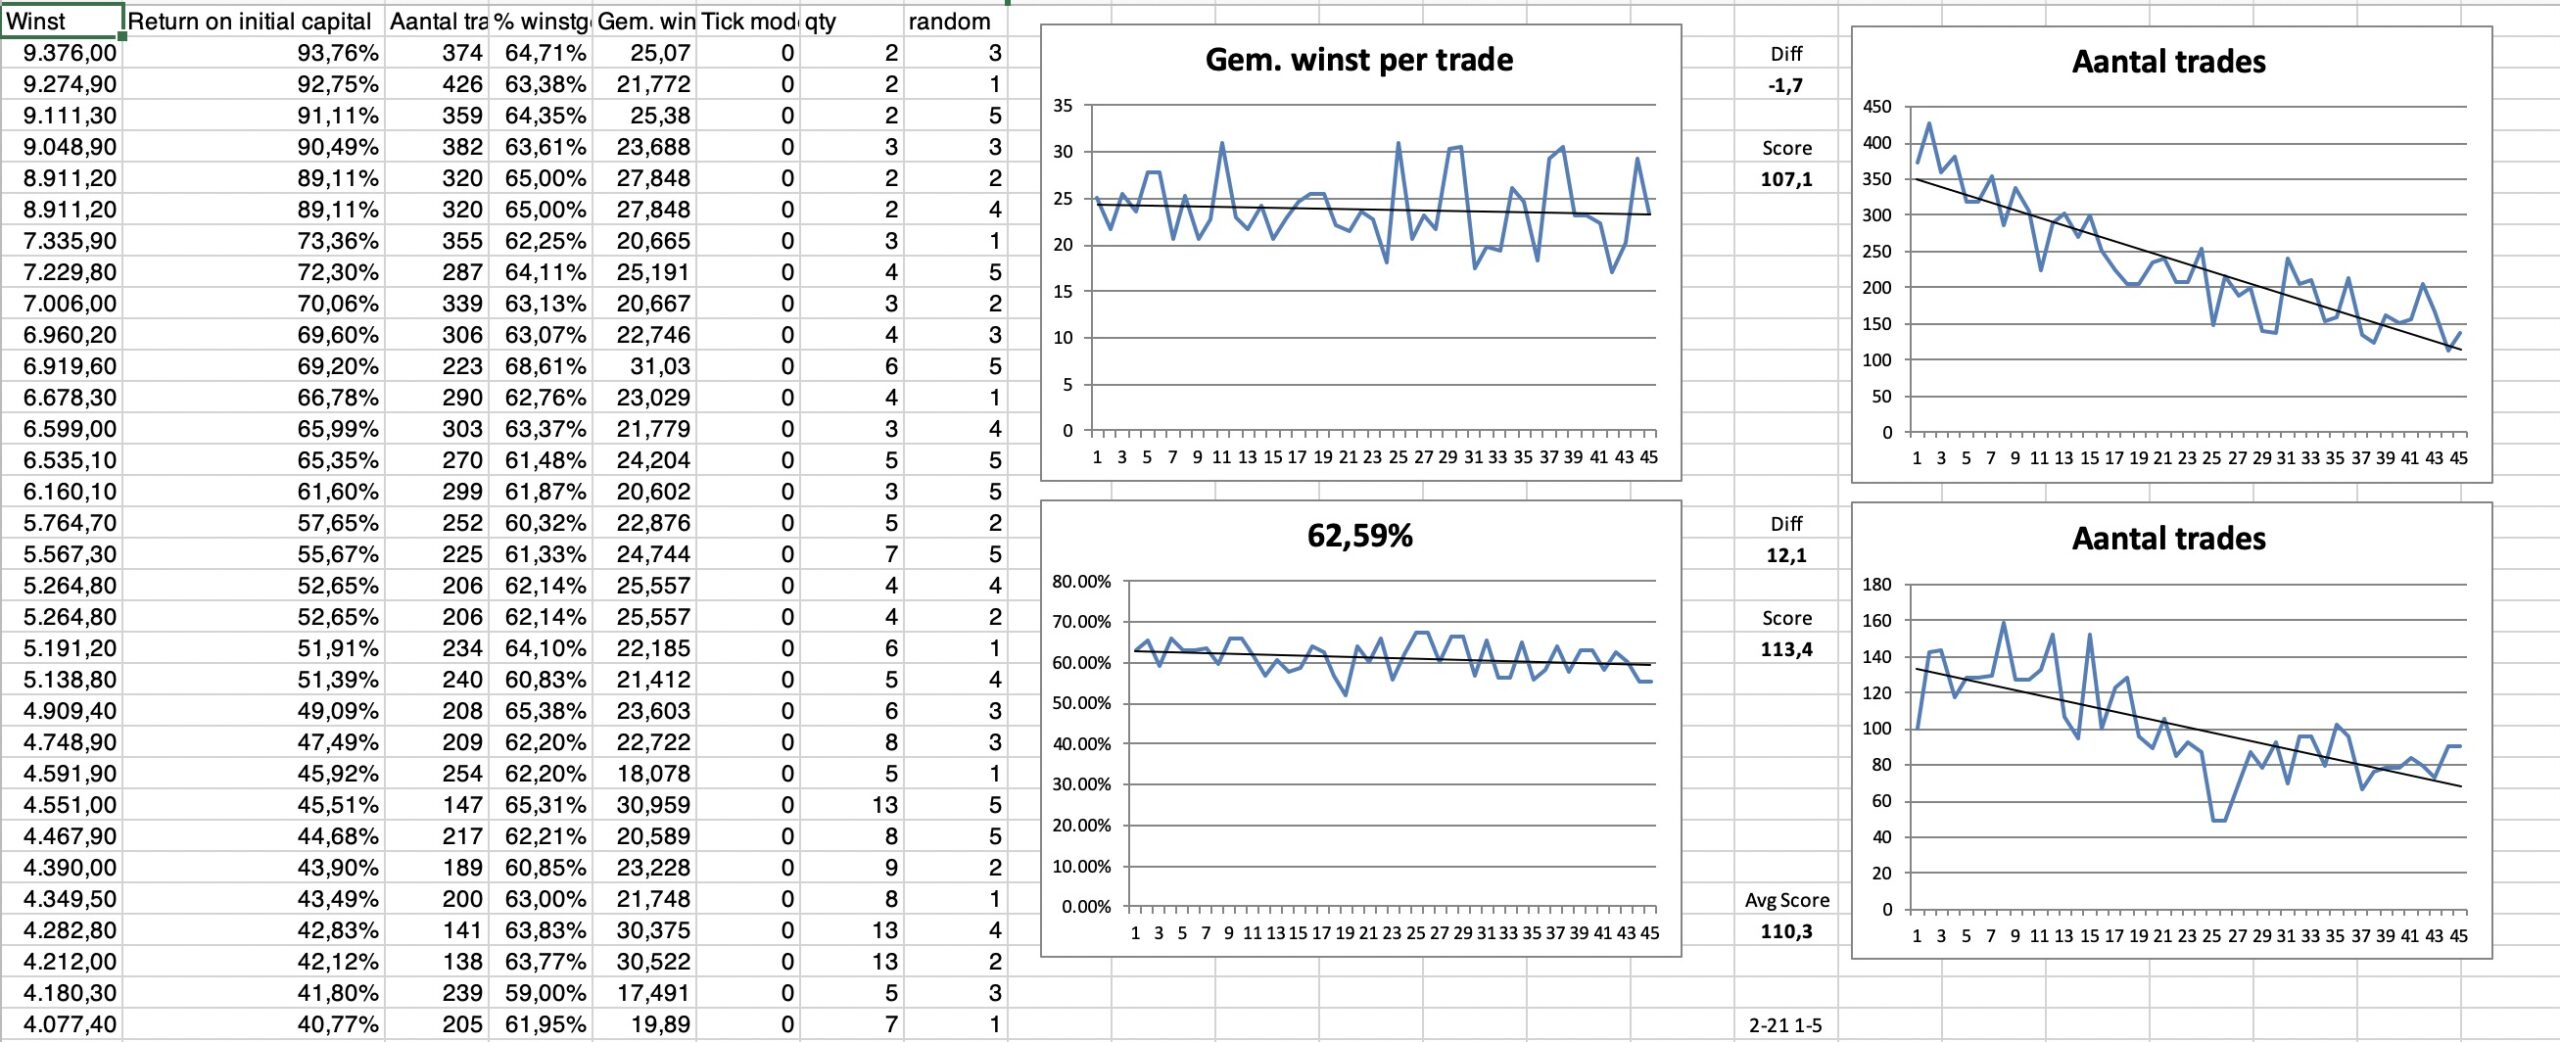
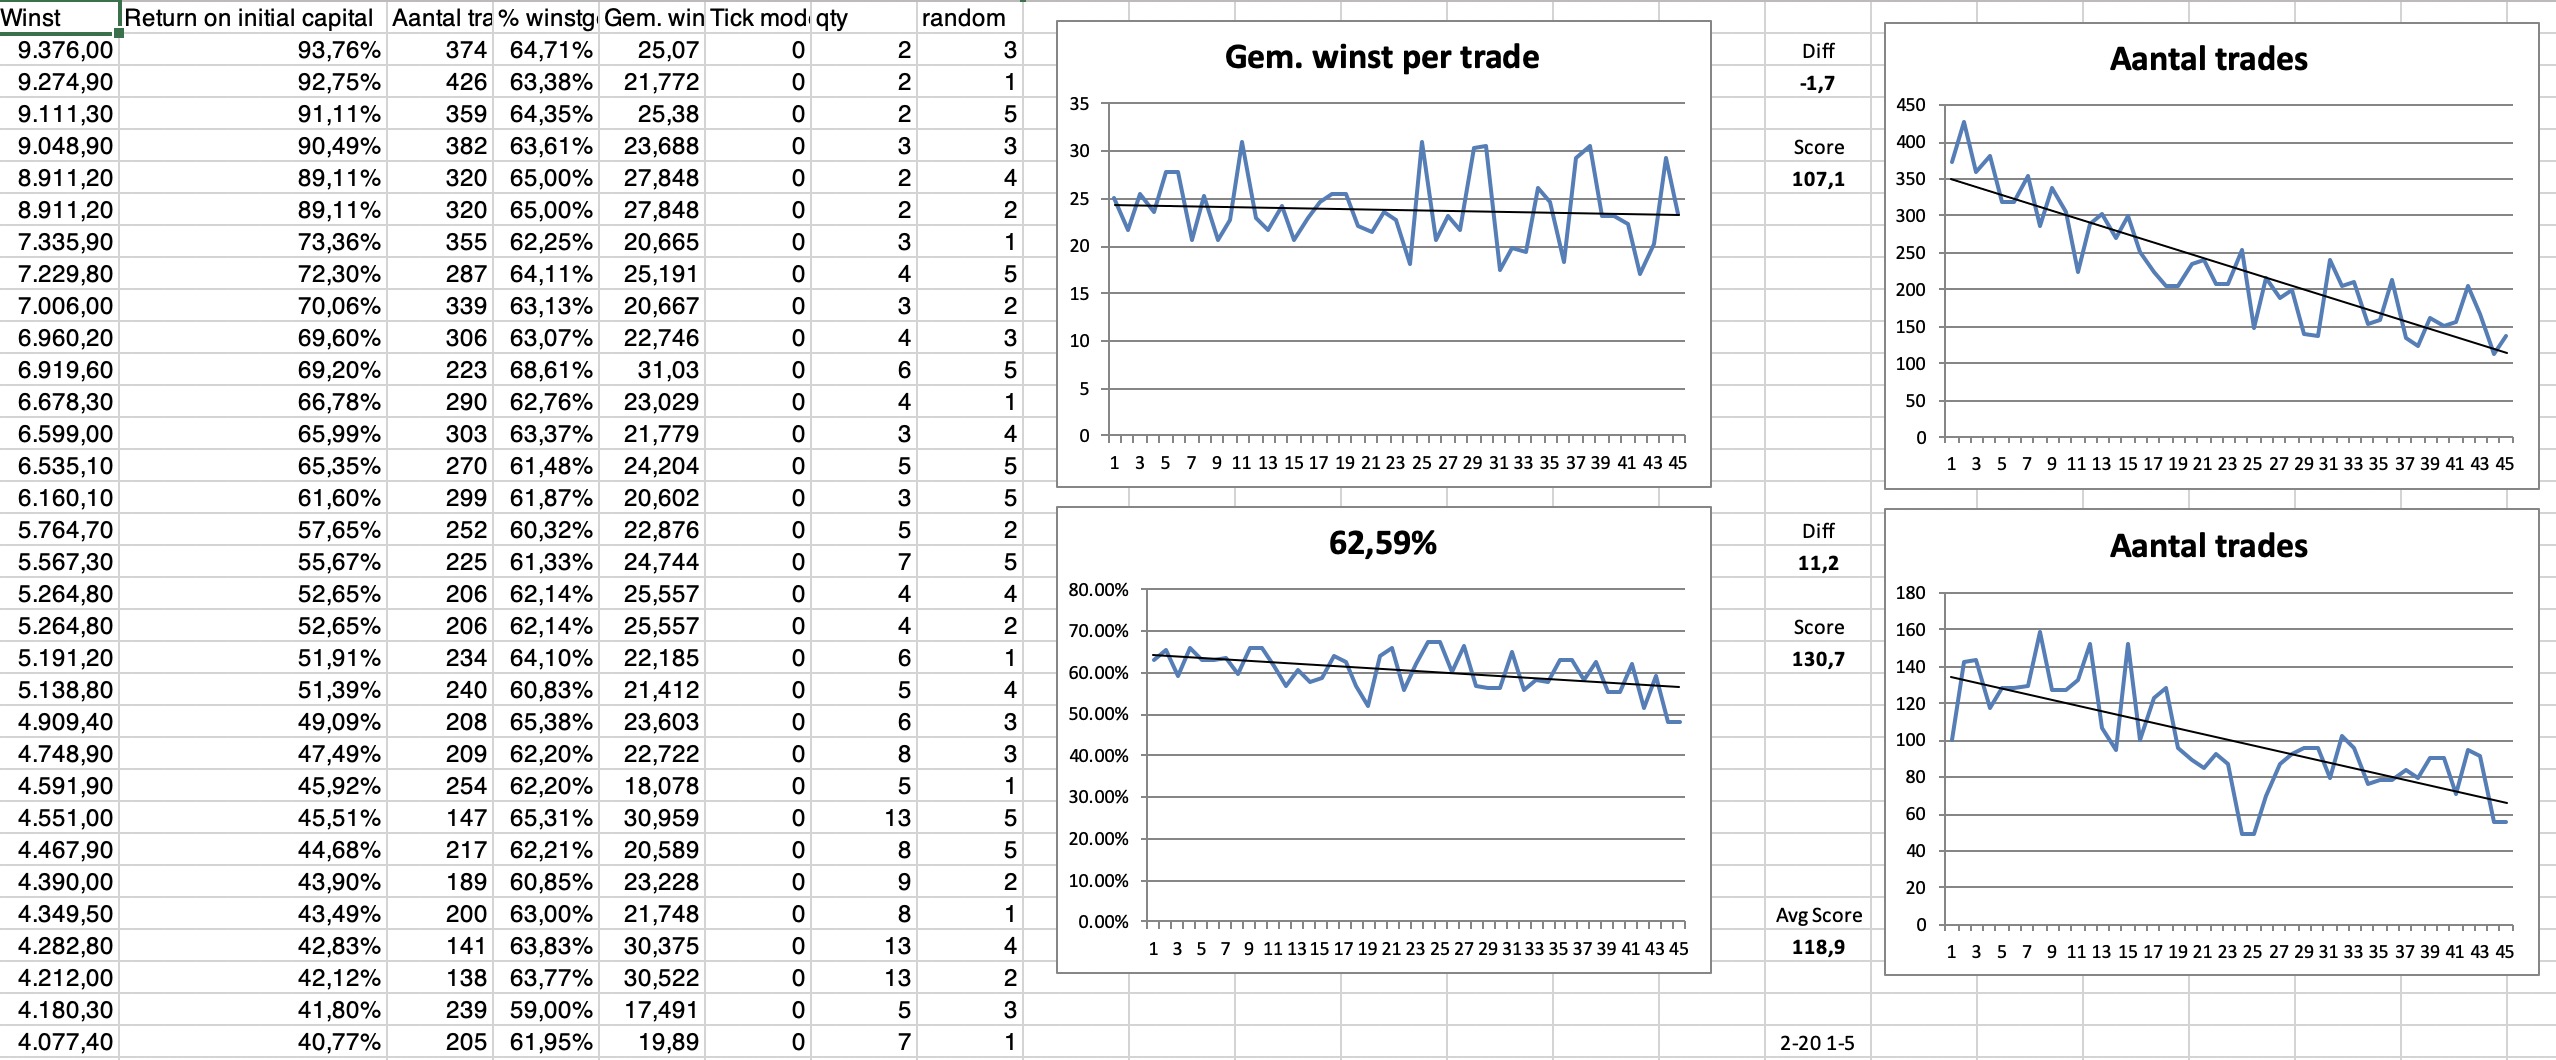
I have a excel file iv been working on for test comparison’s, shared below
can someone fine tune the graphs (graph angle of inclination would be a effective robustness indicator), ?
I have been trying to create a automatic recording system from Results sheet to Record, It seems it is only possible with macro’s ?
https://www.extendoffice.com/documents/excel/5216-excel-record-changing-values.html
any help advice appreciated
This post has so much info right now, i would love to try this out but im stuck and cannot get this to work!
I saw you posting a small guide with points on “how to…” on like page 1 or 2, can you post and updated one @Vonasi and include the whole updated strategy robustness code?
I think the guide that you are referring to is this one here:
Strategy Robustness Tester
I’m a little busy with another major (boat related) project at the moment so time to write guides and instructions is a little short – perhaps if you have any specific problems or issues I might be able to answer individual items more easily.
Tony87 – Sorry but I have only basic skills with Excel but I like your idea of automatically recording the results of tests. Yes I think macros is how you would do it but I would have to learn a whole new skill set to help with that one!
Calculating the angle of inclination should not be to difficult as I believe the calculation is fairly simple – perhaps someone better experienced with Excel could help with both of these?
It seems it is only possible with macro’s ?
The VBA code (to auto-record a cell change) is provided on the link in your post so all you need do is add that VBA code (in the correct way) in a macro code window and you would have the macro you want.
Instructions for adding the provided VBA code (to make the macro) are there also on the link you provided.
I’m sure you want to do it then you will be chuffed / very pleased with yourself and will have a new skill for life!? 🙂
 Paul
PaulParticipant
Master
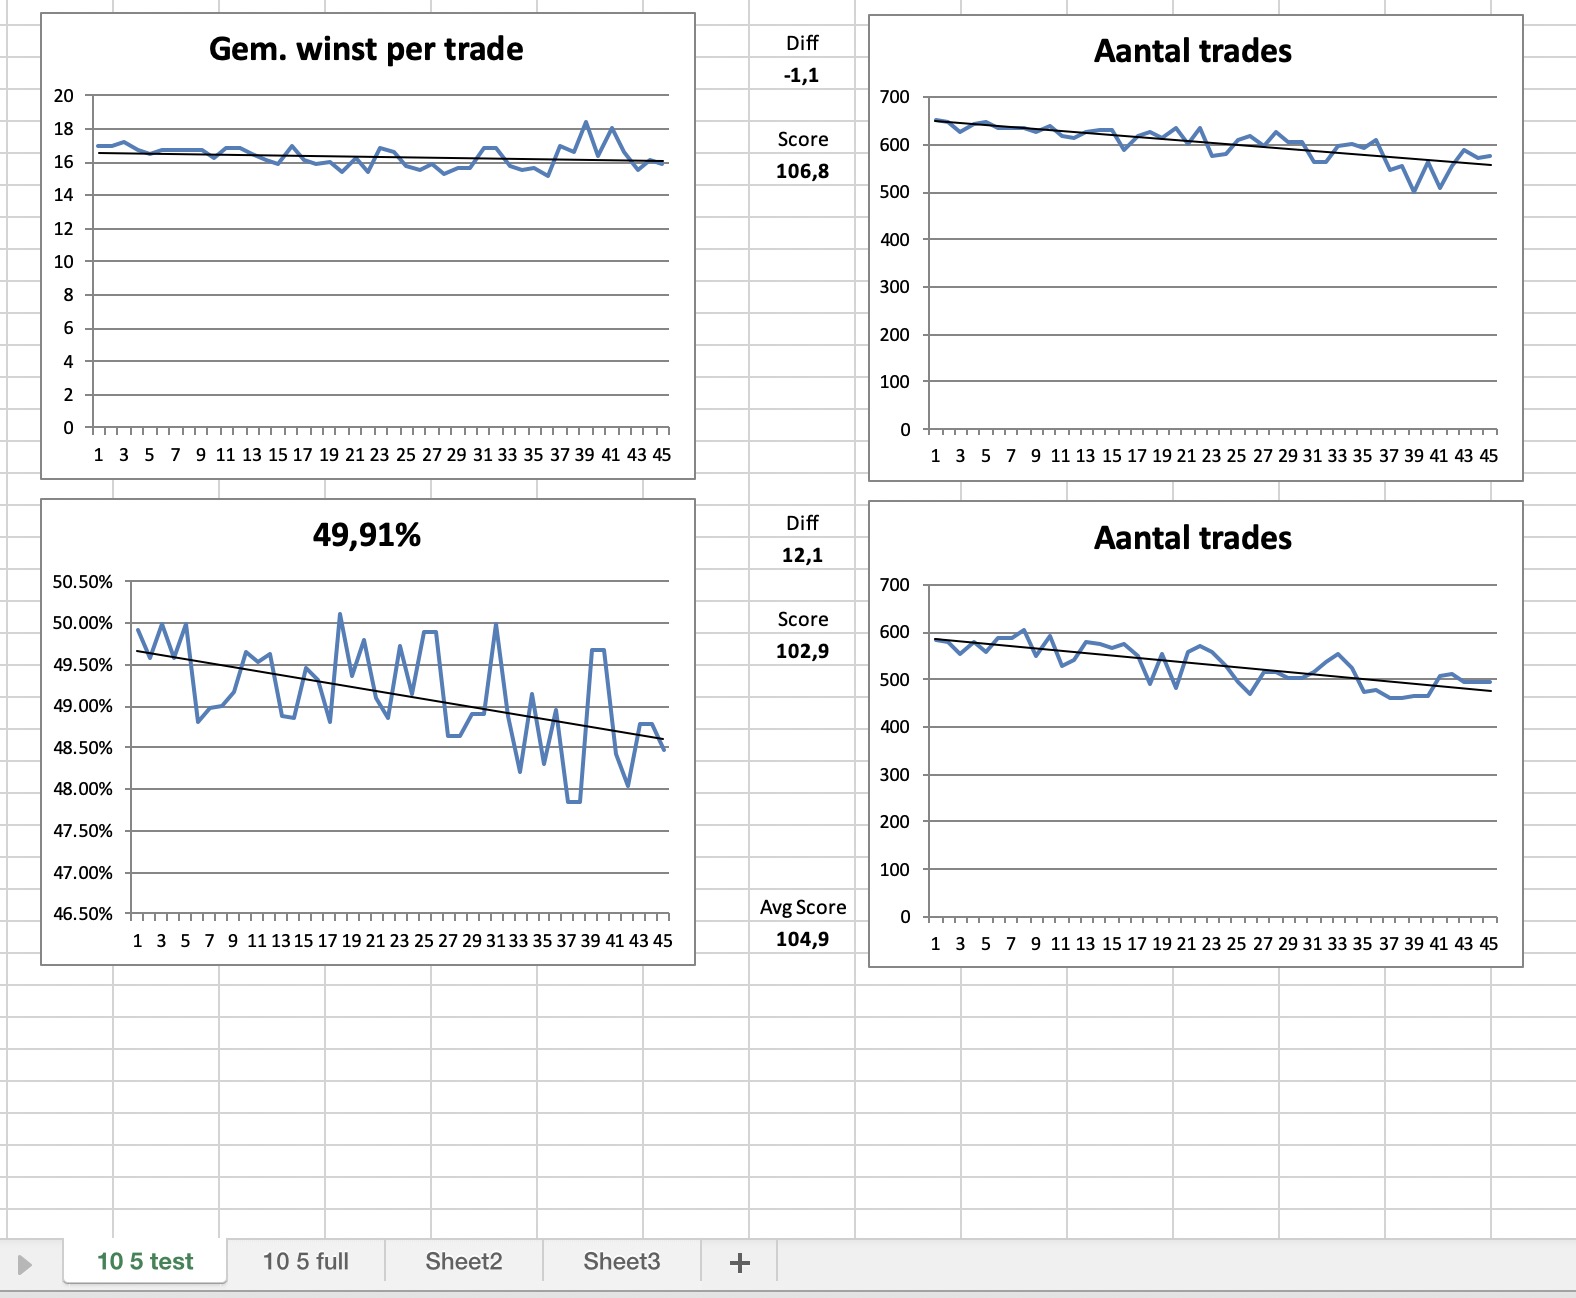
@Vonasi I use tradeon as your example on fifi’s v6 for entry, but not for re-entry, is that correct?
parameters are qty 2-20 & random 1-5, no other optimisation parameters
test; fixed settings and no exit criteria, not even a stoploss
PaulParticipant
Master
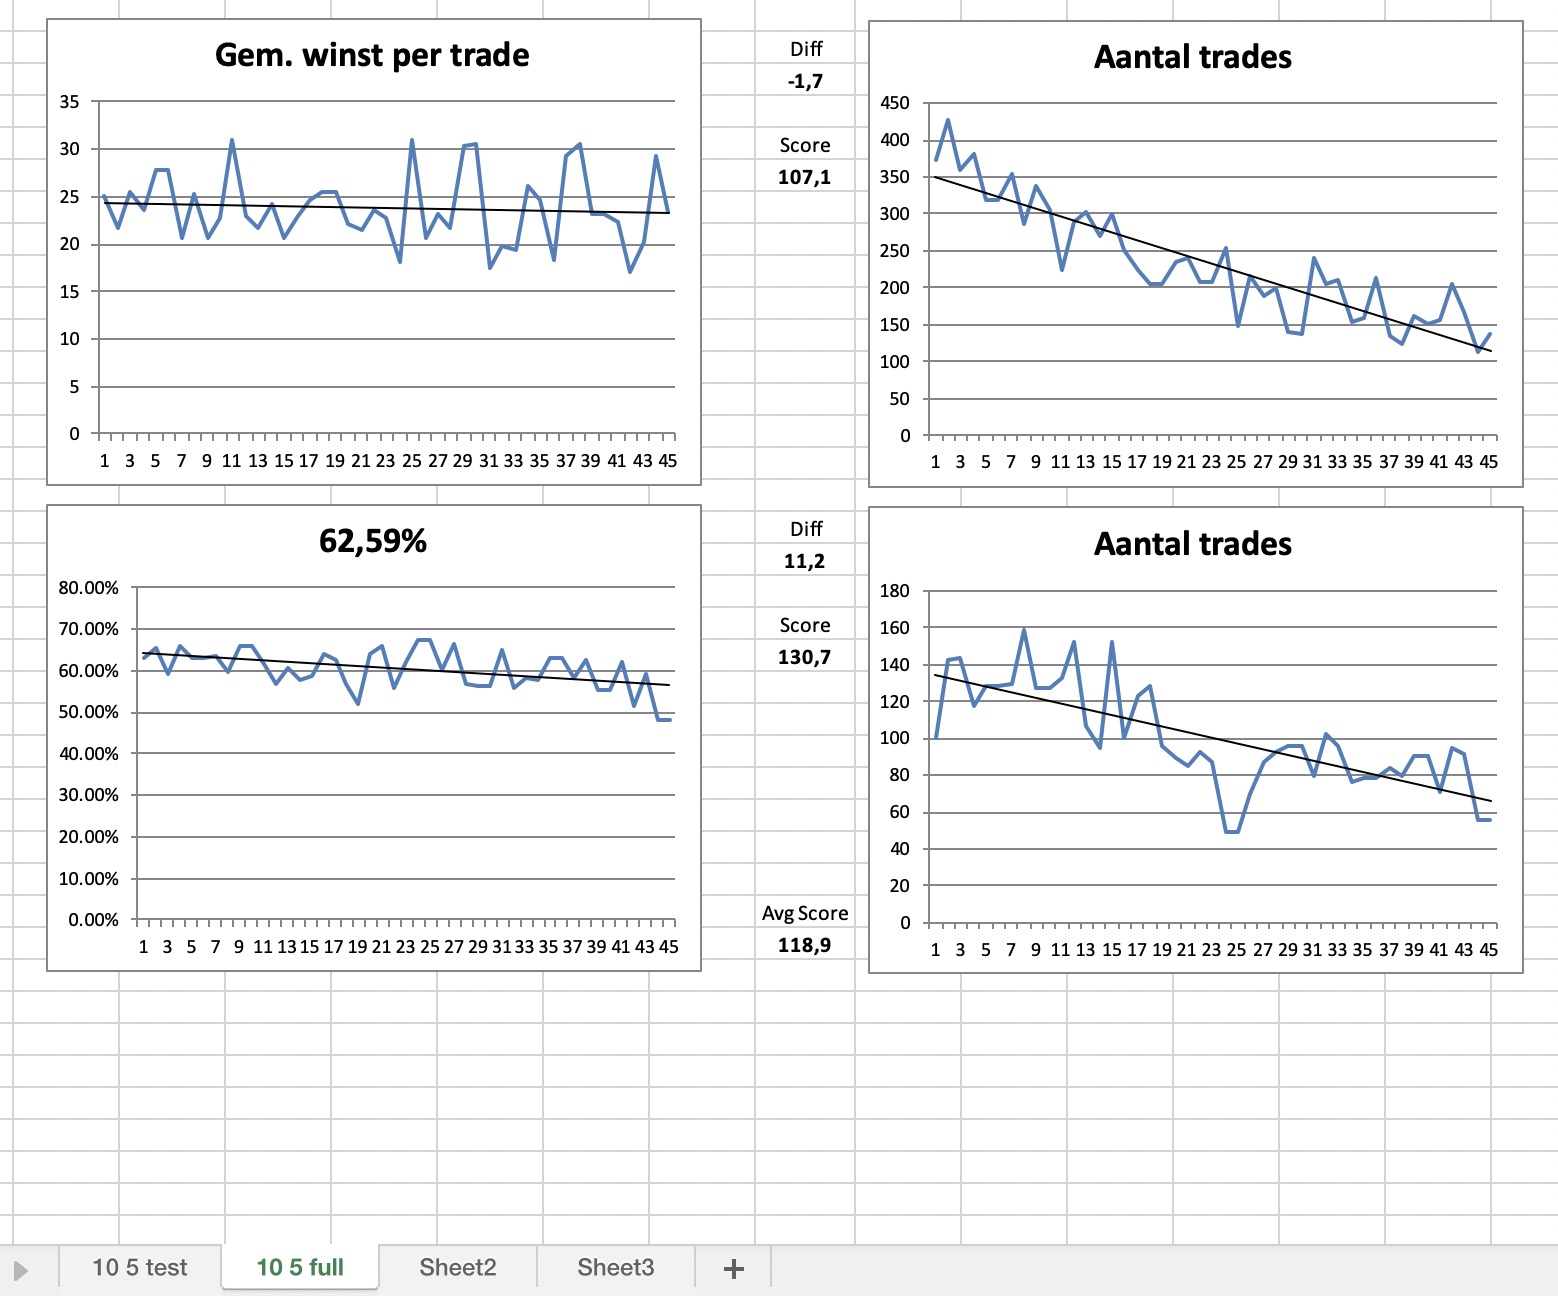
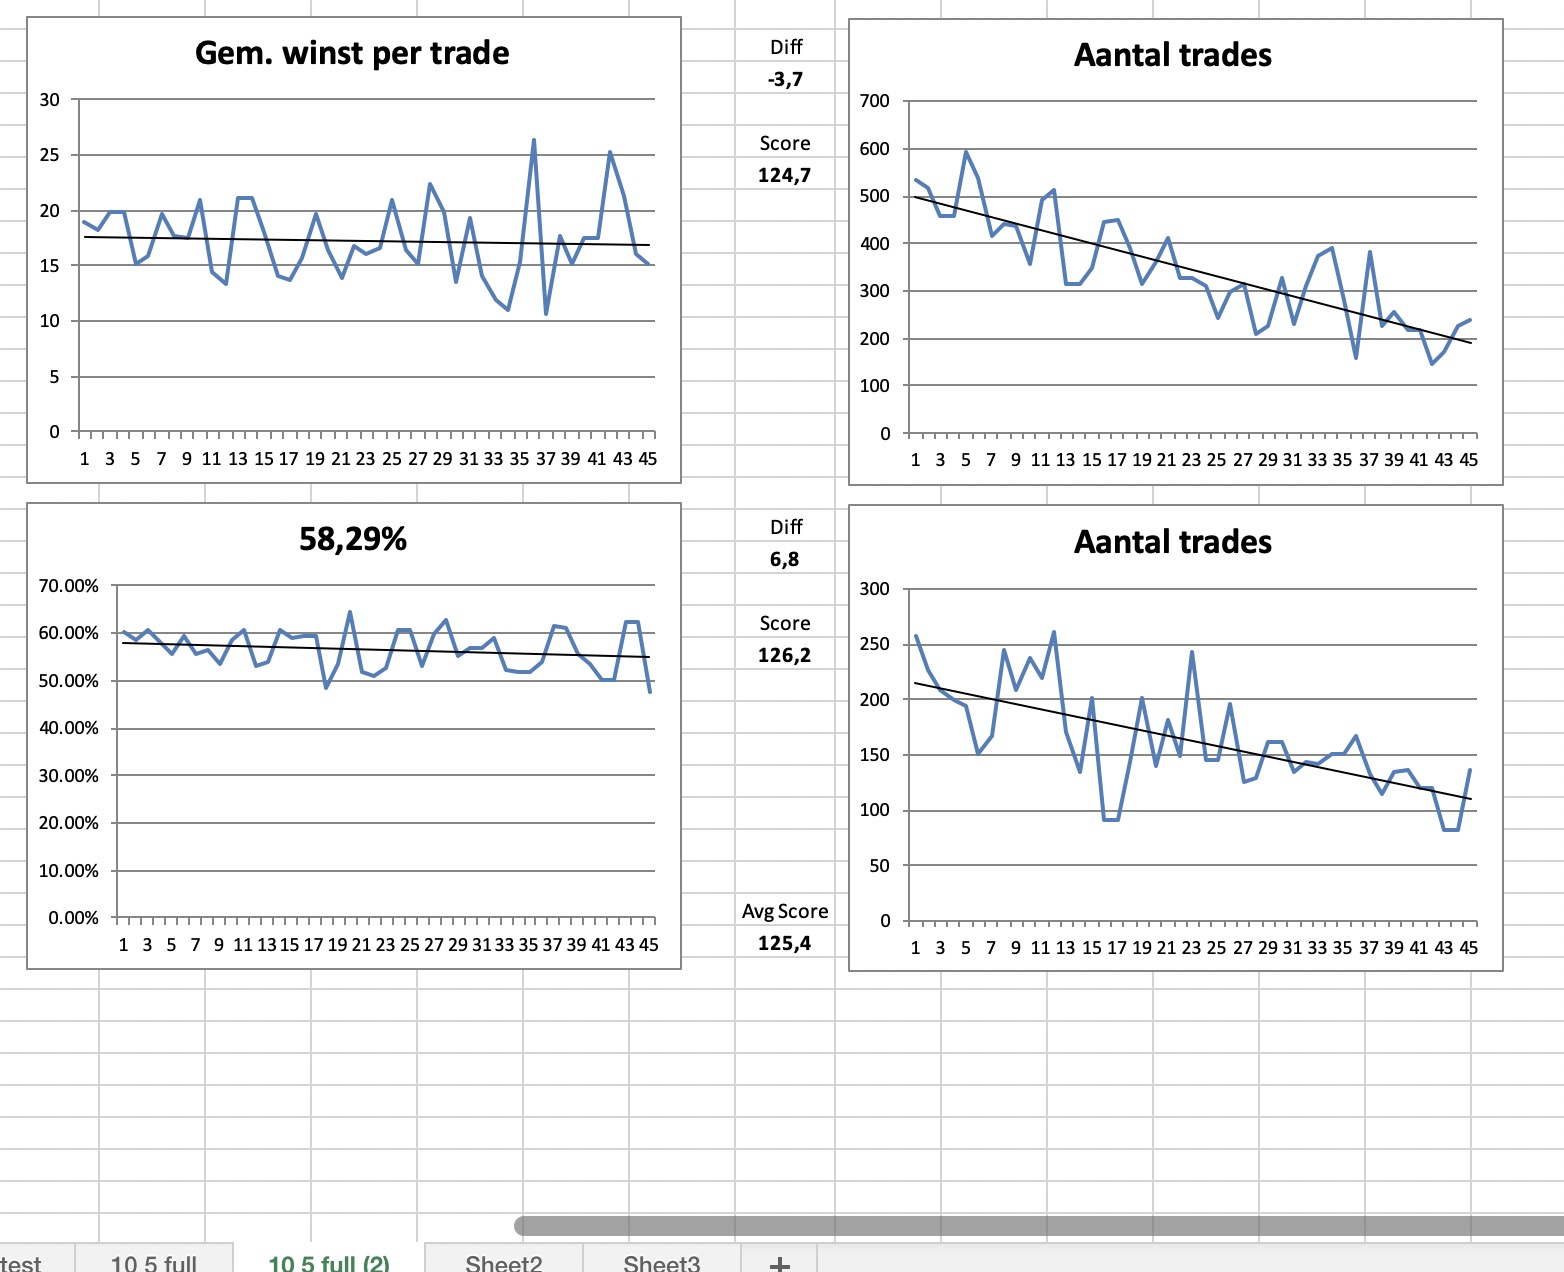
and other full strategy2
full strategies have same sl 2% , pt , ts etc. and both are based on the same concept from the test.
one setup parameter difference between them.
The concept looks stable, but still have to explore what all means exactly.
I posted Fifi’s code with the robustness tester added here:
Strategy Robustness Tester
When adding TradeOn condition we must ensure that it is only placed where new trades can be started when not on the market. If a strategy adds to a position or reverses a position then we must allow it to do this. Some codes can be more difficult to add the robustness tester to than others. I discussed an example here:
Strategy Robustness Tester
We should also always test with level stakes to get meaningful results.
As for Fifi’s code I seem to recall it tested well but it is so curve fitted with so many conditions that it will always test well! It is a bit like writing a strategy that already knows which red candle was always followed by a green candle and then writing a code that just ignores candles on dates in the past when that did not happen. The back test will always be fantastic and it does not matter which trades you randomly test they will always be good ones because it is data mining curve fit!
We must always remember what the point of the robustness tester is – it is a way of randomising the data we are testing on. If we only allow trades to start every fifth bar then we have the potential to create trades that we would never have seen if we started trading on bar 1 and it opened a trade and held it open till bar 6. The trade that could open on bar 5 would be missed in our original backtest and it could be a case that bar 5 is a losing trade, bar 10 is a losing trade, bar 15 is a losing trade etc and we did not see them and think we have a great strategy just because trades starting on bar 1 and bar 6 and bar 11 were all winning trades. The robustness tester lets us see that a strategy that we thought won 100% of the time and makes a small profit actually only wins 50% of the time and makes a loss when you add the two tests together. It also lets us see whether our very low draw down is just because we got lucky and opened trades at just the right time in our backtest whereas if we’d opened the trades one bar later our account could have been wiped out by a massive draw down.
PaulParticipant
Master
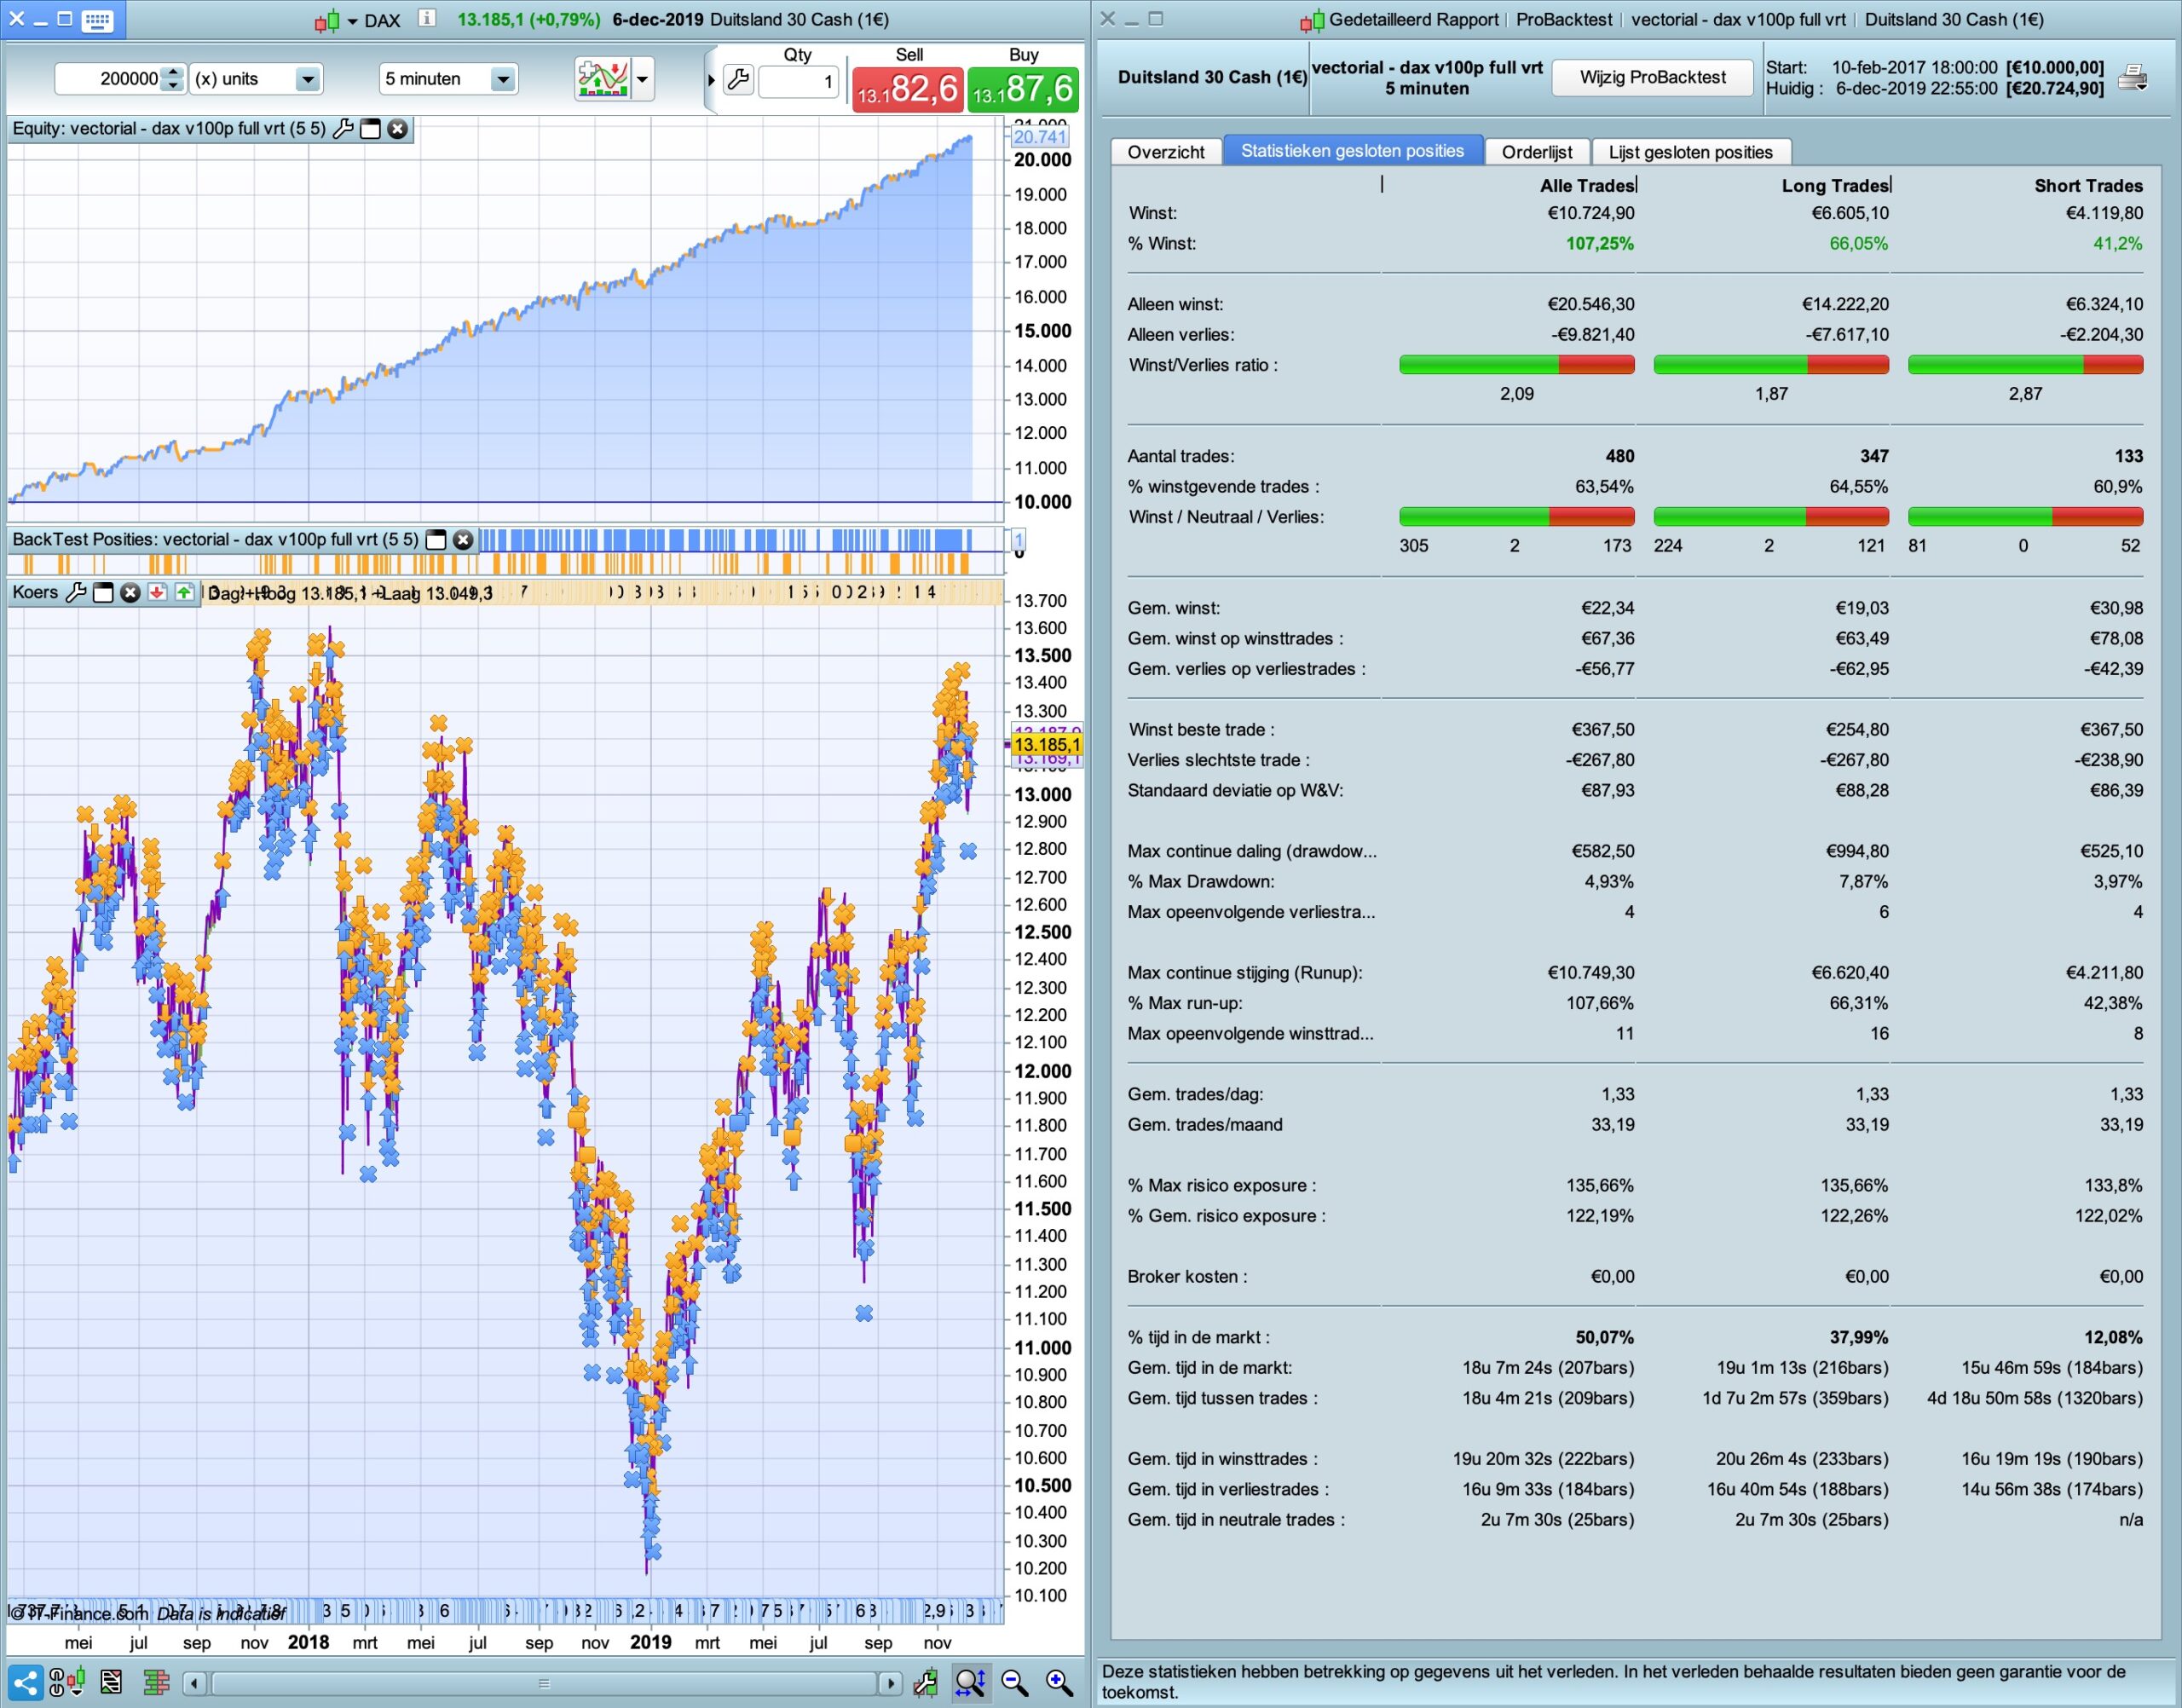
I’ve run it again and it takes about 5 to 6 minutes for the complete strategy 200k bars. It uses market orders and there are no restrictions on a new signal in the same/opposite direction. It just closes & (re)-enters. So it’s not curve-fitted I believe as I had before (5.0p). Also they way your robust tester is implemented is fairly surely correct with the example of fifi’s.
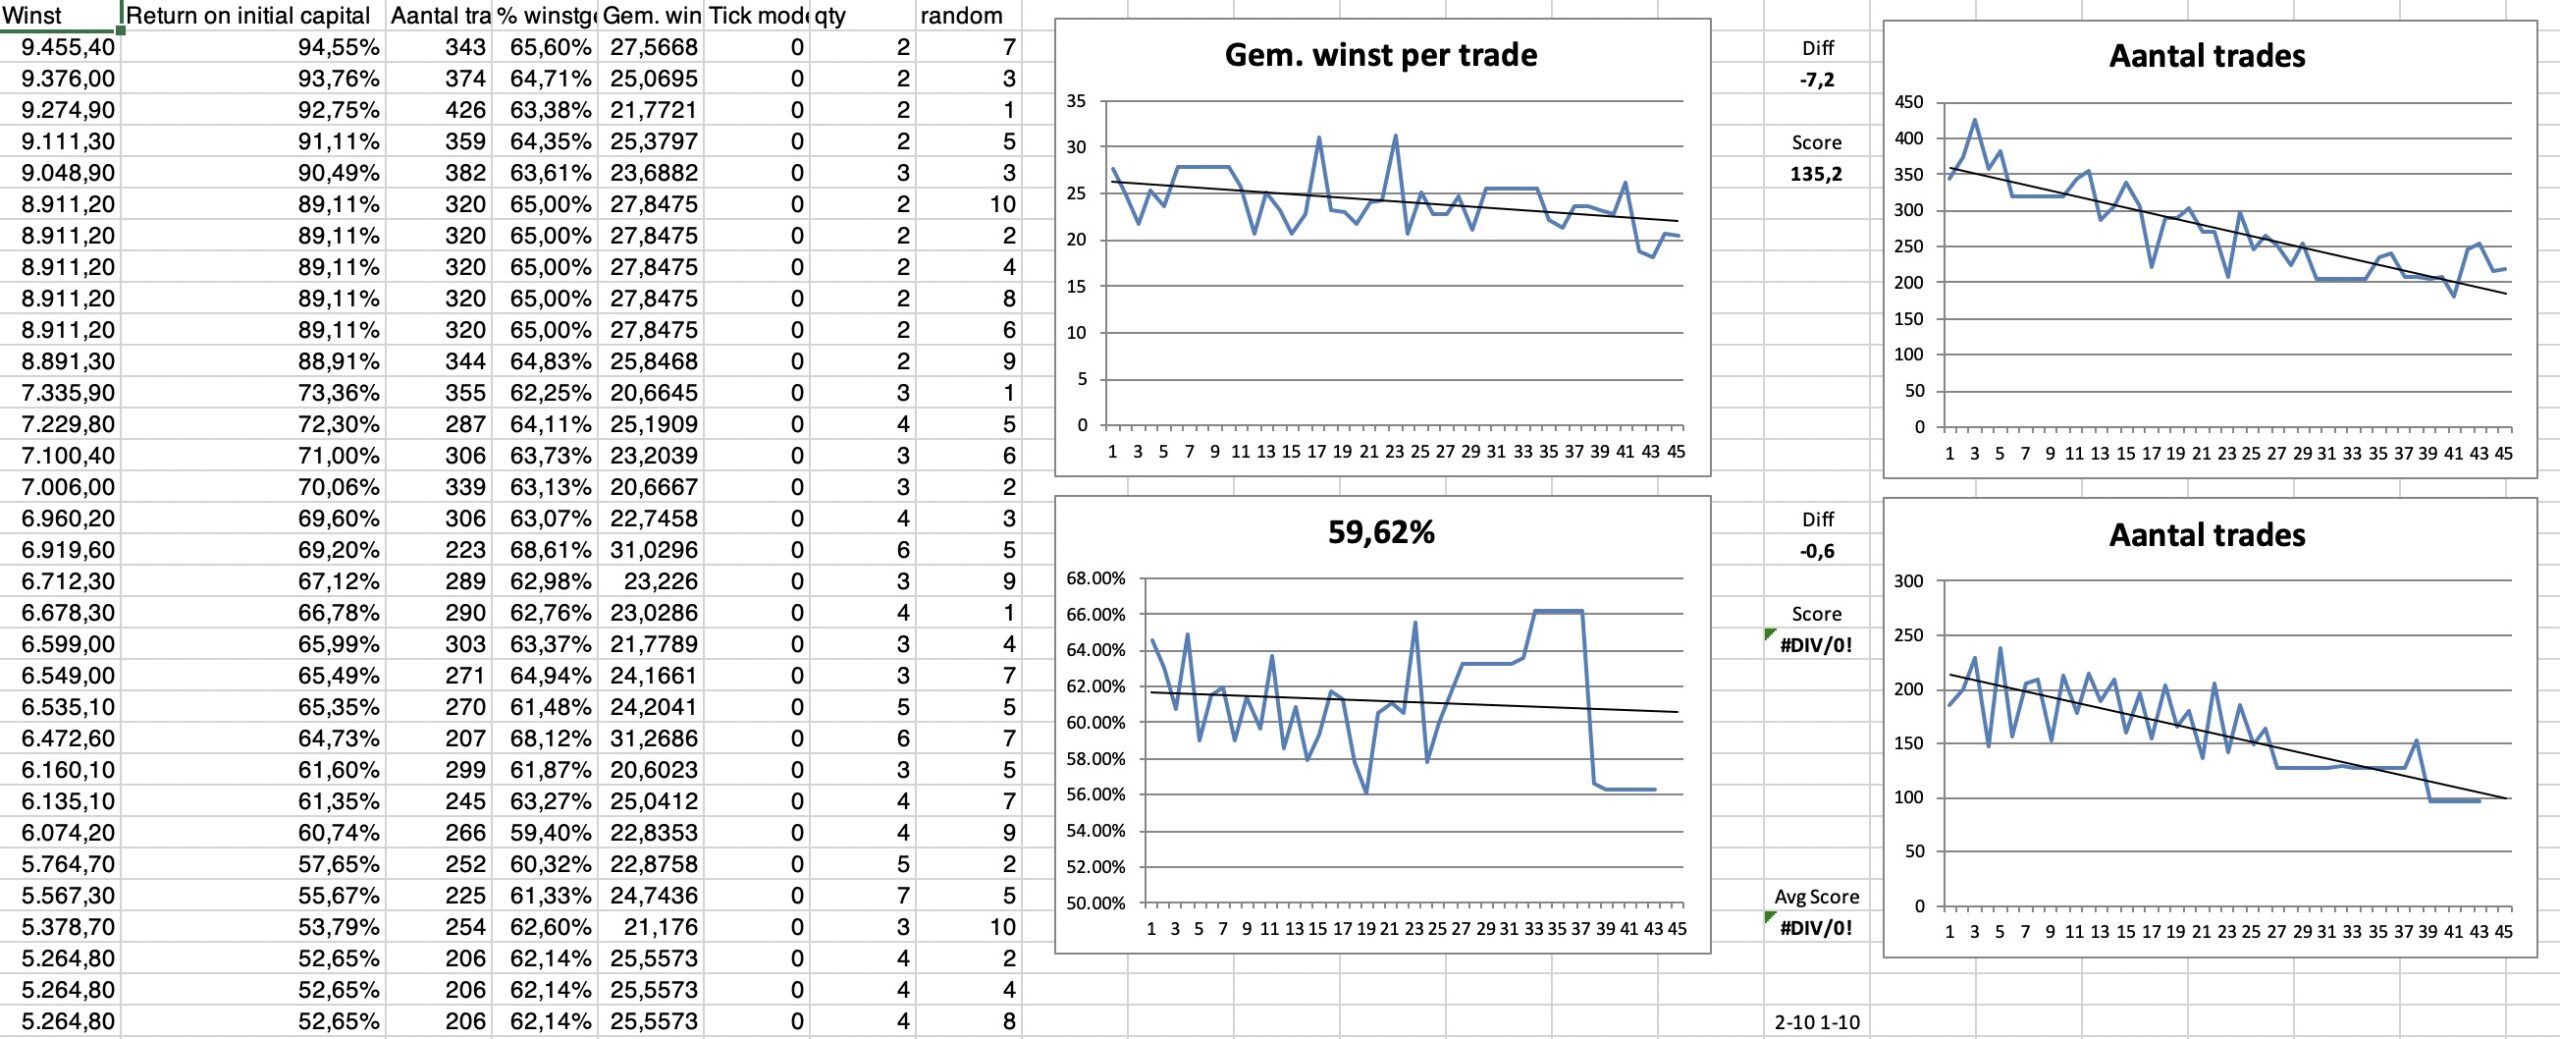
There’s a div/0 error in the 2-10 1-10 sheet, because the last filled row is 91 and it points to row 93.
What to make of the score? Compared to your best it’s higher, but what does that mean when the win% chance & average gain here is lower?
Paul – You haven’t organised your results from low to high in the optimised results window before dragging into Excel. You have to do this to get the correct charts and correct score calculations.
Also I’m not sure that you have the correct Excel locations being used in the calculations as one of your chart titles is showing a % instead of the correct title for that chart – a sure sign that something is wrong!
PaulParticipant
Master
Thnx for spotting the problem.
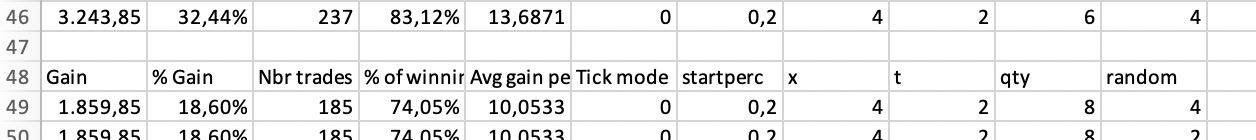
The excel file is split at row 48, for the part of the 2nd sorted optimisation window to drag to.
I have 100 rows, I could split it myself or just create more rows which will probably work. But do you have a xls file which is suitable for 100 optimisations?
Also the online version of GraHal goes to 46 rows.
Yes as I said in a previous post we need to set up different Excel pages for different RANDOM and QTY settings as they produce different quantities of results. I’m no Excel expert but perhaps someone better with Excel knows a way to automate it all a little better but until then just having separate pages in the workbook for different amounts of test results is my workaround.
You need to change the chart data settings and calculations to create each new page in the workbook. The calculations just need to know the first and last (highest and lowest) values to do the calculation as described in this post:
Strategy Robustness Tester