i’m glad that the have you tried switching it off and then switching it back on again?’ worked. You may not have liked the next suggestion which would have involved a hammer and a few sharp blows.
What is a good result? Well one where the strategy does not fall apart just because you open trades randomly is a good starting point. As for particular scores – well that is down to each individual and the more strategies you test the more idea you will get as to what to expect. The simple answer is that a completely level line is the absolute ideal result but you will never achieve this so you will personally have to decide how far from this perfect line you are willing to accept.
My robustness test is not superior nor inferior to WF analysis – both should be used to try to gauge how robust a strategy is. In fact the perfect combination is to develop a strategy on an in sample section of data and then carry out a robustness test on a section of out of sample data. If all tests are profitable and you would have been happy to have traded every equity curve in the test then that is a very good indication that the strategy could be a good one.
 Paul
PaulParticipant
Master
a new test to have more comparison data;
Info about strategy; re-entry on same signal in same direction (close&re-enter), reversal on signal, stoploss 2%, trailingstop, spread 1. DAX 5 minutes 200k bars.
pics strategy without tradeon & last pic with robustness test results.
Hello Vonasi, coming from GoldMiner topic i found out about this tester.
I’m about to integrate this to all my strategy and i have just one question: what kind of tester is the more complete of the ones you posted? The RANDOM version?
Thanks and congrats for your work!
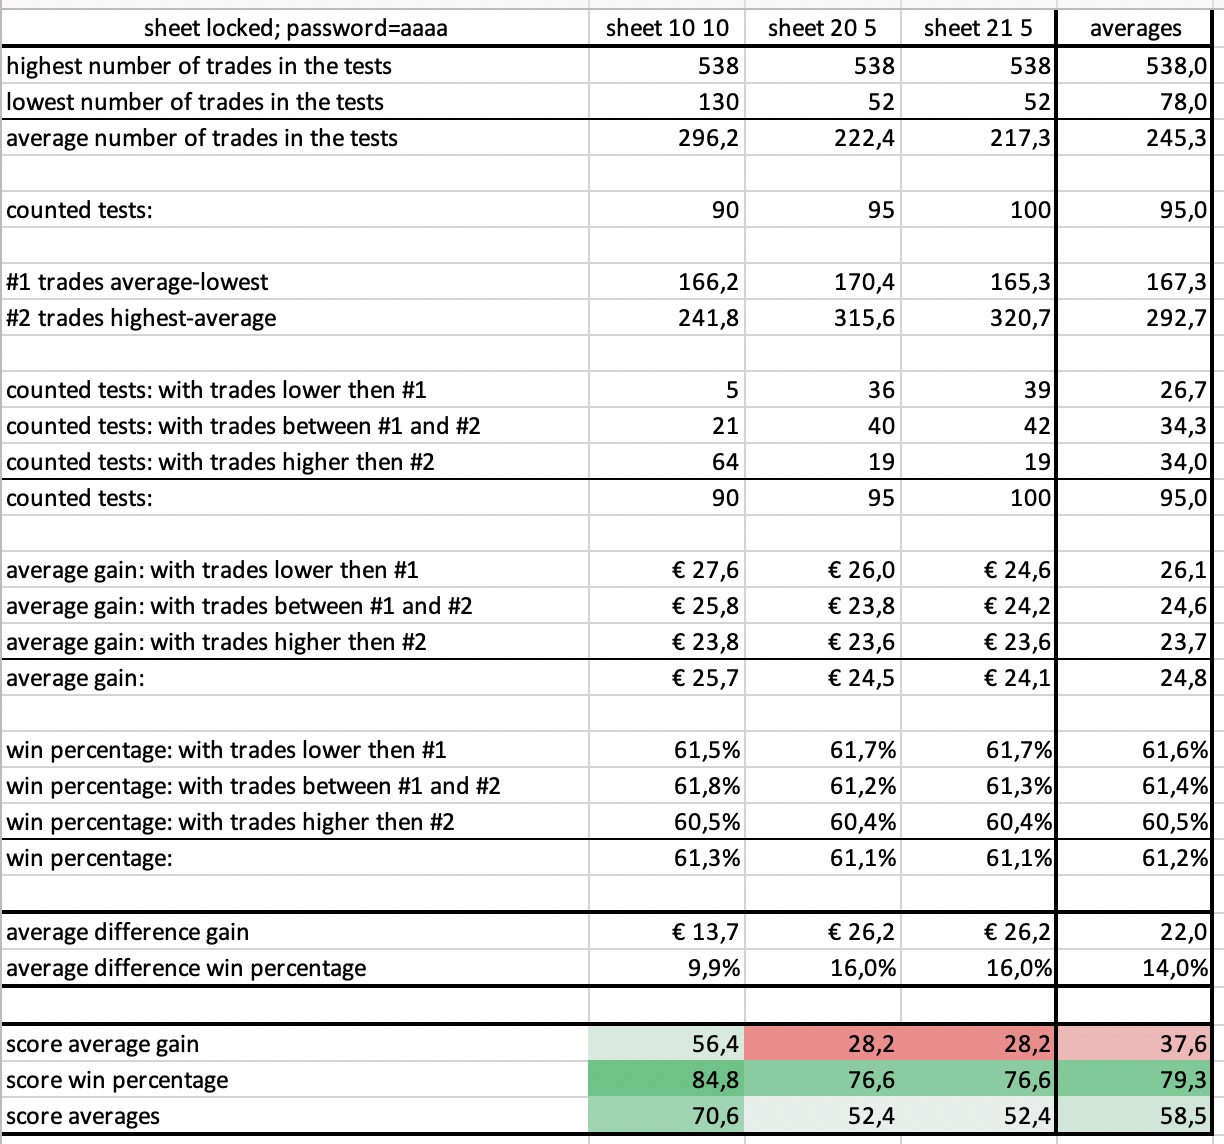
Another question, once i’ve got the averages between 10 10 20 5 and 21 5, what is the minimum acceptable value for the total average?
Then, after the robustness test, i have to pick the best choice of qty and random for the strategy or i have to disable the tradeon and run the strategy as before the test?
Thank you.
I think the random one does a good robustness test but any robustness test is better than no test at all! It also has the benefit of lots of different varied test sequences and that Excel and Google sheets have already been created so that we can loo at the results in way that helps with the analysis of them.
I think you misunderstand how it works. You must have a finished strategy with any variables fixed to what you would run the strategy live with. It is not an optimisation tool but a tool to test a finished strategy. All the results are results that you could potentially get just by letting the strategy trade in ‘random’ sequences.
I understood how it worked, that was just a very silly question caught up in discovering the tool for the first time 😀
And for the minimum acceptable value for the total average? 50+ would be good?
And for the minimum acceptable value for the total average? 50+ would be good?
This has been asked before further back in the topic. Everyone has to judge their own personal levels that they are happy to call robust.
I had 23 systems that i tought were amazing judging by the backtests positives on all years on 200k… then after robustness test only 7 of them were over an average of 50 (that i believe is acceptable combined with excellent results on 200k)
This makes me think about the power of this tool that can optimize the portfolios into only real valid strategies.
Congratulations again for your hard work 🙂
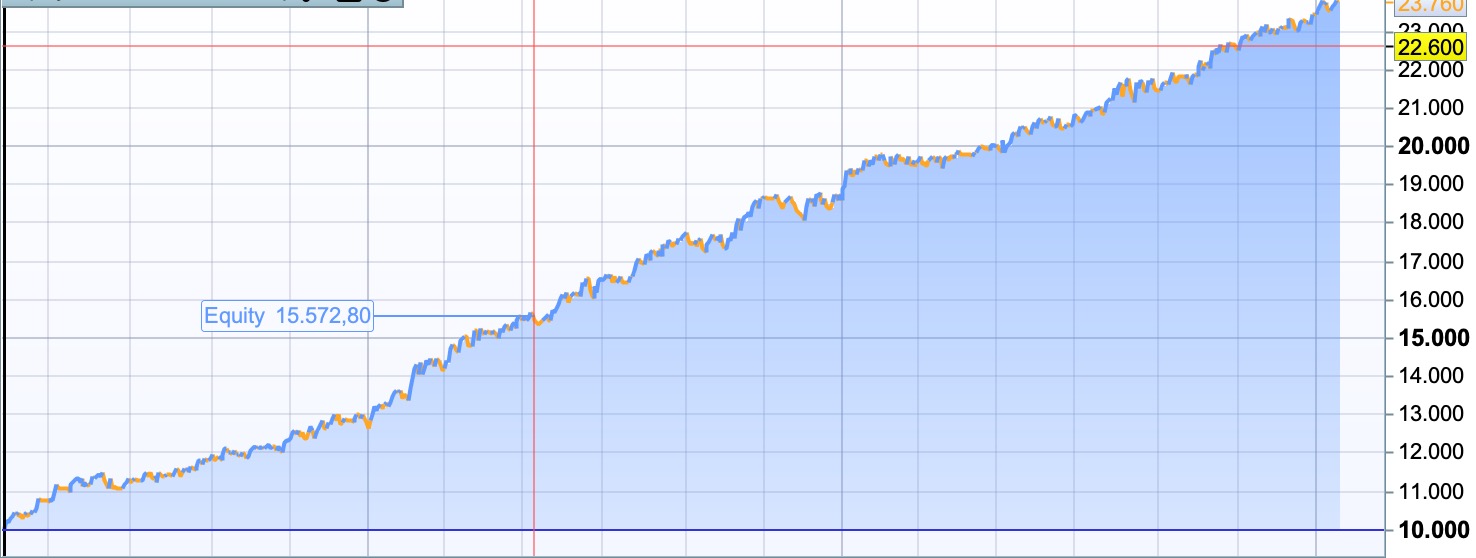
Yes it is very easy to create a strategy that has a lovely equity curve but while it has an open position you have no idea what trades you are missing and they could all be losers but you just lucked out and started your back test on the right candle. If we shake things up a bit and trade a bit randomly then we get to see all the trades that we curve fitted out by starting on a certain candle.
Keeping a record of all the scores of all your tests is a good idea and as you say you can then cherry pick the most robust and have the best chance of them working in the future. Do bear in mind that we are robustness testing on exactly the same data that we developed our strategy on which is not ideal. An even better way to test is to break our data into in sample and out of sample and develop the strategy on the IS and then robustness test it on the IS and then do the same on the OOS and compare. A strategy that performs as well on the OOS and passes a robustness test on the OOS has a very strong chance of working in the future.
Hi, would love to use this but i cant get it to work 🙁
First of all, im attempting GraHal’s ITF file containing this code:
//Robustness Tester - Random
//By Vonasi
//20190909

StartDate = 0
Qty = QTY //10
Random = Random // 3

once j = 0
once flag = 1

if flag = 1 then
j = j + 1
if j > qty then
flag = -1
j = j - 1
endif
endif

if flag = -1 then
j = j - 1
if j = 0 then
j = j + random
flag = 1
endif
endif

tradeon = 0
if opendate >= startdate then
if barindex mod qty = 0 or barindex mod qty = j then
tradeon = 1
endif
endif
Is this the right one? I just add this and where i buy i add “and tradeon” and i set variables qty 2-20 and random 1-10?
In the excel file i cant understand 3 things:
- Why is there an X and T optimized here?
- Why is the excel file only for 45 rows?? Arnt you supposed to do 100?
- When i copy paste/drag results to excel i get all sorts of wrong formats? Like “% of winners” just says #FIELD! and a bunch of my avg gain just turns into dates. How are you guys using this so easy? I dont understand how to use it even by reading Vonasi’s guide for dummies lol. guess im special huh
Please help, i wanna try this..
So i found the link for grahals spreadsheet and this worked much better than vbonasis excel file because copy paste worked here, but its still only for 45 (10-5?)
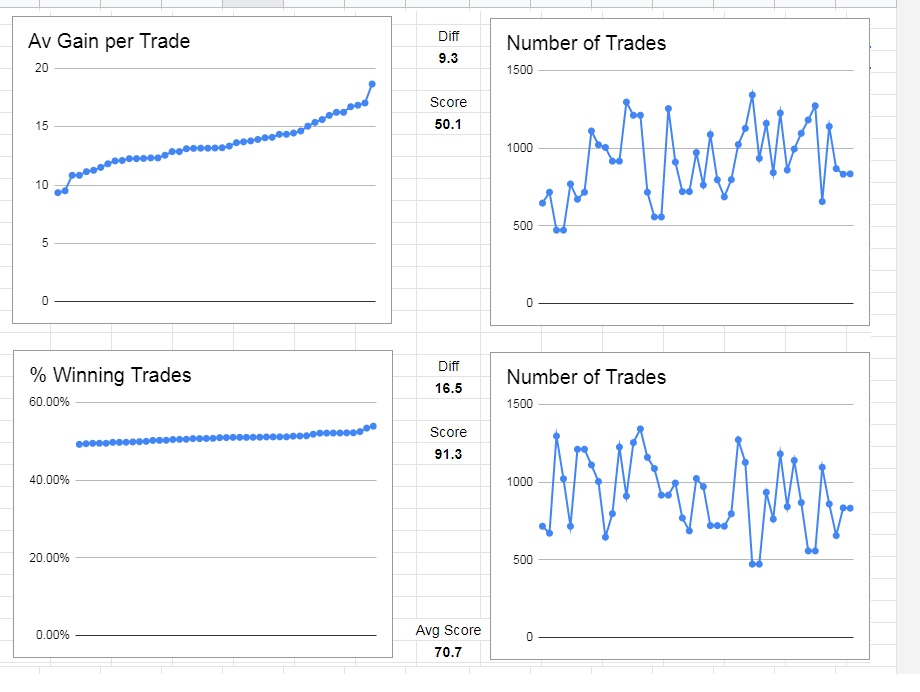
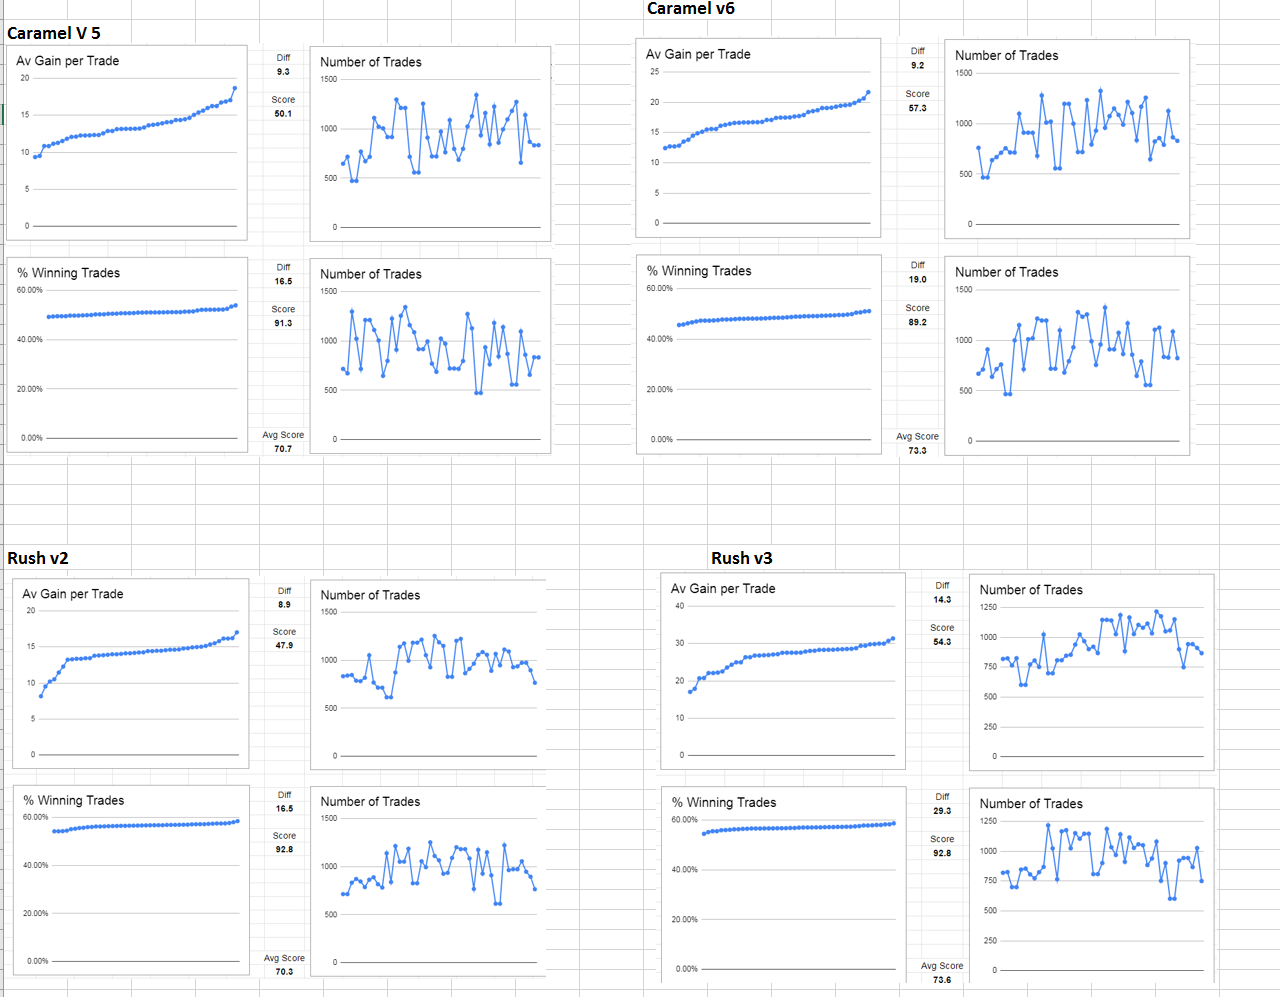
Edit: Can this be right?
I first dragged the avg gain per trade sorted low-> high, then i dragged and dropped the avg win rate low -> high
Yo sorry for spamming this topic, but im wondering, if what ive done is correct, what can you guys tell from these tests in my screenshot?
I got 2 different systems on 1H Wall st, next to them is the “new” version of the system, im still running the 2 original ones, but i kind of want to switch to newer version, im just not sure if its OK to switch or not.
Based on results from the robust tester: Would you switch systems? (note that Rush V3 buys 2 contracts instead of just 1, if a “turbofilter” is engaged. thats why avg gain per trade is alot higher than rush v2 – this increases the max drawdown by about 70% but almost 90% more profit..)
Thanks.
I wouldn’t expect to see much difference between them based just on those results. If I had to pick just one then I’d go with the new version of each, but you’d have to look at other factors, WF performance, profit, drawdown, regularity etc…
Hi Vonasi, thanks again for creating this excellent tool — if only it were incorporated into the optimization engine, so that one could optimize for robustness instead of profit. That would be a game changer.
Anyway, I just wanted to check that I’ve properly understood the logic behind the random VRT. For example, if we took 2 identical algos, start one and it takes a trade. While it is on market, we start the other one and it takes a different trade. Obviously, for algos that are on market a high % of the time they will have completely different trajectories because of the different starting point; so far so good.
But what about the same scenario with an algo that is only on market for maybe 25% of the time? Wouldn’t the two of them synchronise quite quickly, perhaps by the second trade, and therefore both produce more or less the same result as a straight back test? or am I missing something else here?
Firstly a robustness test allows you to check that your strategy is not curve fitted due to its starting candle.
Secondly a robustness allows you to test some of the trades that you missed while your original backtest already had trades open.
Thirdly even if you had no missed trades or the tests get into sync quite quickly a robustness test allows you to see what the equity curve would be if you hit a whole bunch of bad trades compared to if you hit a whole bunch of great trades. Your best and worst results in the robustness test will give you an idea of the best and worst to expect from your strategy.