No robustness test is a bad test compared to not robustness testing at all. However we should always keep in mind to ignore the extremes especially those test results that have very few trades in them. Better to delete them from the spread sheet results and not include them in the the analysis charts at all. Set a minimum trade quantity level and delete all test results that don’t meet it.
It is always a nice idea to include GRAPH TRADEON at the end of your strategy so you can see the sorts of trading sequences that your QTY and RANDOM settings are producing.
The need to take an average of lots of different robustness tests and the fact that they still might not see every possible trade along with this need to filter out the extreme test results is why I much prefer my ‘strategy every bar’ testing. Unfortunately this SEB method does not work easily on faster time frame strategies due to the massive number of strategies you are required to run to ensure that you miss as few trades as possible.
Thank you, @Vonasi. I concur on the extreme result too. I’m not proud in case having few trades that produce good result. Thanks for the advice about the GRAPH TRADEON
Dumb question: if the strategy have “not onmarket” before entry conditions, is RT useless?
Dumb question: if the strategy have “not onmarket” before entry conditions, is RT useless?
No. The TRADEON condition is the condition that decides whether a trade is allowed to open or not and it can be used with any other conditions including only opening a trade only if “not onmarket”. TRADEON must be checked only for the first market entry and not for following market entries if accumulating positions are part of the strategy.
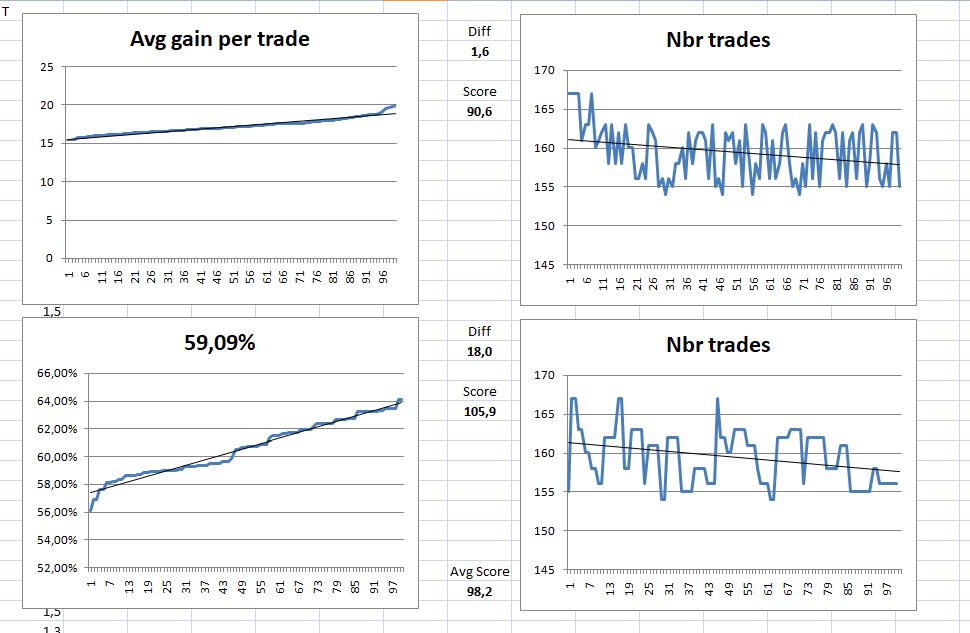
would this be an okay result according to you vonasi?
@ullle73, those are v unusual results. Either you have produced the most robust system ever … or there’s an error in your testing. It’s quite rare for the av gain per trade to go above 50, and I don’t think it’s possible for either result to go above 100 (i may be wrong about that).
would this be an okay result according to you vonasi?
There’s clearly something wrong, check it again
As others have said – those results are so good that there is a possibility that they could be too good to be true. You would need to double check how you have applied the robustness code. Not all strategies are suitable for this type of robustness testing – for example the robustness results for a strategy that opens a position and then is always on the market switching from one direction to the other will be meaningless.
oh i see, i just did the optimization and drag the result into excel. Could not get the code to work in the strategy, will try again 🙂 thanks
Hi
Phew, been through this thread today and found it incredibly interesting and useful….
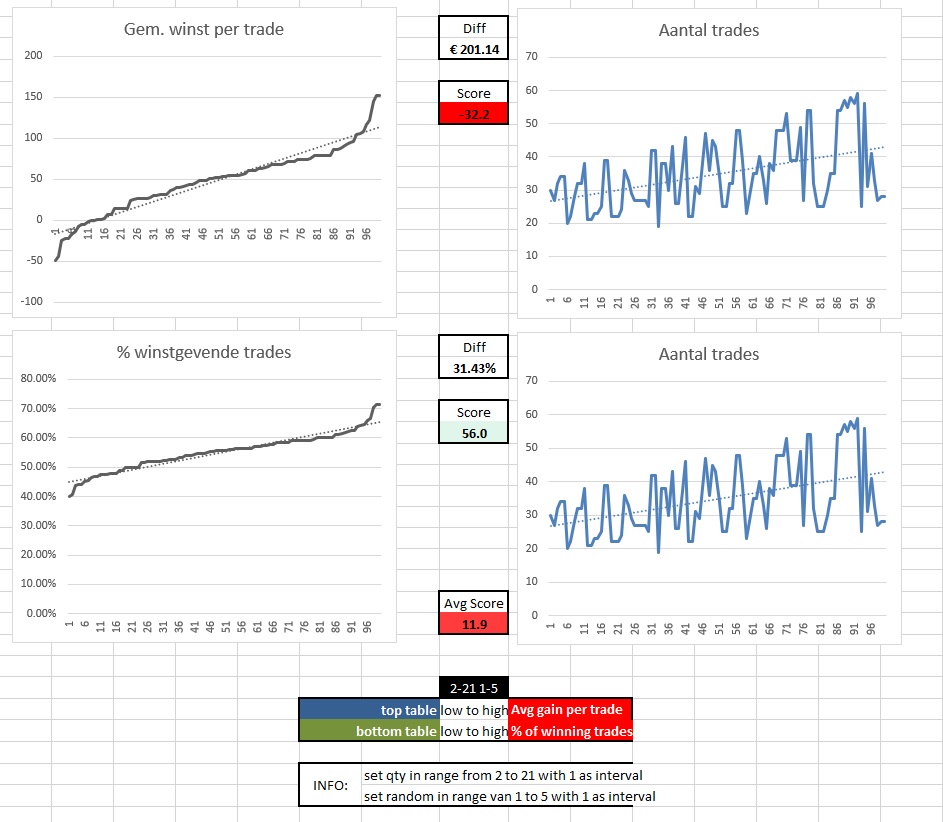
I’ve put one of my algos through this and have a result below – thanks to Vonsai, Paul (and everyone) for the algos and templates.
Can somebody please take a look and give me their feedback please. I’m not looking for a “go ahead” or “dont go ahead”, just an opinion from someone who has done this before as it will help me read results better in the future.
I used QTY 2-21, RANDOM 1-5 and used all 100 rows of data from each.
many thanks!
Sorry to bring bad news but that is a v poor score.
The evaluation is always going to be subjective but personally I like to see something above 35 in the top box and preferably in the 40-50 range. It rarely goes above 50. The % win is always a higher score and usually less problematic but 56 is not great – I’m usually looking for 80-90+ there.
Sorry to say but I think it’s back to the drawing board on this one. Hey ho … 🤔
NB i usually run it qty 2-10 and random 1-10 so results may vary, but not that much.
Sorry to say but I think it’s back to the drawing board on this one. Hey ho … 🤔
Hey, no worries! and thanks for the feedback
to ignore the extremes especially those test results that have very few trades in them. Better to delete them from the spread sheet results and not include them in the the analysis charts at all
With this in mind, I’m thinking it might be better to run it with something like qty 2-12 / random 1-10, giving 110 iterations of which PRT shows us the top 100? This would automatically remove the outliers, which in my experience tend to be at the bottom of the Avg Gain results.
What do you think?
That’s an option but I prefer just to see all 100 results and then manually delete any with hardly any trades from the spreadsheet rather than possibly lose 10% of results that could all also be fantastic and give me even more confidence in the strategy.
How about doing the parameter optimization (i.e., all the curve fitting) with the aid of a position entry scrambler like the robustness tester ? That means, during parameter optimization, you block several entries randomly, ideally using different blocking patterns as the robustness tester generates ? Shouldn’t this result in more robust systems from the start ?
So, could it be possible to apply position scrambling already during parameter optimization, not only in hindsight, as the robustnesss tester does ? I haven’t thought about how to code this, but would this be a feasible way to obtain more robust parameter sets for a given system ?