Hi nicholas. Any chance of adding an array learning video? I only just got used to using loops thanks to your helpful videos. It would nice to have an array section as well now that its available.
Hi,
Is-it possible to use arrays in proorder?
It seems I get a probacktest.error.parsing when I call an indicator with array computation.
Hi
Using one of the original array examples as below, is it possible to extract values from within an array variable?
To try and make it clearer what I mean, in the first line of the example below, would it be possible to extract ’10’ as the highest period being used? If so, how?
Many thanks
Rob
$var[0] = highest[10](high) //current highest high
$var[1] = highest[10](high)[20] //highest high from 20 bars ago
$var[2] = highest[30](high)[30] //highest high from 30 bars ago
Compare if $var[0] is equal to highest[10]?
$var[0] = highest[10](high) //highest high from bar 0 to bar 9
$var[1] = highest[10](high)[20] //highest high from bar 20 to bar 29
$var[2] = highest[30](high)[30] //highest high from bar 30 to bar 59
Hi
How can we visually check the contents of an array please?
Is it possible to use DRAWTEXT to loop through the array and output the values by using the using the # functionality?
e.g. DRAWTEXT(“#$array[i]#,Barindex,0) or something similar?
I’m creating arrays but have no idea if they are correct 🙁
Many thanks
Rob
 Kaci
KaciParticipant
Junior
Hi guys,
I’m working on a “Knn” indicator but at some point I need to be able to sort arrays, to be able to use “binary search” at least instead of having a FOR loop inside a FOR loop which leads to a ProRealTime bug because it takes forever… I had a very hard time trying to figure out how to sort an array, do you guys know by any mean how to do that ?
Cheers.
Currently sorting is not supported.
KaciParticipant
Junior
Thanks Roberto, I can’t wait such a new feature, that would be very handy.
Guys, please don’t double post, thanks (see rule about double posting in yellow box below, thanks)
Is it possible to use DRAWTEXT to loop through the array and output the values by using the using the # functionality? e.g. DRAWTEXT(“#$array[i]#,Barindex,0) or something similar?
Store your $array[i] in a classic variable before DRAWTEXTing it:
myVar = $array[i]
DRAWTEXT("#myVar#",Barindex,0)
 Bard
BardParticipant
Master
This example (and the other two) are a really excellent additions to the indicator library @Nicolas.
It’s very useful not just for outright trading in underlying assets but for options traders and In the Money and Out the Money probability expectations.
My post here explains more about the Option Pricing and the Black Scholes Pricing Model and the assumptions it makes:
https://www.prorealcode.com/topic/options-probabilities-using-the-black-scholes-assume-a-normal-distribution/
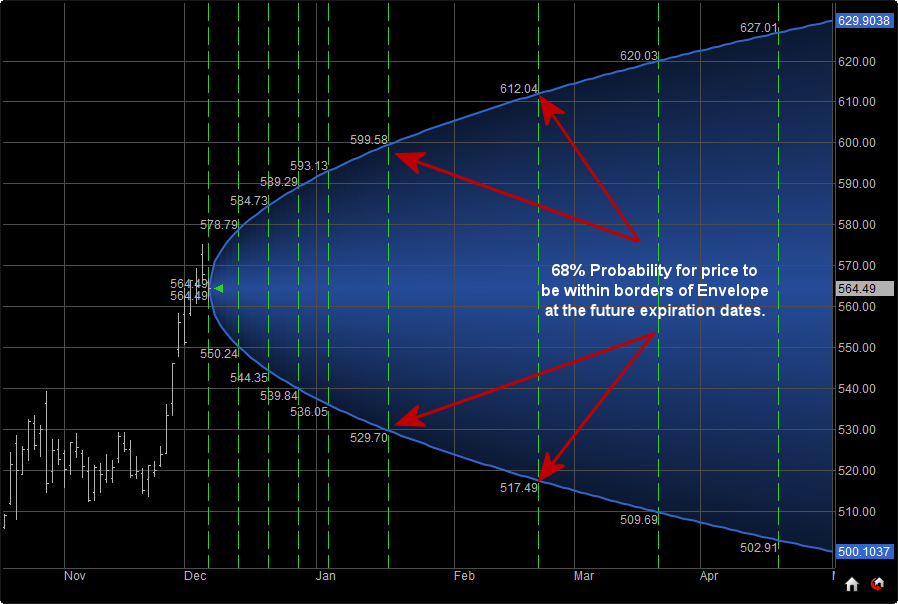
In my search for probability cones I found this image below (from
https://dthelp.dynamictrend.com/Probability_Envelope.htm) of a cone that also has vertical green dotted lines denoting options contract expiry dates. It would be great to know how your indicator could be coded so as to add IG Index’s Dow Jones/Wall Street DFB expiration dates for these following dates?
19/03/2021
16/04/2021
21/05/2021
Also is it at all possible to modify this normal distribution probability cone code, with components of the code for the Deviation Scaled Fisher Transform? That indicator attempts to convert prices into a Normal Gaussian probability density function — so that the probabilities in my Black Scholes link above can be made more realistic/reliable?
The theory behind the Ehler’s “Deviation Scaled Inverse Fisher Oscillator” indicator is that it attempts to remove the fat tails of a distribution. Fat tails distributions are distributions that have very statistically unlikely events occurring more frequently (hence the term “fat”) than the Normal Distribution suggests, eg S&P 500 returns. (Note: Assets like commodity prices have leptokurtic “Skinny Tail” distributions). Ehler’s indicator attempts to give a more perfect bell shaped Gaussian distribution which is necessary to trade low probability events at the extreme ends of the oscillator. This allows a price series to be placed into a probability distribution so that the probabilities of extreme moves corresponds to a normal standard deviation bell curve (distribution) which allows the prediction, in percentage terms, for the odds of a +2/-2 standard deviation move away from the mean price (centre of the bell curve).
So, basically I just wondered if your cone could be “hot rodded!?”
Cheers
Bard.
Ps/Apologies if this is double posted, I’d originally written this and not posted it last week and when I came back to it and posted it just now it didn’t appear in this thread or my “Topics with my Replies.”
BardParticipant
Master
Hi, just a quick bump, wondering if anyone can add some code to be able to add option expiration date dotted lines (as per image in previous post above) onto this excellent probability cone code?
Cheers.
BardParticipant
Master
Hi
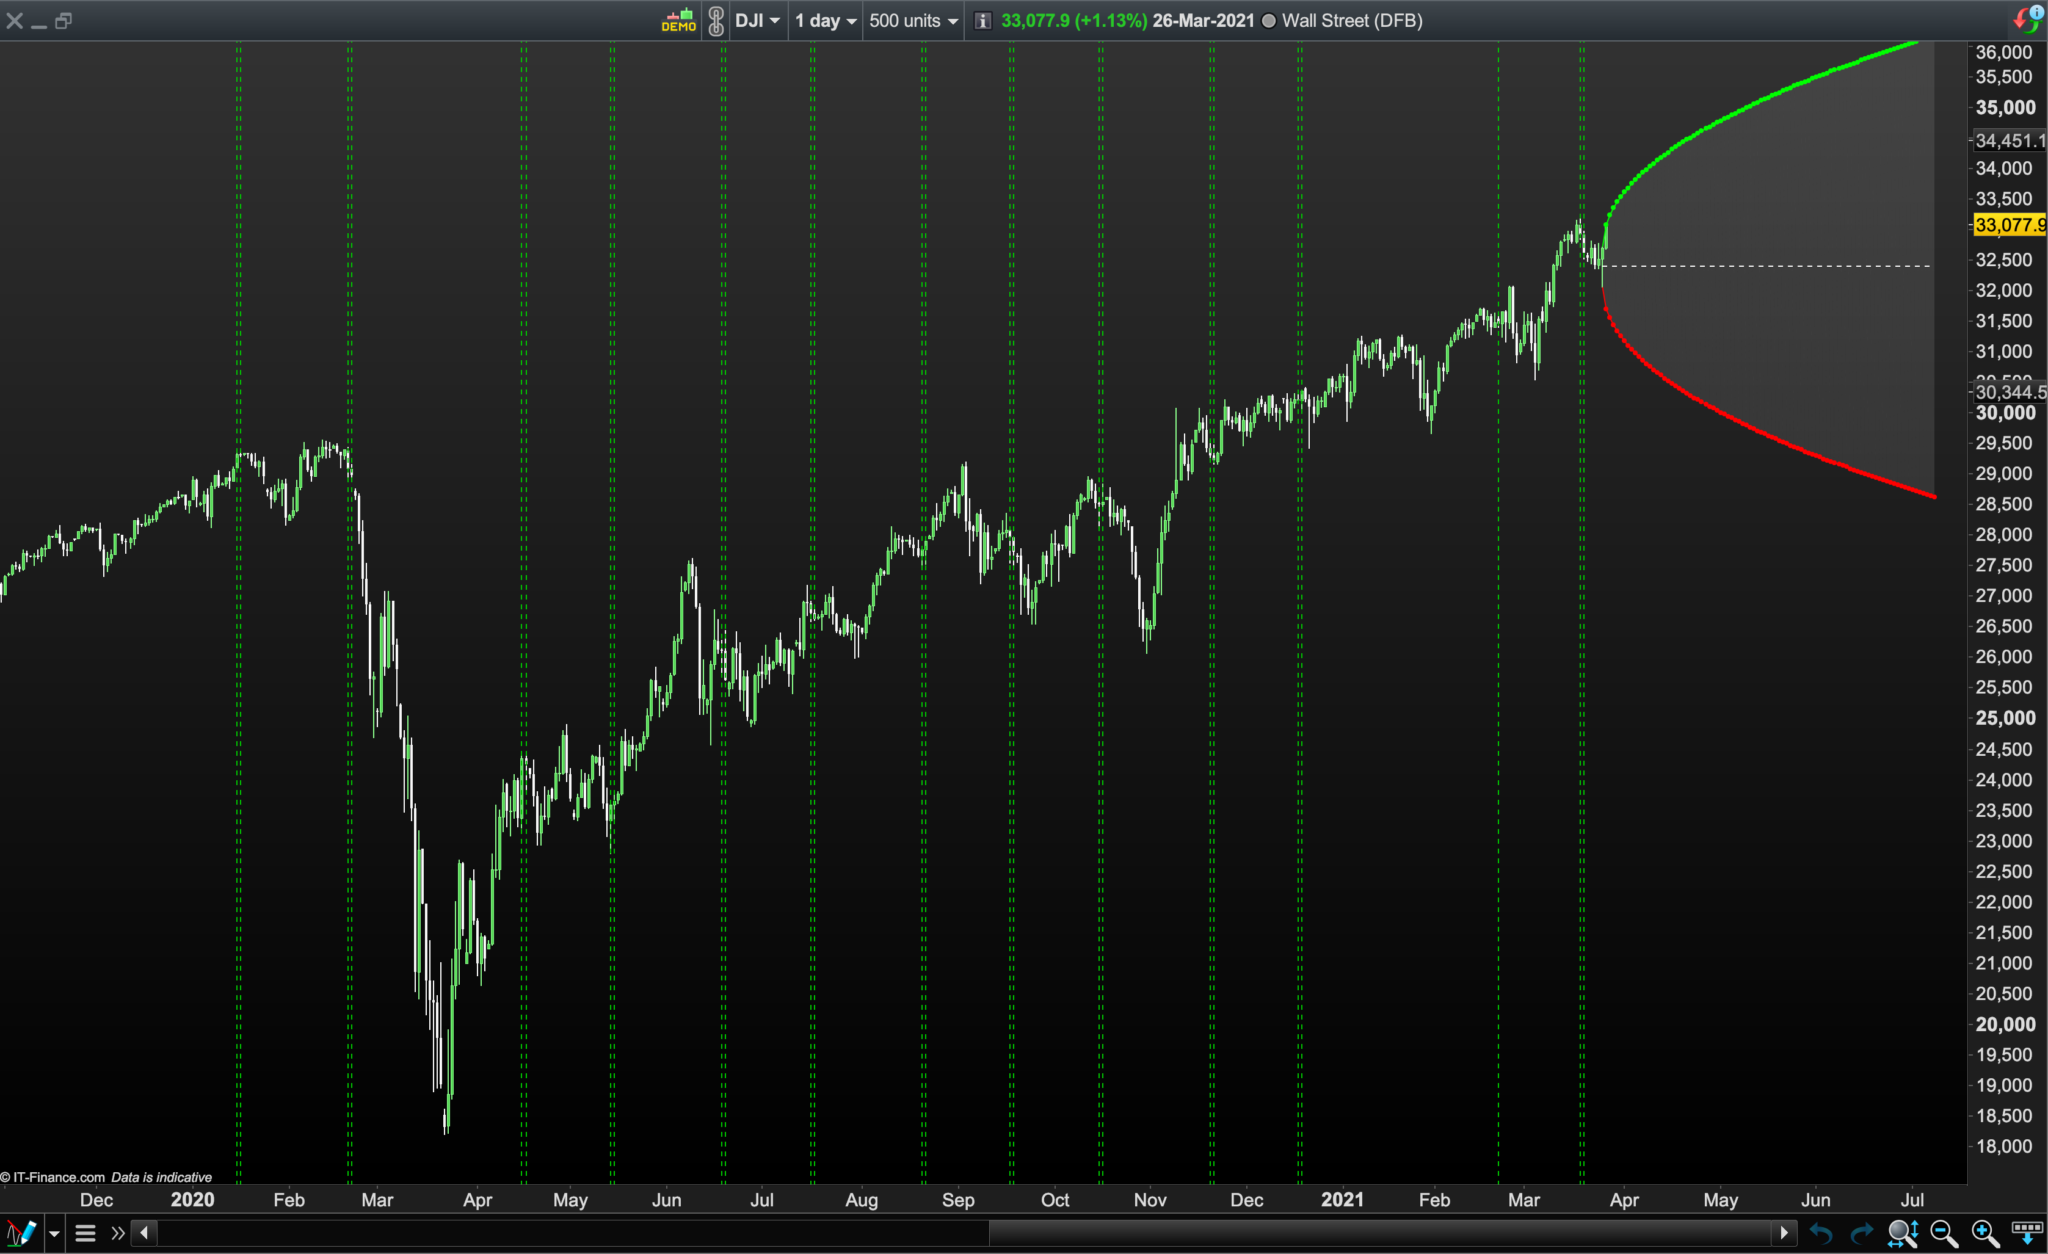
@Nicolas, I managed to figure out putting up dotted lines for option “stop trading” and “expiry dates” on a chart but can’t figure out why some lines are missing as the dates look correct:
Missing lines are evident for March 2020 (the Stop Trading line and Expiry Line the next day are both missing) and ditto for Jan 2021? Also why is the green line missing for the option expiry on 20210222 yet the Stop Trading line the day before is showing on 20210221?
Also how can I get it to plot the lines for the Stop/Expiry dates plotted ahead and throughout 2021, (not just up to the current month of March 2021)?
//Option Stop and Expiry Dates For 2020/2021
//https://www.marketwatch.com/optionscenter/calendar/2021

IF date = 20200117 OR date = 20200118 OR date = 20200221 OR date = 20200222 OR date = 202003120 OR date = 20200321 OR date = 20200417 OR date = 20200418 OR date = 20200515  OR date = 20200516 OR date = 20200619 OR date = 20200620 OR date = 20200717 OR date = 20200718 OR date = 20200821 OR date = 20200822 OR date = 20200918 OR date = 20200919 OR date = 20201016 OR date = 20201017 OR date = 20201120 OR date = 20201121 OR date = 20201218 OR date = 20201219 OR date = 20210116 OR date = 20210117 OR date = 20210221 OR date = 20210222 OR date = 20210319 OR date = 20210320 OR date = 20210416 OR date = 20210417 OR date = 20210521  OR date = 20210522 OR date = 20210618 OR date = 20210619 OR date = 20210716 OR date = 20210717 OR date = 20210820OR date = 20210821 OR date = 20210917 OR date = 20210918 OR date = 20211015 OR date = 20211016 OR date = 20211119 OR date = 20211120 OR date = 20211217 OR date = 20211218 THEN
drawvline(barindex[+0])COLOURED (0,200,0)style (dottedline)
ENDIF

RETURN
The Probability Cone looks good!
Cheers,
Bard
Date 202003120 has 9 digits, instead of 8, so it doesn’t match any date on the chart.
Date 20200321 cannot be plotted because DATE is the date when a candle closes and it should have been plotted at the closure of Friday, March 20th, but it can’t be plotted because the systems stops due to the end of the week.