
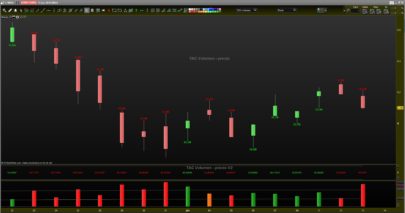
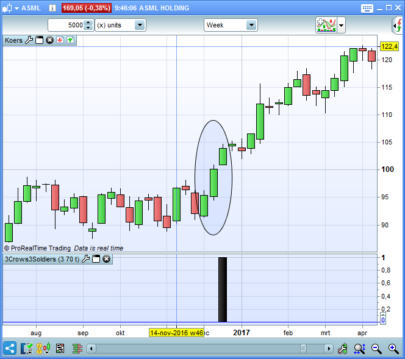
Binary indicator which adopts the Zigzag mechanism but as opposed to the above two indicators, it gives always valid signals about the direction of a trend and shows when that trend was confirmed.
It does not show peaks and troughs like Zigzag, but returns +1 for valid up trends and -1 for valid downtrends and it rejects all the invalid trends.
The real power of ZZT is that its signals are never revisable, so you can let the indicator provide valid signals for both the past and the present.
|
1 2 3 4 5 6 7 8 9 10 11 12 13 14 15 16 17 18 19 20 21 22 23 24 25 26 27 28 29 30 31 32 33 34 35 36 37 38 39 40 41 42 43 44 45 46 |
// price value price = close // ZigZag method : 1=percent, 2=points method = 1 // Reversal amount amnt = 10 IF method=1 THEN zz0 = ZigZag[amnt](price) ELSE zz0 = ZigZagPoint[amnt](price) ENDIF zz1 = zz0[1] zz2 = zz0[2] IF zz0 > zz1 AND zz1 < zz2 THEN ztr = zz1 ENDIF IF zz0 < zz1 AND zz1 > zz2 THEN zpk = zz1 ENDIF IF method=1 THEN PU = ztr + Abs(ztr) * amnt / 100 ELSE PU = ztr + amnt ENDIF IF method=1 THEN PD = zpk - Abs(zpk) * amnt / 100 ELSE PD = zpk - amnt ENDIF IF price >= PU AND zz0 > zz1 THEN res = 1 ELSIF price <= PD AND zz0 < zz1 THEN res = -1 ELSE res = 0 ENDIF RETURN res AS"ZZT" |
Share this
No information on this site is investment advice or a solicitation to buy or sell any financial instrument. Past performance is not indicative of future results. Trading may expose you to risk of loss greater than your deposits and is only suitable for experienced investors who have sufficient financial means to bear such risk.
ProRealTime ITF files and other attachments :
Find other exclusive trading pro-tools on ![]()
PRC is also on YouTube, subscribe to our channel for exclusive content and tutorials


Hi lolo, do you know why when importing this ontoPRT v10.2 it just gives a flat line?
Thanks.
I’m interested in this indicator but it does not appear to work on 10.3. Could it be possible for someone to get it working on 10.3? Or maybe I’m just applying it incorrectly as I am a newbie to importing indicators to PRT.
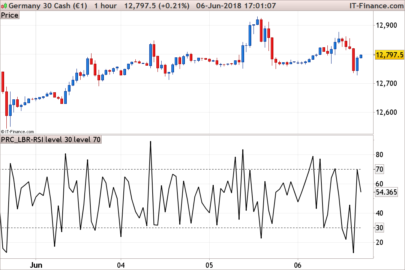
I’m also a little confused by the image shown as a zigzag is normally either trending up or down and so the result shown would be either +1 or -1 but the image shows a lot of zero.
Thanks for any help with this.
Chris
You need to change the ‘amnt’ variable to a percentage, so if you set it to 10 it represents a 10% needed for a new zigzag to be found, which is quite enormous for many instruments / timeframe.
Thanks for your reply – I had tried that – I set the amnt to 1 on a 15 min GBPUSD chart and could see no results except zero. I have now tried it on a daily chart and see that I get some results but they do not seem to agree in anyway to the standard zig zag set to 1% on the chart. I am still confused as to what exactly the +1 zero and -1 actually represent. Is there anyway to get an indicator that just returns +1 or -1 depending upon whether a zigzag is trending up or trending down at any moment in time?
Chris