

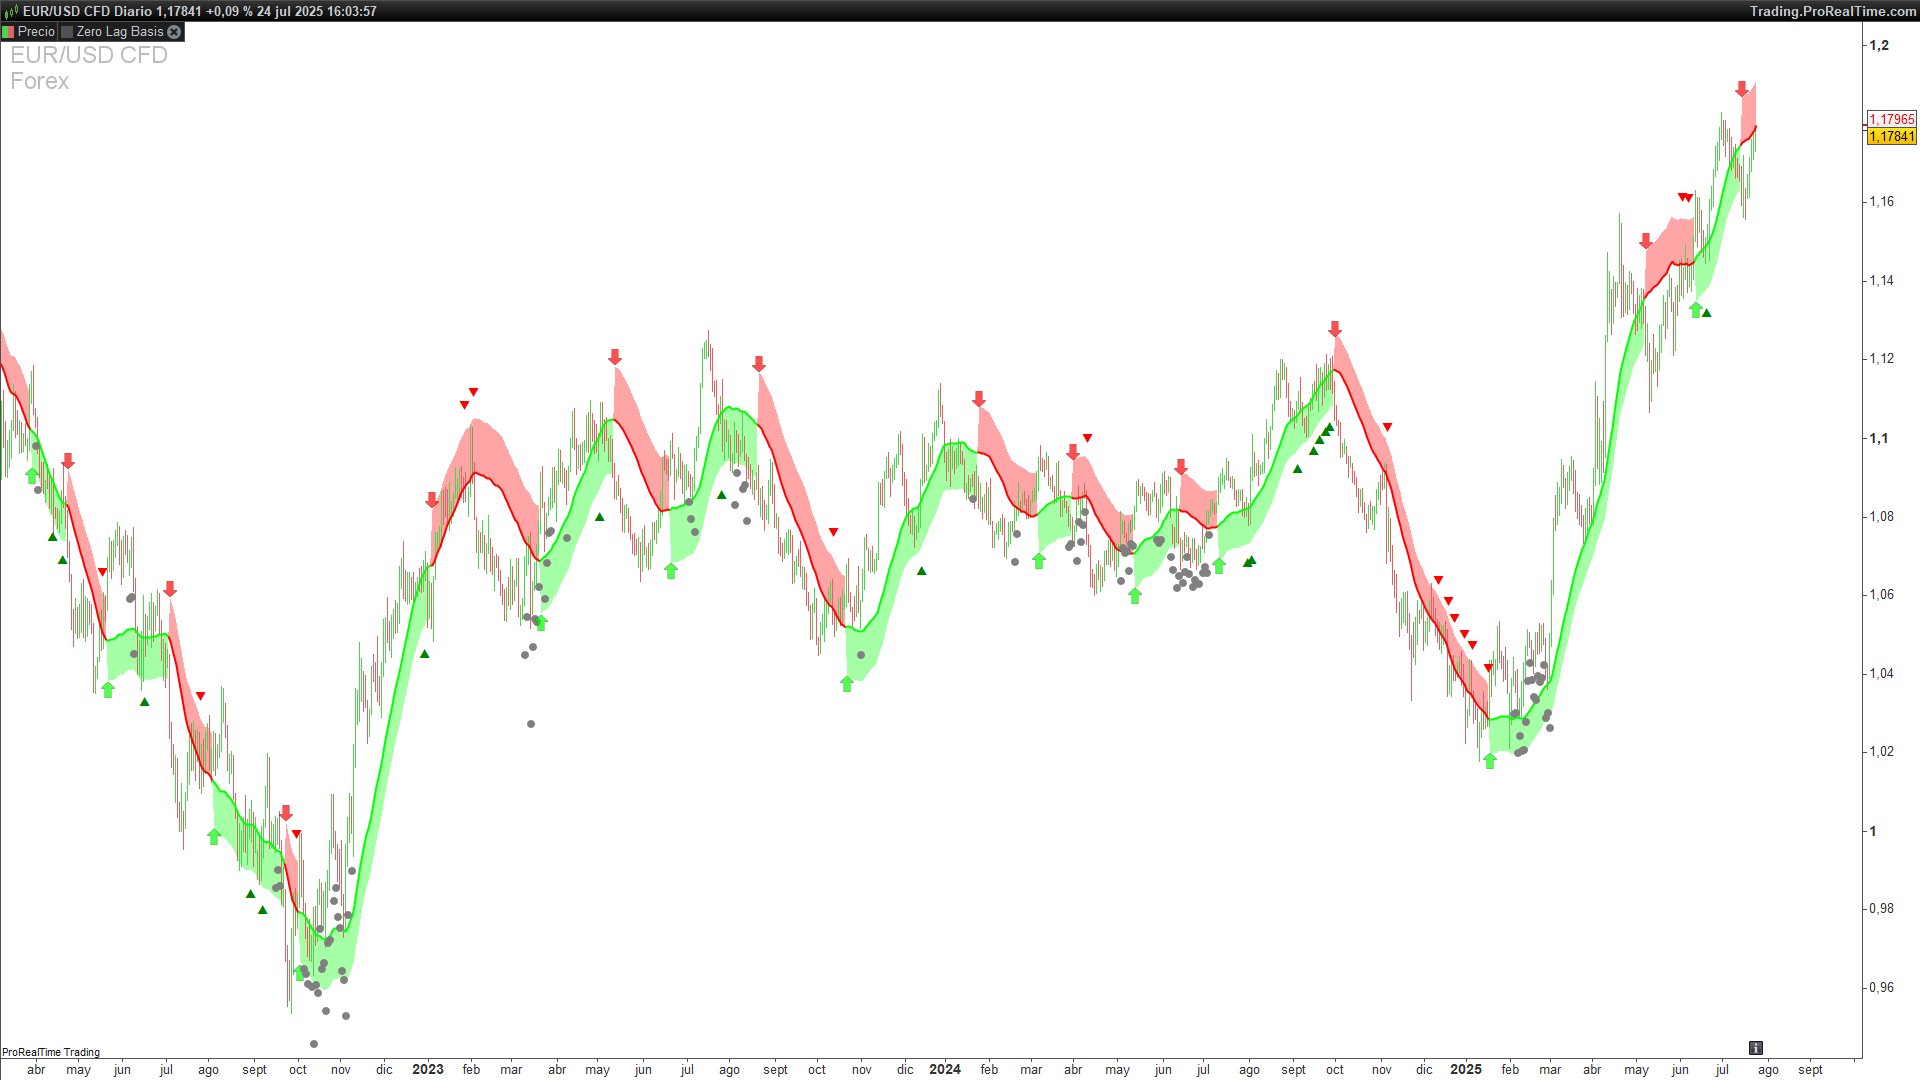
Zero Lag Trend Signals + Sideways filter
1. Introduction
The Zero Lag Trend Signals + Sideways filter indicator, developed by Algoalpha, is designed to capture trend changes rapidly by minimizing the lag inherent in traditional moving averages. It also incorporates a sideways-market filter to suppress signals when the instrument is trading in a range, thereby enhancing the reliability of entries and exits.
2. Overview
This indicator combines three core elements:
-
ZLEMA (Zero Lag Exponential Moving Average): A moving average that adjusts for price lag.
-
Volatility band (based on ATR): Defines upper and lower thresholds around the ZLEMA to confirm significant moves.
-
Sideways-market filter: Uses RSI and ADX to detect low-momentum, ranging conditions and suspend trend signals.
3. Component Calculations
3.1 ZLEMA Calculation
-
Lag
-
Zero Lag EMA
-
srcis the source price (default:close). -
average[length, 1]is the built-in ProRealTime EMA function.
-
3.2 Volatility Band
-
ATR over
lengthperiods -
Band width
-
multscales the band (default:1.2). -
Upper band =
zlema + band, Lower band =zlema − band.
-
3.3 Sideways-Market Filter
-
RSI condition
-
ADX condition
-
Combined sideways flag
-
When
sidewaysis true (andshowSideways = 1), grey points mark ranging bars.
-
4. Signals and Visualization
-
Trend state (
trend):-
Set to
1when price crosses abovezlema + band. -
Set to
–1when price crosses belowzlema – band. -
No change when
sidewaysis true.
-
-
Arrows
-
Buy arrow: Upward arrow below price on fresh bullish trend.
-
Sell arrow: Downward arrow above price on fresh bearish trend.
-
-
Extra markers
-
Small green “▲” when price re-crosses ZLEMA in an uptrend.
-
Small red “▼” when price re-crosses ZLEMA in a downtrend.
-
-
Colored area
-
Fills between ZLEMA and the appropriate band to highlight trend strength:
-
Solid color when in trend, transparent when out of band or sideways.
-
-
5. Parameters and Defaults
| Parameter | Default | Description |
|---|---|---|
length |
70 | Look-back for ZLEMA, ATR and highest ATR. |
mult |
1.2 | Multiplier for the ATR-based volatility band. |
src |
close |
Price source for ZLEMA calculation. |
rsilength |
14 | Period for the RSI component of the sideways filter. |
adxlength |
14 | Period for the ADX component of the sideways filter. |
showSideways |
1 | Show grey dots when market is detected as sideways (1 = on, 0 = off). |
6. ProRealTime Code
//-------------------------------------//
//PRC_Zero Lag Trend Signals + Sideways filter (Algoalpha)
//version = 0
//06.05.25
//Iván González @ www.prorealcode.com
//Sharing ProRealTime knowledge
//-------------------------------------//
//---Inputs
//-------------------------------------//
length=70
mult=1.2
src=close
rsilength=14
adxlength=14
showSideways=1
//-------------------------------------//
// Sideways market calculation
//-------------------------------------//
//---RSI
rsivalue=rsi[rsilength](close)
rsiCondition=rsiValue>40 and rsiValue<60
//---ADX
pdi=DIplus[adxlength](close)
mdi=DIminus[adxlength](close)
iadx=ADX[adxlength]
adxCondition=iadx<=25 and iadx<pdi and iadx<mdi
//---Sideways
sideways=rsiCondition and adxCondition
if showSideways and sideways then
drawpoint(barindex,low-tr,2)coloured("grey")
endif
//-------------------------------------//
// Zlema calculation
//-------------------------------------//
lag=floor((length-1)/2)

myzlema=average[length,1](src+(src-src[lag]))
//-------------------------------------//
// Volatility calculation
//-------------------------------------//
atr=averagetruerange[length](close)
volatil=highest[length*3](atr)*mult
//-------------------------------------//
// Trend condition
//-------------------------------------//
once trend=0
if sideways=0 then
if close crosses over myzlema+volatil then
trend=1
r=0
g=255
elsif close crosses under myzlema-volatil then
trend=-1
r=255
g=0
endif
endif
//-------------------------------------//
// Signals and colors
//-------------------------------------//
if trend=-1 then
upper=myzlema+volatil
alpha1=90
lower=myzlema
alpha2=0
if trend<>trend[1] and sideways=0 then
drawarrowdown(barindex,upper+0.25*atr)coloured(r,g,0,175)
endif
else
upper=myzlema
alpha1=0
lower=myzlema-volatil
alpha2=90
if trend<>trend[1] and sideways=0 then
drawarrowup(barindex,lower-0.25*atr)coloured(r,g,0,175)
endif
endif

if close crosses over myzlema and trend=1 and trend[1]=1 and sideways=0 then
drawtext("▲",barindex,myzlema-volatil*1.5)coloured("green")
elsif close crosses under myzlema and trend=-1 and trend[1]=-1 and sideways=0 then
drawtext("▼",barindex,myzlema+volatil*1.5)coloured("red")
endif
if barindex > 4*length then
colorbetween(myzlema,upper,r,g,0,alpha1)
colorbetween(myzlema,lower,r,g,0,alpha2)
endif
//-------------------------------------//
return myzlema as "Zero Lag Basis"style(line,2)coloured(r,g,0)