Zero-Lag MA Trend Levels
Introduction
A moving average cross tells you the trend changed. It does not tell you where to act. By the time two averages cross, price has usually already moved, and the cross itself gives you no level, no invalidation and no way to re enter if you missed it.
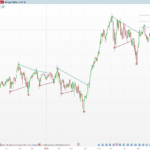
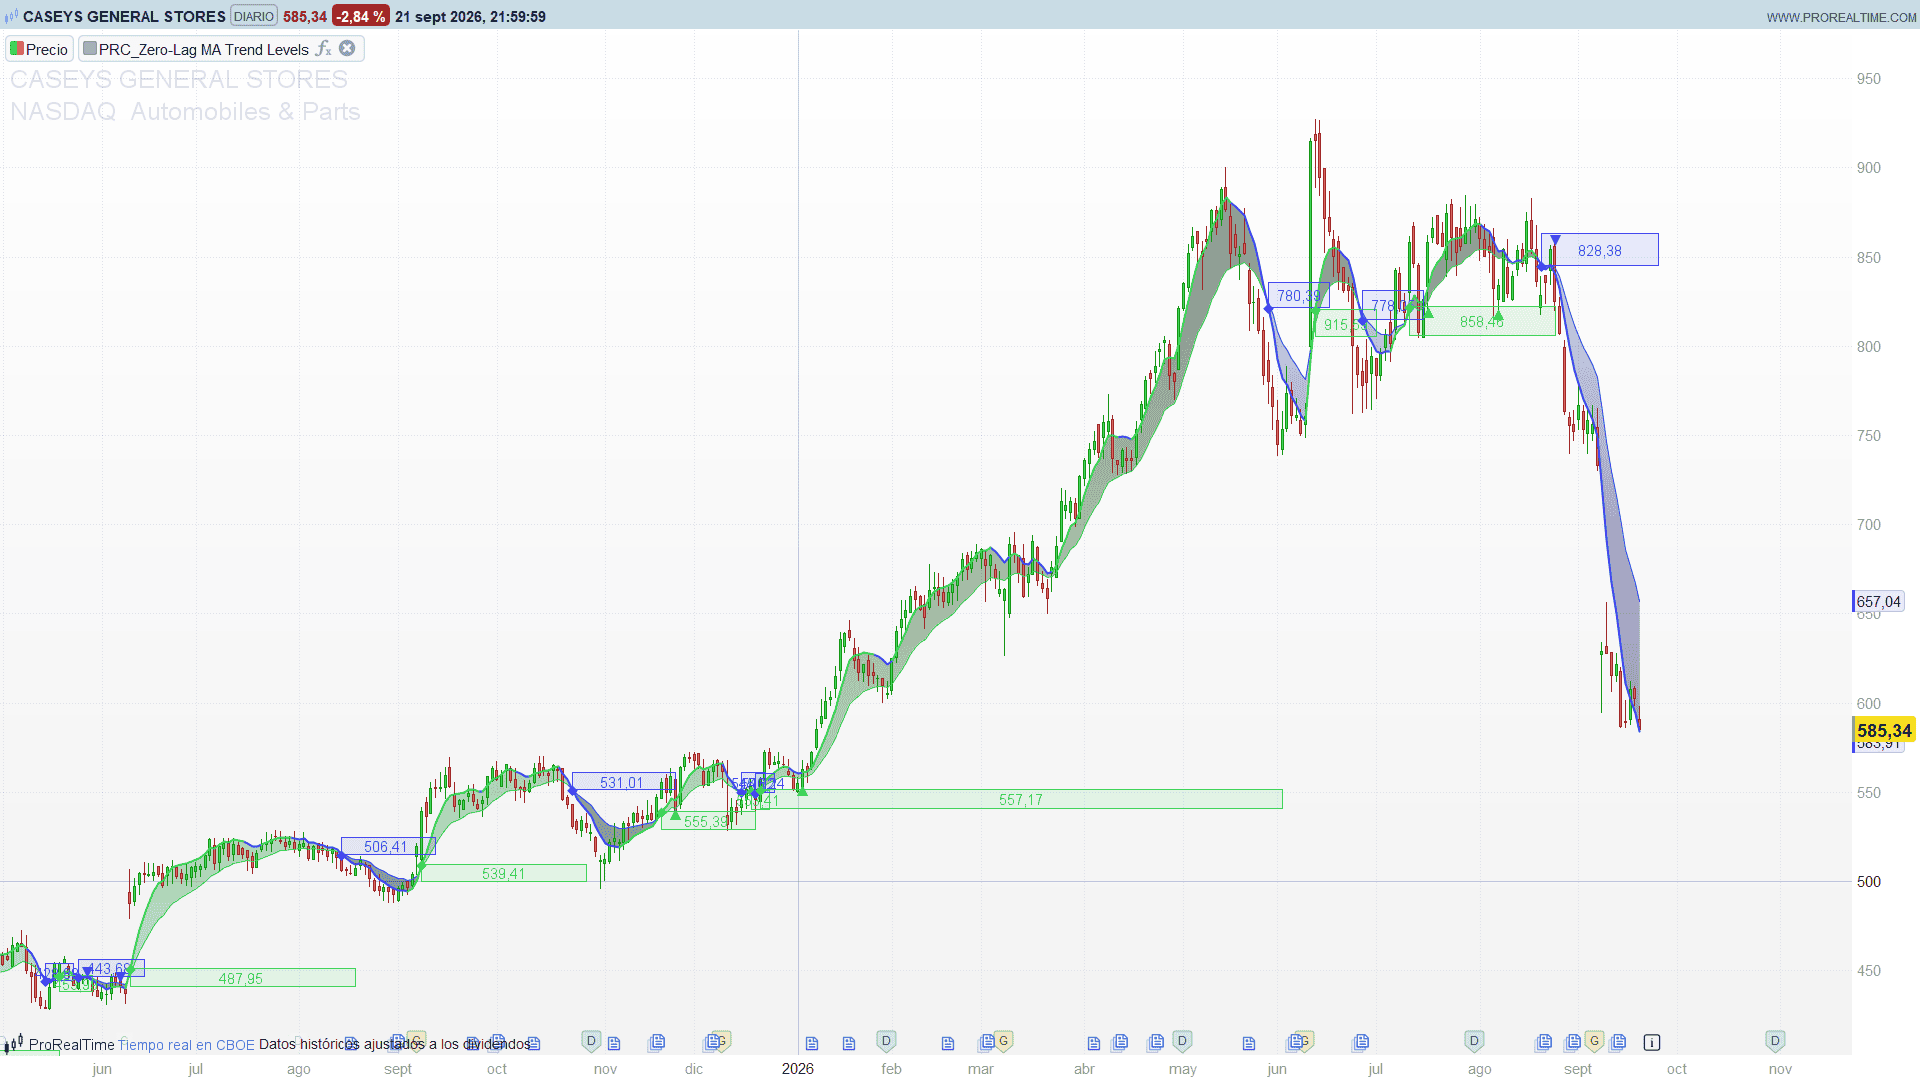
Zero-Lag MA Trend Levels, by ChartPrime, closes that gap. It crosses a zero lag average against a plain EMA of the same period, and on every cross it stamps a zone one ATR deep onto the chart, anchored to the average itself. That zone becomes the working level for the whole leg: support underneath price in an uptrend, resistance above it in a downtrend. It carries the price at which the cross happened, it extends forward as long as the trend lasts, and when price eventually clears it in the direction of the trend, the indicator prints a mark.
So instead of one event you get three: a regime change, a zone to trade against, and a continuation signal inside the move.
Theory Behind the Indicator
Removing the lag by mirroring price across its own average
Every moving average lags because it averages the past. The trick here is to feed the average a series that is deliberately pushed forward by exactly the amount the average will pull it back:
ema        = EMA(close, length)
correction = close + (close - ema)
zlma       = EMA(correction, length)
Read the middle line carefully. The term close - ema is how far price currently sits above or below its own average, which is precisely the lag. Adding that distance back to price produces a mirror image of the average on the other side of price. When the second EMA smooths that mirrored series, the lag it introduces cancels against the lead already built in, and the resulting curve sits on price instead of trailing behind it.
This is worth separating from the other two constructions that share the name. Ehlers style zero lag shifts the price series in time and reduces lag by looking back a fixed number of bars. Zero lag built from a double TEMA cascade applies the same filter twice and combines the outputs. This one works in the price dimension rather than the time dimension: it reflects price across its own average. Different maths, different behaviour around turns, and it matters in practice, because the reflection amplifies noise in a flat market while the time shift does not.
The cross as a regime, the ATR as the zone
The regime is simply which side of the EMA the zero lag curve sits on. Because the zero lag curve reacts first, it crosses the slower EMA early in a move, and that cross is the event.
On every cross a zone is created, one ATR(200) deep, anchored to the zero lag curve:
- Bullish cross: the zone hangs below the curve, from
zlma - ATRup tozlma. It is prospective support. - Bearish cross: the zone sits above the curve, from
zlmaup tozlma + ATR. It is prospective resistance.
Two design choices give the zone its character. It is anchored at the moment of the cross and then frozen in price, so it becomes a static horizontal reference rather than a trailing band, which is what makes it usable as a level. And its depth comes from a long, slow ATR(200) rather than a fast one, so the zone thickness reflects the instrument normal volatility rather than the volatility of the last few bars. A single wild session does not inflate it.
Each zone keeps extending to the right for as long as the regime holds, and stops the moment the next cross opens a new one. The price at which the cross occurred is printed on it.
Two colour layers
The curve and the ribbon carry independent information, which is easy to miss:
- The zero lag curve is coloured by its own slope over the last three bars. Rising is bullish, falling is bearish.
- The EMA and the ribbon between the two lines are coloured by the regime, meaning which side of the curve the EMA sits on.
When the two disagree, the curve has started to roll over while the regime has not flipped yet. That divergence between the two colour layers is the earliest warning the indicator gives.
The continuation mark
The last layer is the one most people overlook, and it is the most tradeable.
Once a regime is established and the signal bar and the one after it are out of the way, the indicator watches how price interacts with the live zone. It prints a mark when price clears the zone decisively in the direction of the trend, meaning the entire candle is on the right side of it: the low above the top of a support zone, or the high below the bottom of a resistance zone. A wick poking through is not enough.
That is a pullback that has been tested and rejected, not a fresh signal. Price came back into the zone, the zone held, and the candle closed the argument.
How to Read the Indicator
- The diamond is the regime change. It prints on the bar where the curve crossed the EMA, on the curve itself, and a new zone opens there.
- The zone is your working level for the whole leg. A green zone below price is support, a blue zone above price is resistance. The number on it is the price where the regime flipped.
- The ribbon tells you the regime, the curve colour tells you the momentum. Both the same colour means agreement. A curve that turns while the ribbon has not is an early warning.
- The triangles are continuation entries, not new signals. They mark a pullback into the zone that failed to break it.
- Price inside the zone is undecided. The zone is a band, not a line. What matters is whether price leaves it upward or downward.
Practical Applications
- Trade the zone, not the cross. Instead of entering on the diamond, which is often already extended, wait for price to pull back into the zone and place the entry at the far edge with the stop just beyond it. The zone gives you both.
- Ready made invalidation. The outer edge of the zone (the ATR side) is a natural stop: if price closes through the whole zone, the level that defined the trend has failed.
- Continuation entries with the triangles. A triangle inside an established trend is a pullback that held. It is a lower risk way to join a move than chasing the original cross.
- Regime filter for another system. Allow longs only while the ribbon is bullish and shorts only while it is bearish, and let your own entry logic handle timing.
- Multi timeframe. Use the higher timeframe regime as directional bias and take the lower timeframe zone reactions only in that direction.
- Old zones are structural memory. Levels from previous legs stay on the chart. Watch how price behaves when it returns to one: they were meaningful once, and often still are.
Indicator Configuration
length= 15: period of both the zero lag curve and the EMA. Lower reacts faster and crosses more often, higher filters harder. Both averages always share it, which is what keeps the cross meaningful.showLevl= 1: set to 0 to hide the zones and keep the two curves and the ribbon on their own.maxBox= 40: how many past zones stay on the chart.maxMark= 60: how many continuation triangles stay on the chart.
The ATR that sets the zone depth is fixed at 200 periods, matching the original. On very short intraday timeframes 200 bars covers a long stretch of session, so the zone may look wide relative to recent ranges. That is intentional: the zone is meant to represent the instrument habitual volatility, not the volatility of the last hour.
Two limits deserve a word. The original keeps up to 500 objects on the chart; this version keeps 40 zones and 60 marks, which is what a chart can display legibly and what keeps the redraw fast. Raise them if you want deeper history.
Code
//-------------------------------------//
//PRC_Zero-Lag MA Trend Levels
//version = 0
//22.09.26
//Iván González @ www.prorealcode.com
//Author: ChartPrime
//Sharing ProRealTime knowledge
//-------------------------------------//
DEFPARAM drawonlastbaronly = true
//-------------------------------------//
// Inputs
//-------------------------------------//
length   = 15   // Length of both moving averages
showLevl = 1    // 1 = draw the trend level boxes, 0 = hide them
maxBox   = 40   // How many past levels are kept on the chart
maxMark  = 60   // How many retest marks are kept on the chart

// Bullish / bearish colours
upR = 48
upG = 212
upB = 83
dnR = 64
dnG = 67
dnB = 241

//-------------------------------------//
// Zero-Lag MA
// The correction mirrors price across its own EMA, so the second
// EMA lands on price instead of trailing behind it.
//-------------------------------------//
src        = customclose
emaValue   = average[length,1](src)
correction = src + (src - emaValue)
zlma       = average[length,1](correction)

atrV = averagetruerange[200](close)

signalUp = zlma crosses over emaValue
signalDn = zlma crosses under emaValue

IF signalUp OR signalDn THEN
   chkSig = 1
ELSE
   chkSig = 0
ENDIF

//-------------------------------------//
// Colours
//-------------------------------------//
// ZLMA is coloured by its own slope over the last 3 bars. When it is
// flat the original leaves a gap; here the last colour is kept so the
// line stays continuous.
ONCE zr = upR
ONCE zg = upG
ONCE zb = upB

IF zlma > zlma[3] THEN
   zr = upR
   zg = upG
   zb = upB
ELSIF zlma < zlma[3] THEN
   zr = dnR
   zg = dnG
   zb = dnB
ENDIF

// The EMA and the ribbon are coloured by which side of the ZLMA it sits on
IF emaValue < zlma THEN
   er = upR
   eg = upG
   eb = upB
ELSE
   er = dnR
   eg = dnG
   eb = dnB
ENDIF

COLORBETWEEN(zlma, emaValue, er, eg, eb, 51)

//-------------------------------------//
// Trend levels
// A box is opened on every crossover and keeps extending 4 bars to the
// right until the next signal opens a new one. Boxes are stored instead
// of drawn on the spot, so past levels survive the repaint.
//-------------------------------------//
ONCE nBox = 0
ONCE nMark = 0

IF showLevl = 1 AND chkSig = 1 THEN
   // freeze the box that was still alive: its last extension was one bar ago
   IF nBox > 0 THEN
      $bxX2[nBox] = barindex + 3
   ENDIF

   WHILE nBox >= maxBox DO
      FOR i = 1 TO nBox - 1 DO
         $bxX1[i]  = $bxX1[i+1]
         $bxX2[i]  = $bxX2[i+1]
         $bxTop[i] = $bxTop[i+1]
         $bxBot[i] = $bxBot[i+1]
         $bxDir[i] = $bxDir[i+1]
         $bxPx[i]  = $bxPx[i+1]
      NEXT
      nBox = nBox - 1
   WEND

   nBox = nBox + 1
   $bxX1[nBox] = barindex
   $bxX2[nBox] = barindex + 4
   $bxPx[nBox] = round(close * 100) / 100

   IF signalUp THEN
      // support zone hanging below the ZLMA
      $bxTop[nBox] = zlma
      $bxBot[nBox] = zlma - atrV
      $bxDir[nBox] = 1
   ELSE
      // resistance zone sitting above the ZLMA
      $bxTop[nBox] = zlma + atrV
      $bxBot[nBox] = zlma
      $bxDir[nBox] = -1
   ENDIF
ENDIF

// Edges of the box that is currently alive
IF nBox > 0 THEN
   liveTop = $bxTop[nBox]
   liveBot = $bxBot[nBox]
ENDIF

//-------------------------------------//
// Retest marks
// Price failing back through the live zone, once the signal bar and the
// one right after it are out of the way.
//-------------------------------------//
IF showLevl = 1 AND nBox > 0 AND chkSig = 0 AND chkSig[1] = 0 THEN
   mkHit = 0

   IF high crosses under liveBot AND emaValue > zlma THEN
      mkHit = -1
      mkY = high[1]
   ELSIF low crosses over liveTop AND emaValue < zlma THEN
      mkHit = 1
      mkY = low[1]
   ENDIF

   IF mkHit <> 0 THEN
      WHILE nMark >= maxMark DO
         FOR i = 1 TO nMark - 1 DO
            $mkX[i]   = $mkX[i+1]
            $mkY[i]   = $mkY[i+1]
            $mkDir[i] = $mkDir[i+1]
         NEXT
         nMark = nMark - 1
      WEND
      nMark = nMark + 1
      $mkX[nMark]   = barindex - 1
      $mkY[nMark]   = mkY
      $mkDir[nMark] = mkHit
   ENDIF
ENDIF

//-------------------------------------//
// Drawing
//-------------------------------------//
IF islastbarupdate THEN

   IF nBox > 0 THEN
      FOR i = 1 TO nBox DO
         IF i = nBox THEN
            xr = barindex + 4   // the live box is still extending
         ELSE
            xr = $bxX2[i]
         ENDIF

         IF $bxDir[i] = 1 THEN
            br = upR
            bg = upG
            bb = upB
            dY = $bxTop[i]
         ELSE
            br = dnR
            bg = dnG
            bb = dnB
            dY = $bxBot[i]
         ENDIF

         DRAWRECTANGLE($bxX1[i], $bxTop[i], xr, $bxBot[i]) COLOURED(br,bg,bb,255) FILLCOLOR(br,bg,bb,26)

         // Price tag as plain text: a box measured in bars cannot hold a
         // label measured in pixels once you zoom out.
         pxTag = $bxPx[i]
         xTag  = round(($bxX1[i] + xr) / 2)
         yTag  = ($bxTop[i] + $bxBot[i]) / 2
         DRAWTEXT("#pxTag#", xTag, yTag) COLOURED(br,bg,bb,255)

         // Signal diamond, on the ZLMA side of the zone
         DRAWTEXT("◆", $bxX1[i], dY) COLOURED(br,bg,bb,255)
      NEXT
   ENDIF

   IF nMark > 0 THEN
      FOR i = 1 TO nMark DO
         IF $mkDir[i] = 1 THEN
            DRAWTEXT("▲", $mkX[i], $mkY[i]) COLOURED(upR,upG,upB,255)
         ELSE
            DRAWTEXT("▼", $mkX[i], $mkY[i]) COLOURED(dnR,dnG,dnB,255)
         ENDIF
      NEXT
   ENDIF

ENDIF

//-------------------------------------//
RETURN zlma AS "Zero-Lag MA" STYLE(line,2) COLOURED(zr,zg,zb), emaValue AS "EMA" STYLE(line,1) COLOURED(er,eg,eb)
Conclusion
The idea behind Zero-Lag MA Trend Levels is small and useful: a moving average cross is an event, and events are worth remembering as levels. By freezing an ATR deep zone at every cross and keeping it alive for the whole leg, the indicator converts a signal that is usually gone in one bar into a reference that stays tradeable for weeks. Add the two colour layers for momentum against regime, and the continuation marks for pullbacks that held, and what starts as a simple cross of two averages ends up as a complete framework: where the trend turned, where to enter, and where you are wrong.