

Automatic Fibonacci Levels on the Latest Swing
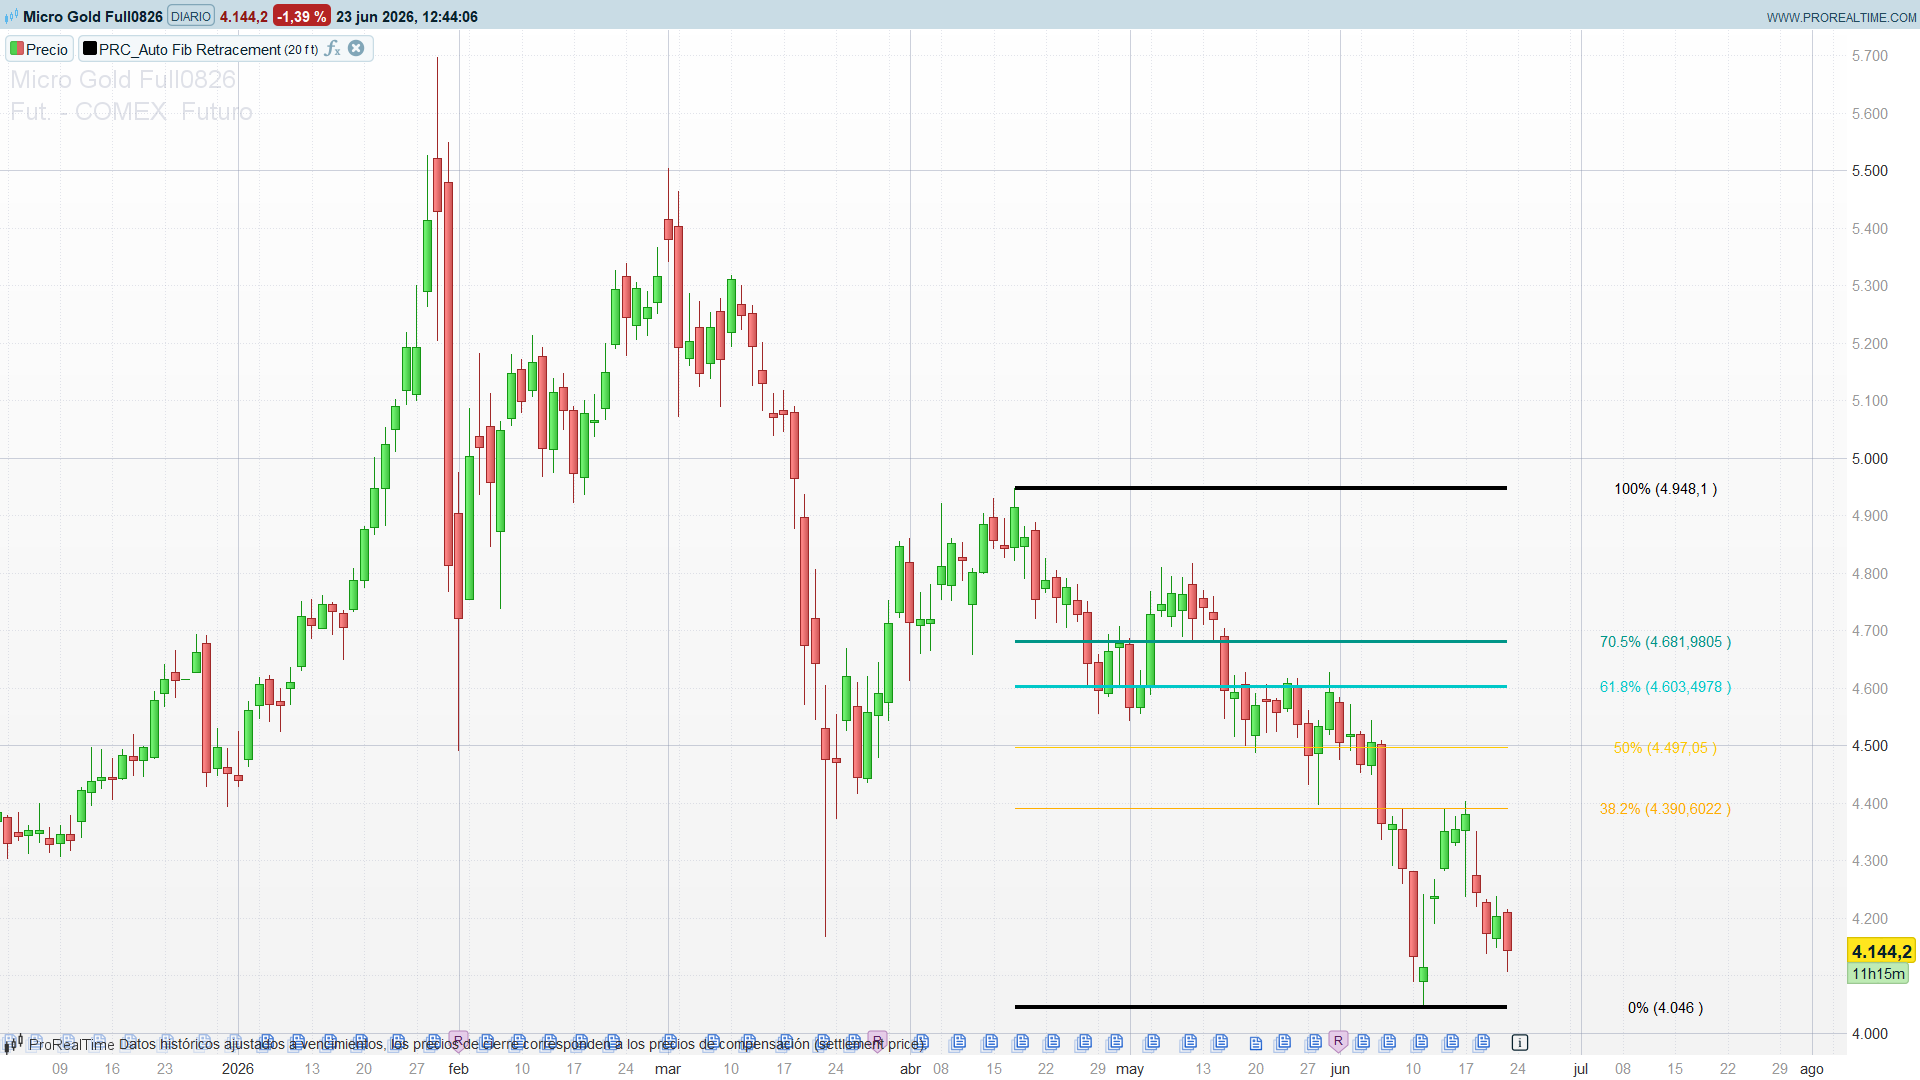
Drawing Fibonacci retracements by hand means picking two points and re-dragging them every time the market prints a new swing. Auto Fib Retracement removes that chore: it finds the most recent price leg on its own and projects the Fibonacci grid over it automatically, redrawing as the structure evolves. The leg is located with a ZigZag, and the levels — 0%, 23.6%, 38.2%, 50%, 61.8%, 70.5%, 78.6% and 100% — are painted straight onto the chart as horizontal lines with their price tags.
Theory Behind the Indicator
1. Locating the last swing with a ZigZag
A Fibonacci retracement is only as good as the two anchor points it is stretched between. The indicator picks those points with a ZigZag built on a Donchian rule:
ph = (high = highest[depth](high)) // this bar is the highest of the last `depth` bars
pl = (low = lowest[depth](low)) // this bar is the lowest of the last `depth` bars
A small state machine keeps a running direction (dir): while price keeps making new highs the up-leg is extended; when a confirmed low appears the direction flips and a new pivot is stored. Each pivot is kept in two parallel arrays — its price ($zigzag[]) and its bar index ($zigzagidx[]) — so the indicator always knows where the last leg starts and ends. The depth parameter is the single knob that controls sensitivity: a small window tracks minor swings, a large one only reacts to major structure.
2. From the leg to the levels
Once the last two pivots are known, the retracement is pure arithmetic. Call the most recent pivot the start and the one before it the end (this is the standard convention: 0% sits on the latest extreme, 100% on the origin of the move):
height = endP – startP
level(ratio) = startP + height * ratio
So 0% lands exactly on the last pivot, 100% on the previous one, and every Fibonacci ratio in between falls where you would expect. A reverse switch swaps the two anchors if you prefer 0% on the origin instead. The original’s height = (sign) * abs(start – end) collapses algebraically to endP – startP, so the port uses the shorter form with identical results.
3. Drawing the grid
Each active level is drawn as a horizontal drawsegment from the start of the leg to the current bar, so the grid extends to the right edge and stays glued to live price. The drawing runs only on the last bar (islastbarupdate plus drawonlastbaronly), which is the ProBuilder idiom for “draw this once, against the latest data, without stacking copies on every historical bar”. Each line carries an optional label with its percentage and the exact price, rendered with drawtext.
How to Read the Indicator
- The grid frames the current pullback. After an impulse, price retracing into the 38.2%–61.8% zone is the classic “buy the dip / sell the rally” pocket; a retracement that stalls there and turns is the textbook continuation setup.
- 61.8% and 70.5% are the line in the sand. These two thicker lines mark the deeper retracement band. Holding above them (in an up-leg) keeps the prior move’s structure intact; slicing cleanly through them warns that the swing is being fully unwound rather than merely retraced.
- 0% and 100% are the swing itself. The two black boundary lines are the raw high and low of the detected leg — useful as the most recent structural support/resistance even if you ignore the inner ratios.
- The grid re-anchors automatically. When a new swing is confirmed, the whole grid jumps to the new leg. A grid that has just re-anchored to a fresh, longer leg is flagging that a new dominant move is in play.
Practical Applications
- Pullback entries. Use the 38.2%–61.8% band as a dynamic entry zone in the direction of the last leg, with the 78.6%/100% line as the invalidation level for the trade idea.
- Structural stops and targets. The 0% and 100% lines are the last swing’s extremes — natural places to anchor a stop or to project the next target once a level breaks.
- Confluence filter. Overlay the auto-grid on a higher-timeframe level or a moving average; trade only where a Fibonacci level lines up with independent support/resistance.
- Discretionary structure read. Because the grid re-anchors on its own, it is a low-effort way to keep the most relevant retracement on screen at all times while you focus on price action.
Indicator Configuration
- depth (default 20): the ZigZag window, equivalent to the original’s Depth. Lower it (10–15) on intraday charts to track shorter swings; raise it (30+) on daily/weekly charts for major structure only.
- reverse (default 0): swaps the 0% and 100% anchors.
- showLabels (default 1): toggles the percentage + price tags.
Code
//PRC_Auto Fib Retracement custom lines [AleksinAleksandar]
//version = 1
//22.06.2026
//Ivan Gonzalez @ www.prorealcode.com

DEFPARAM drawonlastbaronly = true

//--- Parametros ---
depth      = 20   // ventana de barras del ZigZag (Pine "Depth")
reverse    = 0    // 0 = 0% en el ultimo extremo; 1 = invertido
showLabels = 1

//--- ZigZag: pivotes Donchian ---
ph = (high = highest[depth](high))
pl = (low  = lowest[depth](low))

if ph and not pl then
   dir = 1
elsif pl and not ph then
   dir = -1
else
   dir = dir
endif
dirchanged = dir <> dir[1]

if ph or pl then
   if dirchanged then
      if dir = 1 then
         $zigzag[t+1]    = highest[depth](high)
         $zigzagidx[t+1] = barindex
         t = t + 1
      elsif dir = -1 then
         $zigzag[t+1]    = lowest[depth](low)
         $zigzagidx[t+1] = barindex
         t = t + 1
      endif
   else
      if dir = 1 and highest[depth](high) > $zigzag[t] then
         $zigzag[t]    = highest[depth](high)
         $zigzagidx[t] = barindex
      elsif dir = -1 and lowest[depth](low) < $zigzag[t] then
         $zigzag[t]    = lowest[depth](low)
         $zigzagidx[t] = barindex
      endif
   endif
endif

//--- Dibujo Fibonacci del ultimo tramo ---
if islastbarupdate and t >= 2 then
   $zigzag[0] = undefined

   if reverse then
      startP = $zigzag[t-1]
      endP   = $zigzag[t]
   else
      startP = $zigzag[t]
      endP   = $zigzag[t-1]
   endif
   height = endP - startP

   x1 = $zigzagidx[t-1]
   x2 = barindex

   r = startP
   drawsegment(x1, r, x2, r) coloured(0,0,0) style(line,4)
   if showLabels then
      drawtext("0% (#r#)", x2+15, r) coloured(0,0,0)
   endif

   r = startP + height * 0.382
   drawsegment(x1, r, x2, r) coloured(255,174,0) style(line,1)
   if showLabels then
      drawtext("38.2% (#r#)", x2+15, r) coloured(255,174,0)
   endif

   r = startP + height * 0.5
   drawsegment(x1, r, x2, r) coloured(255,200,0) style(line,1)
   if showLabels then
      drawtext("50% (#r#)", x2+15, r) coloured(255,200,0)
   endif

   r = startP + height * 0.618
   drawsegment(x1, r, x2, r) coloured(0,200,200) style(line,3)
   if showLabels then
      drawtext("61.8% (#r#)", x2+15, r) coloured(0,200,200)
   endif

   r = startP + height * 0.705
   drawsegment(x1, r, x2, r) coloured(0,150,136) style(line,3)
   if showLabels then
      drawtext("70.5% (#r#)", x2+15, r) coloured(0,150,136)
   endif

   r = startP + height
   drawsegment(x1, r, x2, r) coloured(0,0,0) style(line,4)
   if showLabels then
      drawtext("100% (#r#)", x2+15, r) coloured(0,0,0)
   endif

endif

return
