RSI Core Levels Heatmap
Introduction
An oscillator tells you when momentum turns. It does not tell you where. You read a bullish cross on the RSI, you look back at the chart, and you still have to decide which price on that chart the market is likely to defend.
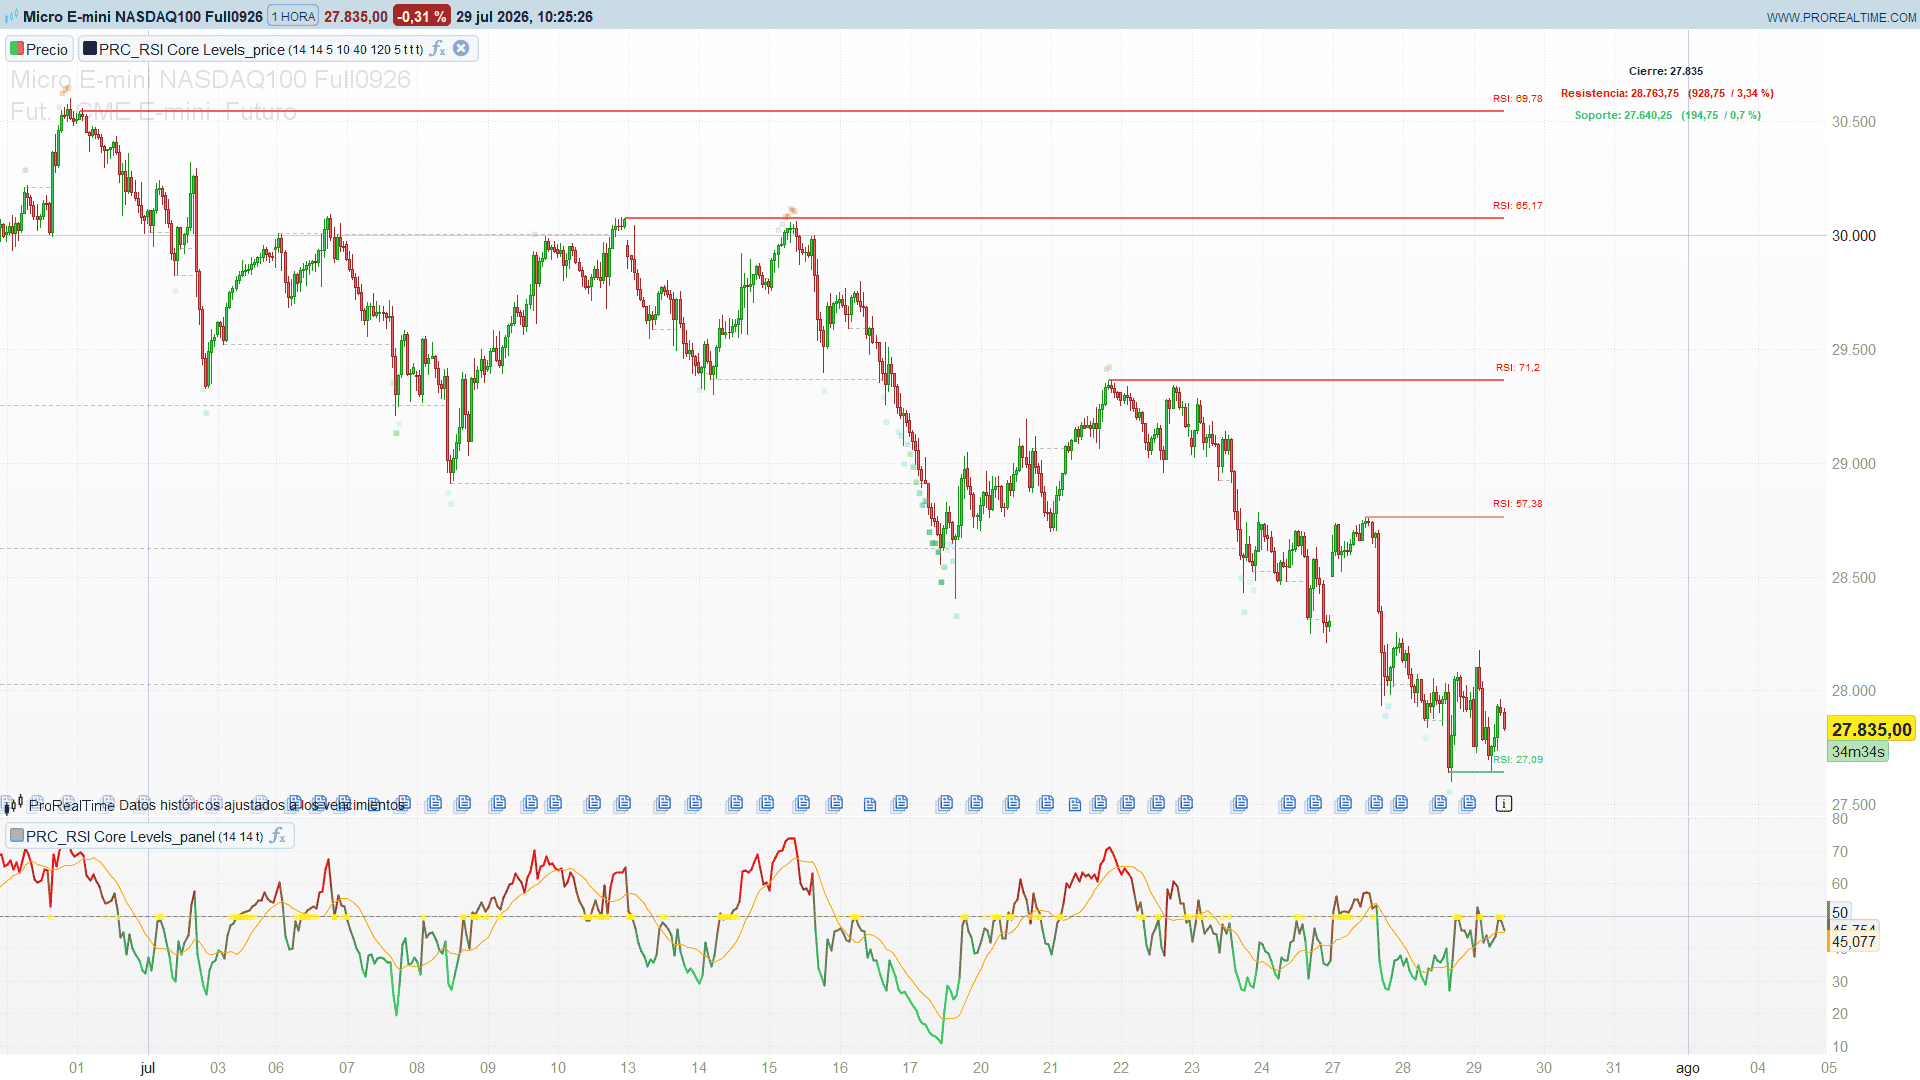
This indicator closes that gap. Every time the RSI crosses its own signal line — and only when the cross happens in the half of the scale that makes it meaningful — it walks back through the last few candles, finds the last one that went the other way, and pins a horizontal level to it. That level then lives on the chart, extending to the right, until price closes through it. When it breaks, it does not vanish: it turns grey and dotted and stays where it died, so the chart keeps a record of every level the market has already resolved.
Alongside it sits a panel version of the RSI with a heat track: three rows of squares at fixed heights that light up with more or less opacity depending on how extreme the reading is. That part is pure reading comfort. The levels are where the information is.
Both are price overlays and oscillator panels respectively, and they work on any instrument and timeframe.
The Trigger: A Crossover That Only Counts in the Right Half
The event that creates a level is a plain crossover between the RSI and a simple moving average of the RSI itself:
bullish event  =  RSI crosses above its signal line   AND  RSI < 50
bearish event  =  RSI crosses below its signal line   AND  RSI > 50
The filter on 50 is the whole point. A bullish cross that happens with the RSI already at 70 is momentum accelerating inside an existing move — there is nothing to mark. A bullish cross with the RSI at 32 is a turn from weakness, and that is the kind of turn that leaves a footprint on the chart worth remembering. The same logic mirrored on the other side.
The default lengths are 14 for the RSI and 14 for its signal line. A shorter signal line gives more crossings and therefore more levels; a longer one gives fewer and cleaner ones.
From a Momentum Event to a Price Level
Here is the part that makes this different from a generic support-and-resistance tool. The level is not placed at the bar where the crossover happened. When the event fires, the indicator scans backwards up to ten bars looking for the first candle of the opposite colour to the move it expects:
Bullish event: looks for the first down candle (close < open) from its low to its open. It draws the low — a support
Bearish event: looks for the first up candle (close > open) from its open to its high. It draws the high — a resistance
This is order-block reasoning applied to a momentum signal. If the RSI has just turned up from a weak reading, the interesting price is not where the oscillator crossed — it is where the last seller was active before the turn. That candle’s low is the level that gets tested if price comes back.
The scan stops at the first matching candle, whether or not the level ends up being drawn. It does not keep searching for a better one.
Why Some Levels Are Never Drawn
Before creating a level, the indicator checks the zone of the anchor candle — the full band between its low and its open, or its open and its high — against the zone of every level currently alive. If the two bands intersect in any way, the new level is discarded.
Without that test, an RSI oscillating around its signal line in a range would stack six or seven lines within a few ticks of each other, and the chart would be unreadable. With it, a zone that has already been marked stays marked with a single line until that line is resolved.
Note what this implies: a level that has already been broken no longer blocks anything. Once price closes through it, it stops counting for the overlap test, and the area is free to be marked again by the next event. Zones do not get permanently locked.
The Life Cycle Is the Indicator
Each bar, every live level is checked:
bullish level broken  when  close < its low
bearish level broken  when  close > its high
If it survives, its right end is pushed forward to the current bar and it keeps its colour and its RSI: xx.xx label — the reading of the oscillator at the anchor candle, which tells you how extreme the momentum was when that level was created.
If it breaks, three things happen at once: the label disappears, the line freezes at the breaking bar in grey dotted style, and the level stops being tracked. Those grey traces are what fill the historical part of the chart. They are not clutter — they are the record of which levels the market actually resolved, and where.
Only the five most recent live levels are drawn, so the right-hand side of the chart stays legible no matter how long the history is.
The Heatmap Panel
The companion panel plots the RSI with a colour that interpolates from green at 30 to red at 70, its orange signal line, and the 50 midline. On top of that, three tracks of squares:
- 95 — lights up when the RSI is at or above 70, gaining opacity as it approaches 100.
- 5 — lights up at or below 30, at full opacity near zero and fading out as it climbs back to 30.
- 50 — the compression track: visible only between 45 and 55, brightest exactly at 50.
That middle track is the one worth watching. A long run of solid yellow squares means the RSI is pinned to its own midline, which is what a market with no momentum in either direction looks like from the inside. It is the oscillator equivalent of a volatility squeeze.
The same overbought and oversold squares are also drawn above and below the candles on the price chart, so you can read the extremes without moving your eyes to the panel.
Two Indicators, Not One
The indicator is split into two files that share nothing but their inputs.
PRC_RSI Core Levels Heatmap— the levels, the labels, the extreme squares and the nearest-level panel. Load it with “on price” selected in the editor.PRC_RSI Core Levels Heatmap Panel— the oscillator and the three heat tracks. Load it with “new panel” selected.
Each file computes its own RSI, so you can use one without the other.
The ProBuilder Code — Levels on the Price Chart
Select “on price” in the editor.
//----------------------------------------------------------------------//
//PRC_RSI Core Levels Heatmap [BigBeluga] - niveles sobre el precio
//version = 0
//29.07.26
//Ivan Gonzalez @ www.prorealcode.com
//Sharing ProRealTime knowledge
//----------------------------------------------------------------------//
//-----Ajustes----------------------------------------------------------//
rsiLength   = 14   //RSI Length
sigLength   = 14   //Signal Line Length
maxActive   = 5    //Max Active Levels & Labels (niveles vivos dibujados)
scanBack    = 10   //Barras hacia atras buscando la vela ancla
maxAlive    = 40   //Tope de niveles vivos en memoria
maxBroken   = 120  //Tope de niveles rotos guardados (rastro gris)
extRight    = 5    //Barras de extension de la etiqueta a la derecha
showBroken  = 1    //1 = rastro gris de los niveles ya rotos
showSquares = 1    //1 = cuadrados de sobrecompra/sobreventa sobre las velas
showPanel   = 1    //1 = panel de niveles mas cercanos (esquina sup. derecha)
//-----Colores base (Bullish / Bearish)---------------------------------//
bullR = 4
bullG = 195
bullB = 112
bearR = 255
bearG = 0
bearB = 0
panelR = 60        //color del texto neutro del panel (fondo claro)
panelG = 60
panelB = 60
//----------------------------------------------------------------------//
rsiV   = rsi[rsiLength](close)
sigV   = average[sigLength](rsiV)
atrV   = averagetruerange[14](close)
warmup = rsiLength + sigLength + scanBack + 3


//-----Semilla del estado global----------------------------------------//
//Todo el estado persistente vive en arrays: los escalares se rebobinan
//en cada tick y los arrays no (trampa 26 / learning 184)
IF barindex = 0 THEN
   $gS[0] = 0 - 1   //ultima barra procesada
   $gS[1] = 0       //nº de niveles vivos
   $gS[2] = 0       //nº de niveles rotos guardados
ENDIF


//----------------------------------------------------------------------//
//MOTOR: una sola pasada por barra, siempre sobre la barra CERRADA
//----------------------------------------------------------------------//
IF barindex > warmup AND barindex > $gS[0] THEN
   $gS[0] = barindex
   nAl = $gS[1]
   nBk = $gS[2]


   rsiC = rsiV[1]
   rsiP = rsiV[2]
   sigC = sigV[1]
   sigP = sigV[2]
   cls  = close[1]


   //-----1. ruptura de los niveles vivos + extension a la derecha------//
   FOR k = 1 TO nAl DO
      brk = 0
      IF $lvBull[k] = 1 THEN
         IF cls < $lvBot[k] THEN
            brk = 1
         ENDIF
      ELSE
         IF cls > $lvTop[k] THEN
            brk = 1
         ENDIF
      ENDIF
      IF brk = 1 THEN
         $lvAlive[k] = 0
         IF showBroken = 1 THEN
            IF nBk >= maxBroken THEN
               FOR m = 1 TO nBk - 1 DO
                  $bkX1[m] = $bkX1[m+1]
                  $bkX2[m] = $bkX2[m+1]
                  $bkPx[m] = $bkPx[m+1]
               NEXT
               nBk = nBk - 1
            ENDIF
            nBk = nBk + 1
            $bkX1[nBk] = $lvX1[k]
            $bkX2[nBk] = barindex - 1
            $bkPx[nBk] = $lvPx[k]
         ENDIF
      ELSE
         $lvX2[k] = barindex
      ENDIF
   NEXT


   //-----2. compactar los vivos (quita los rotos, conserva el orden)---//
   w = 0
   FOR k = 1 TO nAl DO
      IF $lvAlive[k] = 1 THEN
         w = w + 1
         $lvTop[w]   = $lvTop[k]
         $lvBot[w]   = $lvBot[k]
         $lvPx[w]    = $lvPx[k]
         $lvBull[w]  = $lvBull[k]
         $lvX1[w]    = $lvX1[k]
         $lvX2[w]    = $lvX2[k]
         $lvRsi[w]   = $lvRsi[k]
         $lvAlive[w] = 1
      ENDIF
   NEXT
   nAl = w


   //-----3. cruces del RSI con su linea de senal-----------------------//
   bullBlock = 0
   bearBlock = 0
   IF rsiC > sigC AND rsiP <= sigP AND rsiC < 50 THEN
      bullBlock = 1
   ENDIF
   IF rsiC < sigC AND rsiP >= sigP AND rsiC > 50 THEN
      bearBlock = 1
   ENDIF


   //-----4. nacimiento del nivel: primera vela contraria en scanBack---//
   IF bullBlock = 1 OR bearBlock = 1 THEN
      fnd = 0
      FOR i = 0 TO scanBack DO
         IF fnd = 0 THEN
            hitBar = 0
            IF bullBlock = 1 AND close[i+1] < open[i+1] THEN
               hitBar  = 1
               boxTop  = open[i+1]
               boxBot  = low[i+1]
               newBull = 1
            ENDIF
            IF bearBlock = 1 AND close[i+1] > open[i+1] THEN
               hitBar  = 1
               boxTop  = high[i+1]
               boxBot  = open[i+1]
               newBull = 0
            ENDIF
            IF hitBar = 1 THEN
               fnd = 1
               //solape estricto contra las bandas de los niveles vivos
               ovl = 0
               FOR k = 1 TO nAl DO
                  IF boxTop <= $lvTop[k] AND boxTop >= $lvBot[k] THEN
                     ovl = 1
                  ENDIF
                  IF boxBot >= $lvBot[k] AND boxBot <= $lvTop[k] THEN
                     ovl = 1
                  ENDIF
                  IF boxTop >= $lvTop[k] AND boxBot <= $lvBot[k] THEN
                     ovl = 1
                  ENDIF
               NEXT
               IF ovl = 0 THEN
                  IF nAl >= maxAlive THEN
                     FOR m = 1 TO nAl - 1 DO
                        $lvTop[m]   = $lvTop[m+1]
                        $lvBot[m]   = $lvBot[m+1]
                        $lvPx[m]    = $lvPx[m+1]
                        $lvBull[m]  = $lvBull[m+1]
                        $lvX1[m]    = $lvX1[m+1]
                        $lvX2[m]    = $lvX2[m+1]
                        $lvRsi[m]   = $lvRsi[m+1]
                        $lvAlive[m] = $lvAlive[m+1]
                     NEXT
                     nAl = nAl - 1
                  ENDIF
                  nAl = nAl + 1
                  $lvTop[nAl]  = boxTop
                  $lvBot[nAl]  = boxBot
                  $lvBull[nAl] = newBull
                  IF newBull = 1 THEN
                     $lvPx[nAl] = boxBot
                  ELSE
                     $lvPx[nAl] = boxTop
                  ENDIF
                  $lvX1[nAl]    = barindex - 1 - i
                  $lvX2[nAl]    = barindex
                  $lvRsi[nAl]   = rsiV[i+1]
                  $lvAlive[nAl] = 1
               ENDIF
            ENDIF
         ENDIF
      NEXT
   ENDIF


   $gS[1] = nAl
   $gS[2] = nBk
ENDIF


//----------------------------------------------------------------------//
//CUADRADOS DE EXTREMO SOBRE LAS VELAS (evento por barra, X fija)
//----------------------------------------------------------------------//
IF showSquares = 1 AND barindex > warmup THEN
   IF rsiV >= 70 THEN
      tOB = (rsiV - 70) / 30
      tOB = max(0, min(1, tOB))
      aOB = round(26 + 229 * tOB)
      DRAWTEXT("■", barindex, high + 0.6 * atrV, sansserif, standard, 8) COLOURED(bearR, bearG, bearB, aOB)
   ENDIF
   IF rsiV <= 30 THEN
      tOS = rsiV / 30
      tOS = max(0, min(1, tOS))
      aOS = round(255 - 229 * tOS)
      DRAWTEXT("■", barindex, low - 0.6 * atrV, sansserif, standard, 8) COLOURED(bullR, bullG, bullB, aOS)
   ENDIF
ENDIF


//----------------------------------------------------------------------//
//DIBUJO DE NIVELES Y PANEL (solo en la ultima barra)
//----------------------------------------------------------------------//
IF islastbarupdate THEN
   nA2 = $gS[1]
   nB2 = $gS[2]


   //-----rastro gris de los niveles ya rotos---------------------------//
   IF showBroken = 1 THEN
      FOR k = 1 TO nB2 DO
         DRAWSEGMENT($bkX1[k], $bkPx[k], $bkX2[k], $bkPx[k]) COLOURED(128, 128, 128, 120) STYLE(dottedline, 1)
      NEXT
   ENDIF


   //-----niveles vivos: solo los maxActive mas recientes---------------//
   kFrom = 1
   IF nA2 > maxActive THEN
      kFrom = nA2 - maxActive + 1
   ENDIF
   FOR k = kFrom TO nA2 DO
      lvR = $lvRsi[k]
      IF $lvBull[k] = 1 THEN
         tg  = (lvR - 15) / 35
         tg  = max(0, min(1, tg))
         aLv = round(255 - 204 * tg)
         cR  = bullR
         cG  = bullG
         cB  = bullB
      ELSE
         tg  = (lvR - 50) / 35
         tg  = max(0, min(1, tg))
         aLv = round(51 + 204 * tg)
         cR  = bearR
         cG  = bearG
         cB  = bearB
      ENDIF
      DRAWSEGMENT($lvX1[k], $lvPx[k], $lvX2[k], $lvPx[k]) COLOURED(cR, cG, cB, aLv) STYLE(line, 2)
      rTxt = round(lvR * 100) / 100
      DRAWTEXT("RSI: #rTxt#", $lvX2[k] + extRight, $lvPx[k], sansserif, standard, 10) COLOURED(cR, cG, cB, 255)
   NEXT


   //-----panel de niveles mas cercanos---------------------------------//
   IF showPanel = 1 THEN
      hasR  = 0
      hasS  = 0
      bestR = 0
      bestS = 0
      FOR k = 1 TO nA2 DO
         IF $lvBull[k] = 0 AND $lvPx[k] >= close THEN
            IF hasR = 0 THEN
               bestR = $lvPx[k]
               hasR  = 1
            ELSIF $lvPx[k] - close < bestR - close THEN
               bestR = $lvPx[k]
            ENDIF
         ENDIF
         IF $lvBull[k] = 1 AND $lvPx[k] <= close THEN
            IF hasS = 0 THEN
               bestS = $lvPx[k]
               hasS  = 1
            ELSIF close - $lvPx[k] < close - bestS THEN
               bestS = $lvPx[k]
            ENDIF
         ENDIF
      NEXT


      pX    = 0 - 250
      pY    = 0 - 40
      cNow  = round(close * 100) / 100
      DRAWTEXT("Cierre: #cNow#", pX, pY, sansserif, bold, 11) COLOURED(panelR, panelG, panelB, 255) ANCHOR(TOPRIGHT, XSHIFT, YSHIFT)


      IF hasR = 1 THEN
         vR = round(bestR * 100) / 100
         dR = round((bestR - close) * 100) / 100
         pR = round((bestR - close) / close * 10000) / 100
         DRAWTEXT("Resistencia: #vR#  (#dR# / #pR#%)", pX, pY - 22, sansserif, bold, 11) COLOURED(bearR, bearG, bearB, 255) ANCHOR(TOPRIGHT, XSHIFT, YSHIFT)
      ELSE
         DRAWTEXT("Resistencia: ninguna activa", pX, pY - 22, sansserif, bold, 11) COLOURED(bearR, bearG, bearB, 255) ANCHOR(TOPRIGHT, XSHIFT, YSHIFT)
      ENDIF


      IF hasS = 1 THEN
         vS = round(bestS * 100) / 100
         dS = round((close - bestS) * 100) / 100
         pS = round((close - bestS) / close * 10000) / 100
         DRAWTEXT("Soporte: #vS#  (#dS# / #pS#%)", pX, pY - 44, sansserif, bold, 11) COLOURED(bullR, bullG, bullB, 255) ANCHOR(TOPRIGHT, XSHIFT, YSHIFT)
      ELSE
         DRAWTEXT("Soporte: ninguno activo", pX, pY - 44, sansserif, bold, 11) COLOURED(bullR, bullG, bullB, 255) ANCHOR(TOPRIGHT, XSHIFT, YSHIFT)
      ENDIF
   ENDIF
ENDIF


RETURN
The ProBuilder Code — Oscillator and Heat Tracks
Select “new panel” in the editor.
//----------------------------------------------------------------------//
//PRC_RSI Core Levels Heatmap [BigBeluga] - oscilador + heatmap (panel)
//version = 0
//29.07.26
//Ivan Gonzalez @ www.prorealcode.com
//Sharing ProRealTime knowledge
//Indicador de PANEL: marcar "nuevo panel" en el editor
//----------------------------------------------------------------------//
//-----Ajustes----------------------------------------------------------//
rsiLength  = 14   //RSI Length
sigLength  = 14   //Signal Line Length
showMidZone = 1   //1 = pista de compresion alrededor del 50
//-----Colores base-----------------------------------------------------//
bullR = 4         //Bullish Base Color
bullG = 195
bullB = 112
bearR = 255       //Bearish Base Color
bearG = 0
bearB = 0
sigR  = 255       //Signal Line Color (naranja)
sigG  = 165
sigB  = 0
midR  = 255       //Midline Zone Color (amarillo)
midG  = 255
midB  = 0
//----------------------------------------------------------------------//
rsiV = rsi[rsiLength](close)
sigV = average[sigLength](rsiV)


//-----Color degradado de la linea del RSI (30 verde -> 70 rojo)--------//
tc = (rsiV - 30) / 40
tc = max(0, min(1, tc))
rr = round(bullR + (bearR - bullR) * tc)
gg = round(bullG + (bearG - bullG) * tc)
bb = round(bullB + (bearB - bullB) * tc)


//-----Pistas del heatmap (cuadrados a 95 / 50 / 5)---------------------//
IF barindex > rsiLength + sigLength THEN


   //sobrecompra: se enciende en 70 y gana opacidad hasta 100
   IF rsiV >= 70 THEN
      tOB = (rsiV - 70) / 30
      tOB = max(0, min(1, tOB))
      aOB = round(26 + 229 * tOB)
      DRAWTEXT("■", barindex, 95, sansserif, standard, 8) COLOURED(bearR, bearG, bearB, aOB)
   ENDIF


   //sobreventa: opacidad maxima en 0, se apaga al llegar a 30
   IF rsiV <= 30 THEN
      tOS = rsiV / 30
      tOS = max(0, min(1, tOS))
      aOS = round(255 - 229 * tOS)
      DRAWTEXT("■", barindex, 5, sansserif, standard, 8) COLOURED(bullR, bullG, bullB, aOS)
   ENDIF


   //compresion: activa entre 40 y 60, pero solo visible entre 45 y 55
   IF showMidZone = 1 AND rsiV >= 40 AND rsiV <= 60 THEN
      IF rsiV < 50 THEN
         tSq = (rsiV - 45) / 5
      ELSE
         tSq = (55 - rsiV) / 5
      ENDIF
      tSq = max(0, min(1, tSq))
      aSq = round(255 * tSq)
      DRAWTEXT("■", barindex, 50, sansserif, standard, 8) COLOURED(midR, midG, midB, aSq)
   ENDIF


ENDIF


RETURN rsiV AS "RSI" COLOURED(rr, gg, bb) STYLE(line, 2), sigV AS "Signal" COLOURED(sigR, sigG, sigB) STYLE(line, 1), 50 AS "Middle" COLOURED(128, 128, 128) STYLE(dottedline)
![[SMC] Clean Liquidity Heatmap](https://www.prorealcode.com/wp-content/uploads/2026/03/TSLA-Diario-3-150x150.png)