

Wolf Trace SMC Key Levels
Introduction
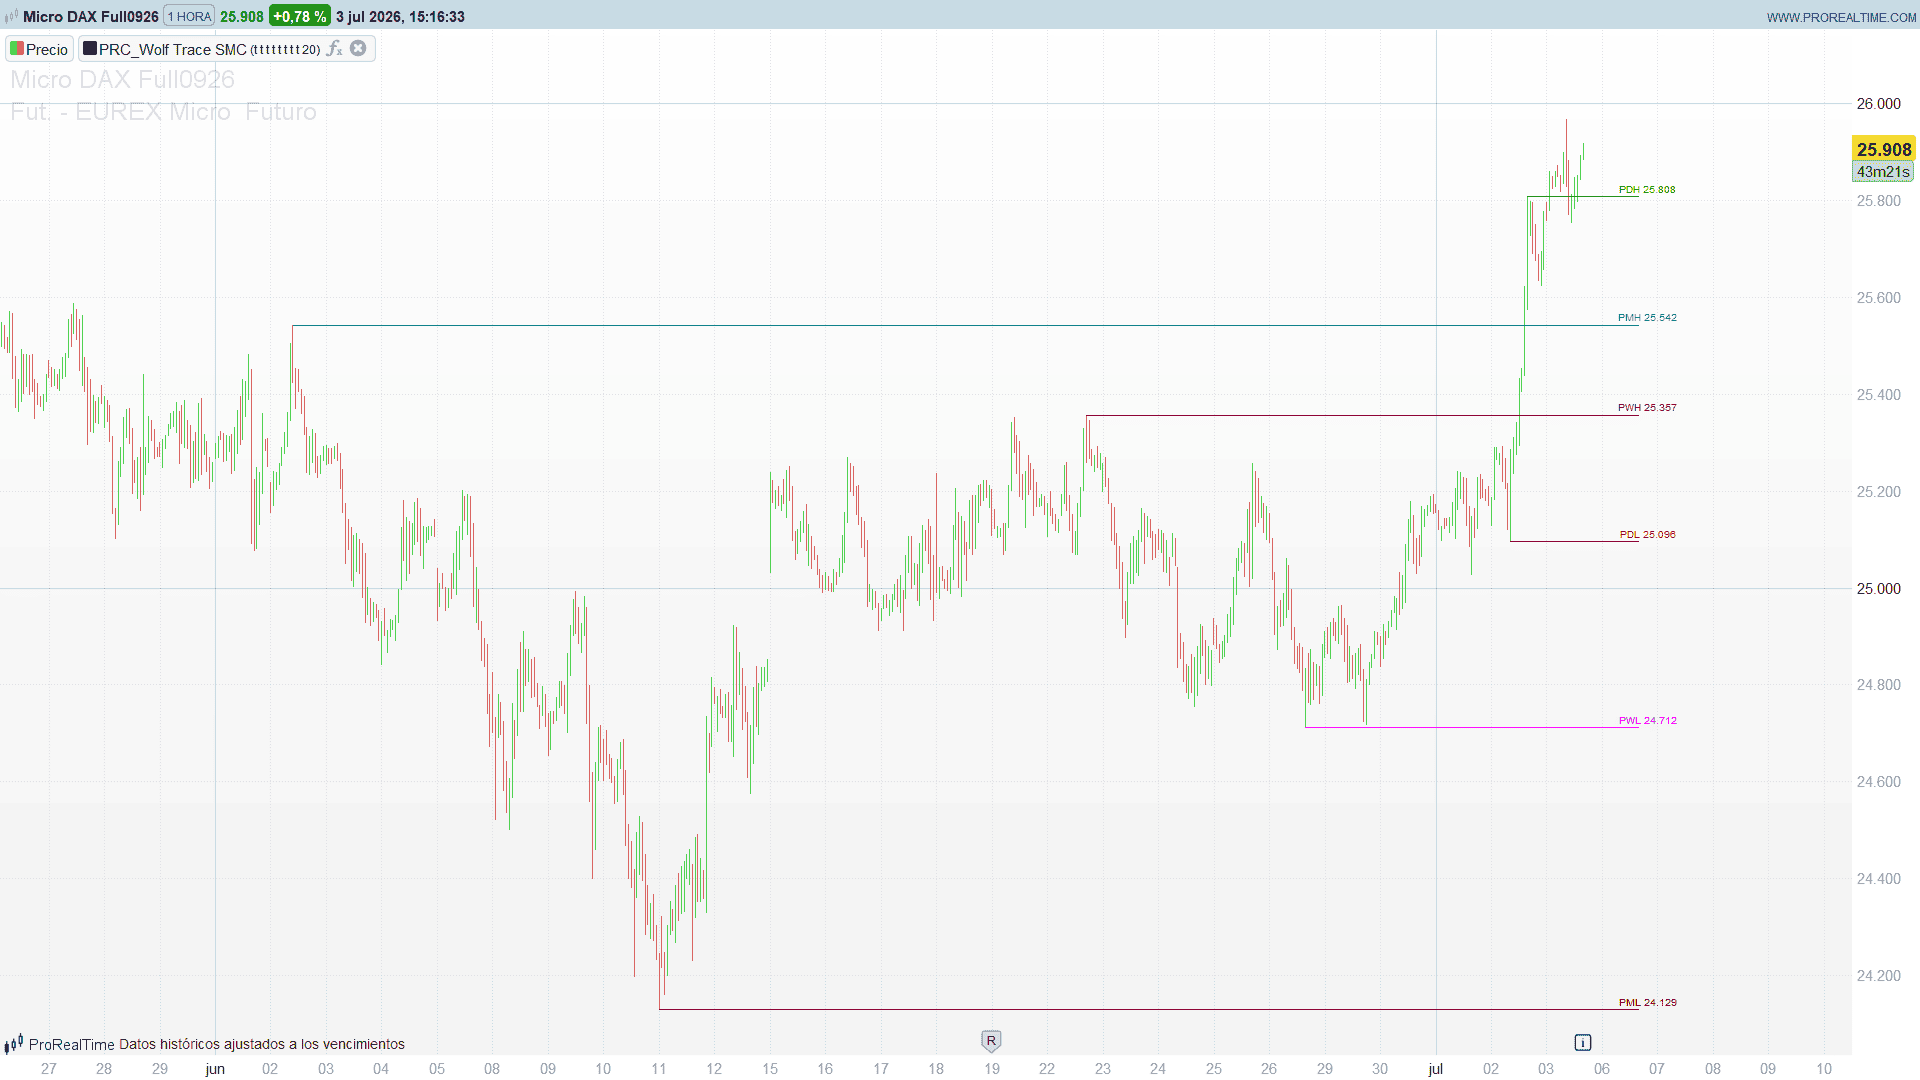
Ask any Smart Money Concepts trader what the most important levels on their chart are and you will get the same six answers: the high and low of the previous day (PDH/PDL), of the previous week (PWH/PWL) and of the previous month (PMH/PML). Wolf Trace SMC Key Levels, by YS_TRADING_CIRCLE, plots exactly those six levels — but with a detail most implementations get wrong: each line does not start at the beginning of its period. It starts at the exact bar where the extreme was printed.
That anchoring choice is not cosmetic. In the SMC framework a prior high is not a line, it is an event: the moment where buying pressure failed and a pool of liquidity (stops of shorts, breakout orders of longs) was left behind. Drawing the level from its origin bar tells you at a glance where and how long ago that liquidity was created, and how far price has travelled away from it since.
Theory Behind the Indicator
Key levels as liquidity pools
Previous-period extremes are the most watched reference prices in intraday and swing trading. Above a prior high rest the stop-losses of sellers and the entry stops of breakout buyers; below a prior low, the mirror image. Smart Money Concepts reads sweeps of these levels — the quick run above PDH that immediately reverses — as liquidity grabs, and holds of these levels as genuine acceptance. Either way, the level itself is the map reference everything else hangs on.
The indicator maintains three pairs of levels simultaneously:
- PDH / PDL — high and low of the previous calendar day, computed on a full 24-hour day (FX-style), not on the exchange session.
- PWH / PWL — high and low of the previous week, with the week anchored to Monday. A Sunday session belongs to the week that is ending, and a Monday holiday simply rolls the boundary to the first bar of Tuesday.
- PMH / PML — high and low of the previous calendar month; a year change is handled naturally.
Anchoring at the origin of the extreme
While a period is running, the indicator tracks not only its running high and low but also the bar index where each extreme was made. When the period closes, the completed values freeze and become the “previous” levels, each carrying its origin bar with it. The segment is then drawn from that origin bar to a configurable number of bars beyond the last candle, with a small label at the right end (level name, optionally with its price).
Two practical consequences of this design:
- A PDH made in the first minutes of yesterday’s session paints a long line across your chart; a PDH made at yesterday’s close paints a short one. The length of the line is information — it is the age of the level.
- Because the levels only update when a period completes, nothing repaints intra-period: the six lines are stable references all through the current day, week and month.
How to Read the Indicator
- Green / red lines (PDH / PDL) frame the previous day. They are the primary intraday magnets: most days interact with at least one of them.
- Purple / fuchsia lines (PWH / PWL) frame the previous week — the swing trader’s reference and the intraday trader’s higher-timeframe context.
- Teal / maroon lines (PMH / PML) frame the previous month. Price approaching a monthly extreme is where positional players start paying attention.
- A sweep — price piercing a level and closing back inside — flags a liquidity grab and a potential reversal zone, especially when a lower-timeframe shift in structure confirms it.
- A clean break and hold beyond a level converts it into support/resistance for the session; the origin anchor shows you how mature the level that just broke was.
- Confluence matters most: when PDH sits a few ticks below PWH, or PDL coincides with PML, the shared zone concentrates far more resting liquidity than any single level alone.
Practical Applications
- Session preparation. Before the open, the six lines give you the complete liquidity map for the day: the obvious draw above (PDH, then PWH) and below (PDL, then PWL), and the big monthly brackets.
- Sweep-and-reverse setups. Wait for price to run a previous extreme and reject; the level provides the location, your entry model provides the trigger.
- Breakout filtering. A “breakout” that happens nowhere near a prior-period extreme has taken no meaningful liquidity; one that clears PDH and PWH together has fuel behind it.
- Target selection. Open positions can be managed level-to-level: long from PDL, first objective PDH, extended objective PWH.
- Higher-timeframe bias. Trading above the previous week’s high is a materially different regime from trading below the previous week’s low — a one-glance filter for direction.
Indicator Configuration
showPDH,showPDL,showPWH,showPWL,showPMH,showPML(1/0): toggle each of the six levels independently.showLabels(1/0): draw the name tag at the right end of each line.showPrice(1/0): append the level’s price to the tag (e.g. “PDH 4523.5” instead of “PDH”).extendBars(default 20): how many bars beyond the last candle the lines project. Make sure the free space on the right of your chart is at least this wide (or lower the value) so the labels stay visible.- Colours are defined as RGB literals in each drawing block (green, red, purple, fuchsia, teal, maroon by default) and line style is
style(line, 1); both can be edited directly in the code — ProBuilder does not allow line styles to be driven by variables.
Code
//----------------------------------------------
//PRC_Wolf Trace SMC Key Levels
//Original author: YS_TRADING_CIRCLE
//version = 0
//03.07.2026
//Iván González @ www.prorealcode.com
//Sharing ProRealTime knowledge
//----------------------------------------------
// PDH/PDL - PWH/PWL - PMH/PML: extremos del dia,
// semana y mes anteriores, anclados en la barra
// donde se formo cada extremo
//----------------------------------------------
// === Inputs (exponer como variables del indicador) ===
showPDH = 1      // 1 = high del dia anterior
showPDL = 1      // 1 = low del dia anterior
showPWH = 1      // 1 = high de la semana anterior
showPWL = 1      // 1 = low de la semana anterior
showPMH = 1      // 1 = high del mes anterior
showPML = 1      // 1 = low del mes anterior
showLabels = 1   // 1 = etiqueta al final de cada linea
showPrice = 1    // 1 = precio dentro de la etiqueta
extendBars = 20  // extension a la derecha de la ultima vela
//----------------------------------------------
// === Semillas (primera barra del historico) ===
once curDayHigh = high
once curDayLow = low
once curWeekHigh = high
once curWeekLow = low
once curMonthHigh = high
once curMonthLow = low
//----------------------------------------------
// === Cambio de periodo ===
// dia natural (cambio de fecha del grafico)
newDay = date <> date[1]
// semana anclada al lunes: dias transcurridos desde el lunes (lun=0 ... dom=6)
dsm = dayofweek - 1
if dsm < 0 then
   dsm = 6
endif
newWeek = dsm < dsm[1]
// mes (un cambio de anyo tambien cambia el mes)
newMonth = month <> month[1]
//----------------------------------------------
// === DIA: rollover + tracking del extremo y su barra ===
if newDay then
   pdh = curDayHigh
   pdl = curDayLow
   pdhBar = curDayHighBar
   pdlBar = curDayLowBar
   dayReady = 1
   curDayHigh = high
   curDayLow = low
   curDayHighBar = barindex
   curDayLowBar = barindex
else
   if high > curDayHigh then
      curDayHigh = high
      curDayHighBar = barindex
   endif
   if low < curDayLow then
      curDayLow = low
      curDayLowBar = barindex
   endif
endif
// === SEMANA ===
if newWeek then
   pwh = curWeekHigh
   pwl = curWeekLow
   pwhBar = curWeekHighBar
   pwlBar = curWeekLowBar
   weekReady = 1
   curWeekHigh = high
   curWeekLow = low
   curWeekHighBar = barindex
   curWeekLowBar = barindex
else
   if high > curWeekHigh then
      curWeekHigh = high
      curWeekHighBar = barindex
   endif
   if low < curWeekLow then
      curWeekLow = low
      curWeekLowBar = barindex
   endif
endif
// === MES ===
if newMonth then
   pmh = curMonthHigh
   pml = curMonthLow
   pmhBar = curMonthHighBar
   pmlBar = curMonthLowBar
   monthReady = 1
   curMonthHigh = high
   curMonthLow = low
   curMonthHighBar = barindex
   curMonthLowBar = barindex
else
   if high > curMonthHigh then
      curMonthHigh = high
      curMonthHighBar = barindex
   endif
   if low < curMonthLow then
      curMonthLow = low
      curMonthLowBar = barindex
   endif
endif
//----------------------------------------------
// === Dibujo: 6 lineas vivas + etiquetas, solo en la ultima barra ===
if islastbarupdate then
   atr = averagetruerange[14](close)
   xEnd = barindex + extendBars
   xLbl = xEnd + 4
   // --- PDH (verde) ---
   if showPDH = 1 and dayReady = 1 then
      drawsegment(pdhBar, pdh, xEnd, pdh) coloured(0, 153, 0) style(line, 1)
      if showLabels = 1 then
         if showPrice = 1 then
            drawtext("PDH #pdh#", xLbl, pdh+0.25*atr, SansSerif, Standard, 10) coloured(0, 153, 0)
         else
            drawtext("PDH", xLbl, pdh+0.25*atr, SansSerif, Standard, 10) coloured(0, 153, 0)
         endif
      endif
   endif
   // --- PDL (rojo) ---
   if showPDL = 1 and dayReady = 1 then
      drawsegment(pdlBar, pdl, xEnd, pdl) coloured(255, 0, 0) style(line, 1)
      if showLabels = 1 then
         if showPrice = 1 then
            drawtext("PDL #pdl#", xLbl, pdl+0.25*atr, SansSerif, Standard, 10) coloured(255, 0, 0)
         else
            drawtext("PDL", xLbl, pdl+0.25*atr, SansSerif, Standard, 10) coloured(255, 0, 0)
         endif
      endif
   endif
   // --- PWH (morado) ---
   if showPWH = 1 and weekReady = 1 then
      drawsegment(pwhBar, pwh, xEnd, pwh) coloured(128, 0, 128) style(line, 1)
      if showLabels = 1 then
         if showPrice = 1 then
            drawtext("PWH #pwh#", xLbl, pwh+0.25*atr, SansSerif, Standard, 10) coloured(128, 0, 128)
         else
            drawtext("PWH", xLbl, pwh+0.25*atr, SansSerif, Standard, 10) coloured(128, 0, 128)
         endif
      endif
   endif
   // --- PWL (fucsia) ---
   if showPWL = 1 and weekReady = 1 then
      drawsegment(pwlBar, pwl, xEnd, pwl) coloured(255, 0, 255) style(line, 1)
      if showLabels = 1 then
         if showPrice = 1 then
            drawtext("PWL #pwl#", xLbl, pwl+0.25*atr, SansSerif, Standard, 10) coloured(255, 0, 255)
         else
            drawtext("PWL", xLbl, pwl+0.25*atr, SansSerif, Standard, 10) coloured(255, 0, 255)
         endif
      endif
   endif
   // --- PMH (verde azulado) ---
   if showPMH = 1 and monthReady = 1 then
      drawsegment(pmhBar, pmh, xEnd, pmh) coloured(0, 128, 128) style(line, 1)
      if showLabels = 1 then
         if showPrice = 1 then
            drawtext("PMH #pmh#", xLbl, pmh+0.25*atr, SansSerif, Standard, 10) coloured(0, 128, 128)
         else
            drawtext("PMH", xLbl, pmh+0.25*atr, SansSerif, Standard, 10) coloured(0, 128, 128)
         endif
      endif
   endif
   // --- PML (granate) ---
   if showPML = 1 and monthReady = 1 then
      drawsegment(pmlBar, pml, xEnd, pml) coloured(128, 0, 0) style(line, 1)
      if showLabels = 1 then
         if showPrice = 1 then
            drawtext("PML #pml#", xLbl, pml+0.25*atr, SansSerif, Standard, 10) coloured(128, 0, 0)
         else
            drawtext("PML", xLbl, pml+0.25*atr, SansSerif, Standard, 10) coloured(128, 0, 0)
         endif
      endif
   endif
endif
return
