

Support and Resistance Levels with Breaks
Support and resistance are the most universally watched levels in technical analysis, but drawing them by hand is subjective and slow. The Support and Resistance Levels with Breaks indicator automates the whole job: it detects swing pivots, plots the most recent high pivot as resistance and the most recent low pivot as support, and then flags the exact bar where price breaks through one of them, filtered by a volume surge.
This indicator was originally written in PineScript for TradingView by LuxAlgo, where it is one of the most downloaded support/resistance scripts on the platform. It has been adapted to ProBuilder for ProRealTime as a single self-contained indicator..
How It Works
The indicator combines three simple building blocks:
- Swing pivots: a resistance pivot is a bar whose high is the highest of the surrounding window (leftBars bars to the left, rightBars to the right); a support pivot is the mirror image on the lows. Only the most recent pivot of each type is kept active, so support and resistance are always the latest confirmed swings.
- Volume oscillator: a fast EMA (5) and a slow EMA (10) of volume are compared as a percentage, osc = 100 × (EMA5 − EMA10) / EMA10. A positive, rising oscillator means the current bar is trading on above-average volume — the fuel a genuine break needs.
- Candle geometry: when price crosses a level, the indicator checks whether the candle closed with conviction or left a long rejection wick, and labels the two cases differently.
A break is only marked B (a clean break) when the close crosses the level, the volume oscillator is above the threshold, and the candle is not a rejection wick. If price pierces the level but closes with a dominant wick against the move, it is labelled Bull Wick or Bear Wick instead — a warning that the break may be false.
Reading the Indicator
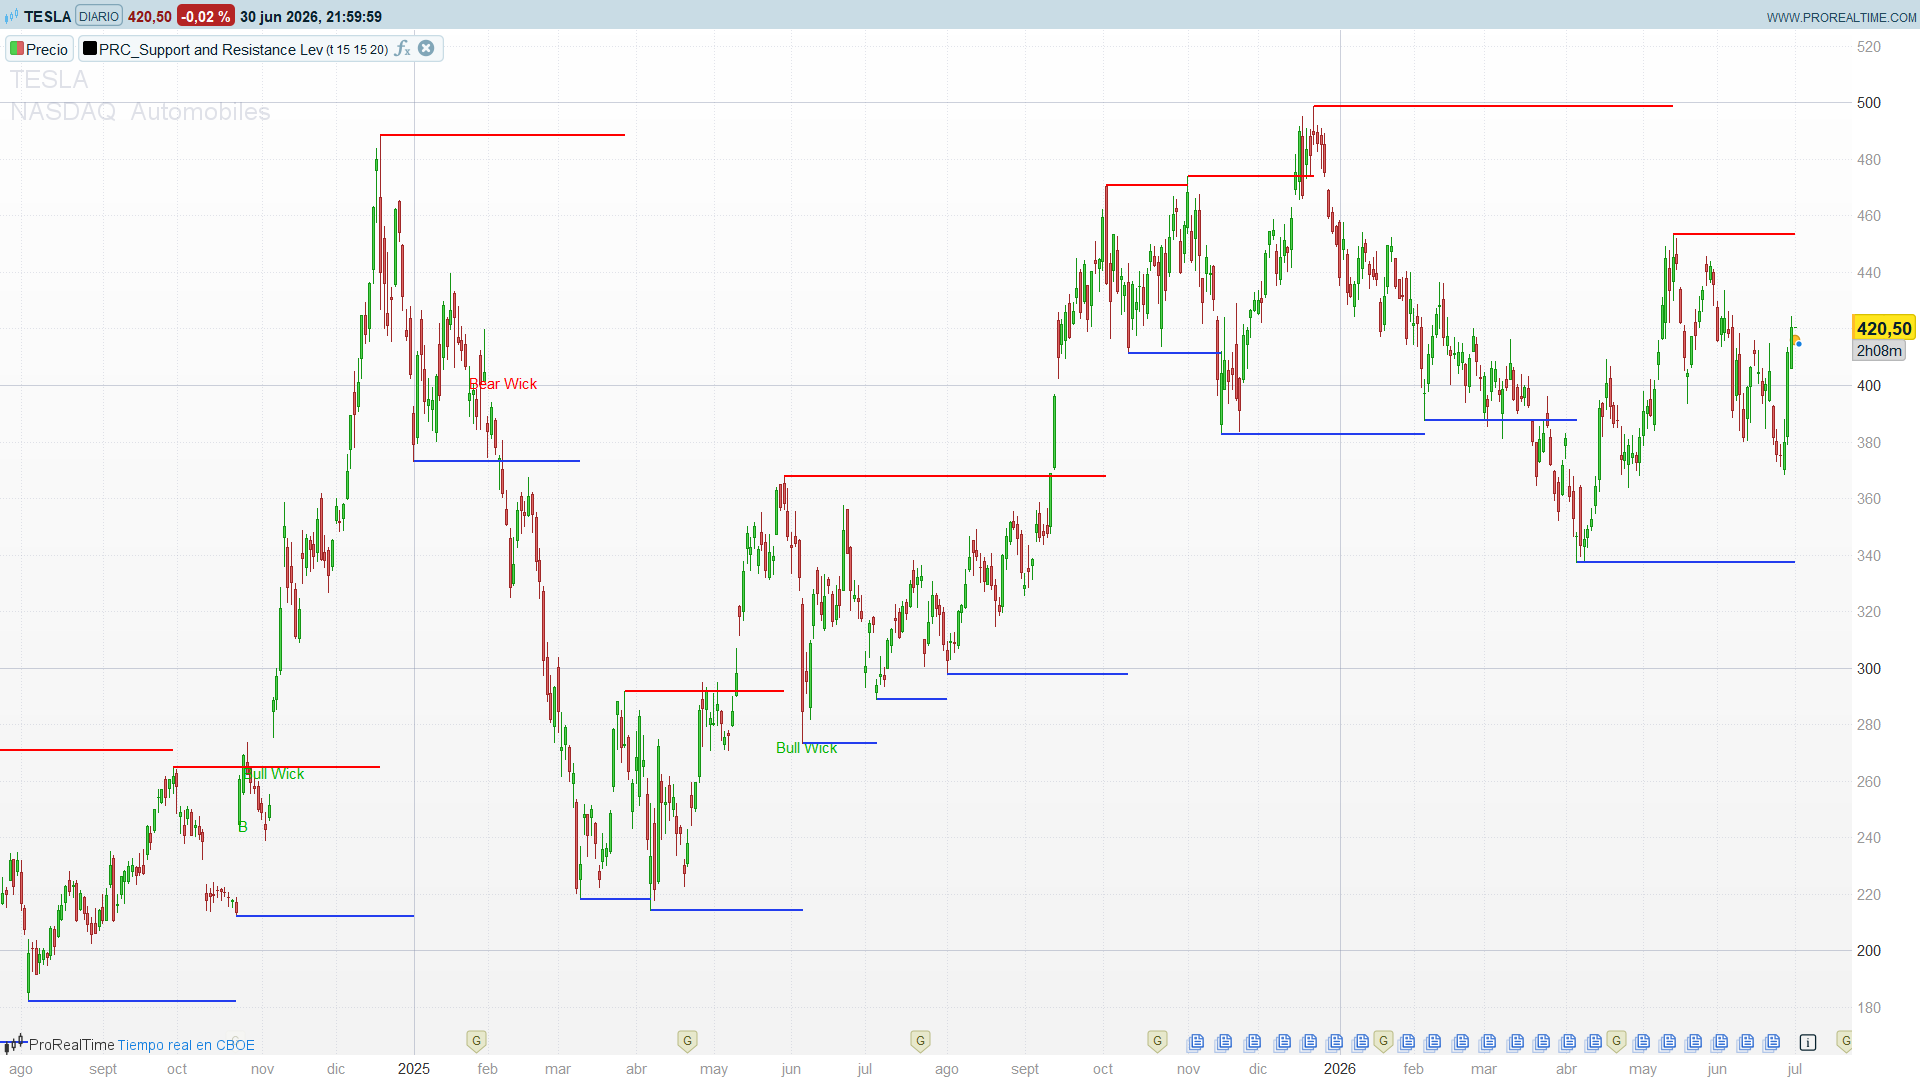
The indicator overlays directly on the price chart:
- Red line: the active resistance, sitting at the most recent pivot high. It stays flat until a new high pivot forms, then steps to the new level.
- Blue line: the active support, at the most recent pivot low, behaving the same way.
- Green B below a bar: a confirmed, volume-backed break above resistance.
- Red B above a bar: a confirmed, volume-backed break below support.
- Bull Wick / Bear Wick: price crossed the level but the candle left a long rejection wick — treat the break with caution.
A level that price keeps respecting reinforces the current structure; the moment a volume-backed B prints, the structure has shifted.
Trading Applications
- Breakout entries: trade the B signal in the direction of the break — long on a green break above resistance, short on a red break below support. The volume filter is there precisely to skip low-conviction breaks.
- Fade the wicks: a Bull Wick or Bear Wick flags a failed push through the level, which momentum traders often fade back toward the level.
- Pullback entries: after a clean break, wait for price to retest the broken level (old resistance as new support, and vice versa) and look for continuation.
- Structure mapping: the stepped support and resistance lines give an instant read of where the market last turned, on any timeframe.
Parameters
- toggleBreaks (default: on): show or hide the break and wick labels.
- leftBars (default: 15): bars to the left required to confirm a pivot. Higher values produce fewer, more significant levels.
- rightBars (default: 15): bars to the right required to confirm a pivot. This is also the confirmation delay — a level appears rightBars bars after its actual pivot.
- volumeThresh (default: 20): minimum value of the volume oscillator for a break to count as clean. Raise it to demand stronger volume; lower it for more signals.
Code
//---------------------------------------------//
// PRC_Support and Resistance Levels with Breaks [LuxAlgo]
// version = 1
// Iván González @ www.prorealcode.com
// Sharing ProRealTime knowledge
//---------------------------------------------//
toggleBreaks = 1
leftBars     = 15
rightBars    = 15
volumeThresh = 20
win = leftBars + rightBars + 1
//---------------------------------------------//
// Pivote HIGH confirmado → cierra el tramo anterior y abre el nuevo
IF high[rightBars] = highest[win](high) THEN
   IF resLevel > 0 THEN
      DRAWSEGMENT(xRes, resLevel, barindex - rightBars, resLevel) style(line,2)COLOURED(255,0,0)
   ENDIF
   resLevel = high[rightBars]
   xRes     = barindex - rightBars
ENDIF
// Pivote LOW confirmado
IF low[rightBars] = lowest[win](low) THEN
   IF supLevel > 0 THEN
      DRAWSEGMENT(xSup, supLevel, barindex - rightBars, supLevel)style(line,2) COLOURED(35,61,238)
   ENDIF
   supLevel = low[rightBars]
   xSup     = barindex - rightBars
ENDIF
//---------------------------------------------//
// Oscilador de volumen EMA5 vs EMA10
shortV = average[5,1](volume)
longV  = average[10,1](volume)
IF longV > 0 THEN
   osc = 100 * (shortV - longV) / longV
ELSE
   osc = 0
ENDIF
//---------------------------------------------//
bearWick = (open - close) < (high - open)
bullWick = (open - low)  > (close - open)
atrUnit  = averagetruerange[14]
brkUp    = close CROSSES OVER resLevel
brkDown  = close CROSSES UNDER supLevel

IF toggleBreaks THEN
   IF brkUp AND osc > volumeThresh AND NOT bullWick THEN
      DRAWTEXT("B", barindex, low - atrUnit) COLOURED(0,180,0)
   ENDIF
   IF brkUp AND bullWick THEN
      DRAWTEXT("Bull Wick", barindex, low - atrUnit) COLOURED(0,180,0)
   ENDIF
   IF brkDown AND osc > volumeThresh AND NOT bearWick THEN
      DRAWTEXT("B", barindex, high + atrUnit) COLOURED(255,0,0)
   ENDIF
   IF brkDown AND bearWick THEN
      DRAWTEXT("Bear Wick", barindex, high + atrUnit) COLOURED(255,0,0)
   ENDIF
ENDIF
//---------------------------------------------//
// Extiende el nivel vigente hasta la barra actual (tramo aún sin cerrar)
IF ISLASTBARUPDATE THEN
   IF resLevel > 0 THEN
      DRAWSEGMENT(xRes, resLevel, barindex, resLevel) style(line,2)COLOURED(255,0,0)
   ENDIF
   IF supLevel > 0 THEN
      DRAWSEGMENT(xSup, supLevel, barindex, supLevel) style(line,2)COLOURED(35,61,238)
   ENDIF
ENDIF
//---------------------------------------------//
RETURN
