




More from ProRealCode
ProRealCode - Trading & Coding with ProRealTime™



Angle Market Structure — Swing Levels
Introduction
Almost every market structure tool treats a swing high as a fixed price. It draws a horizontal line at the pivot and waits for a close above it. That is a reasonable model, and it has one uncomfortable implication nobody likes to state out loud: a high made three bars ago and a high made three hundred bars ago are worth exactly the same.
Angle Market Structure refuses that. Here a pivot high starts a level that slides downwards a fixed fraction of ATR every single bar, and a pivot low starts one that slides up. Nothing has to happen for the level to move — time alone erodes it. What price eventually breaks is never the swing itself; it is the swing minus however much it has surrendered while waiting.
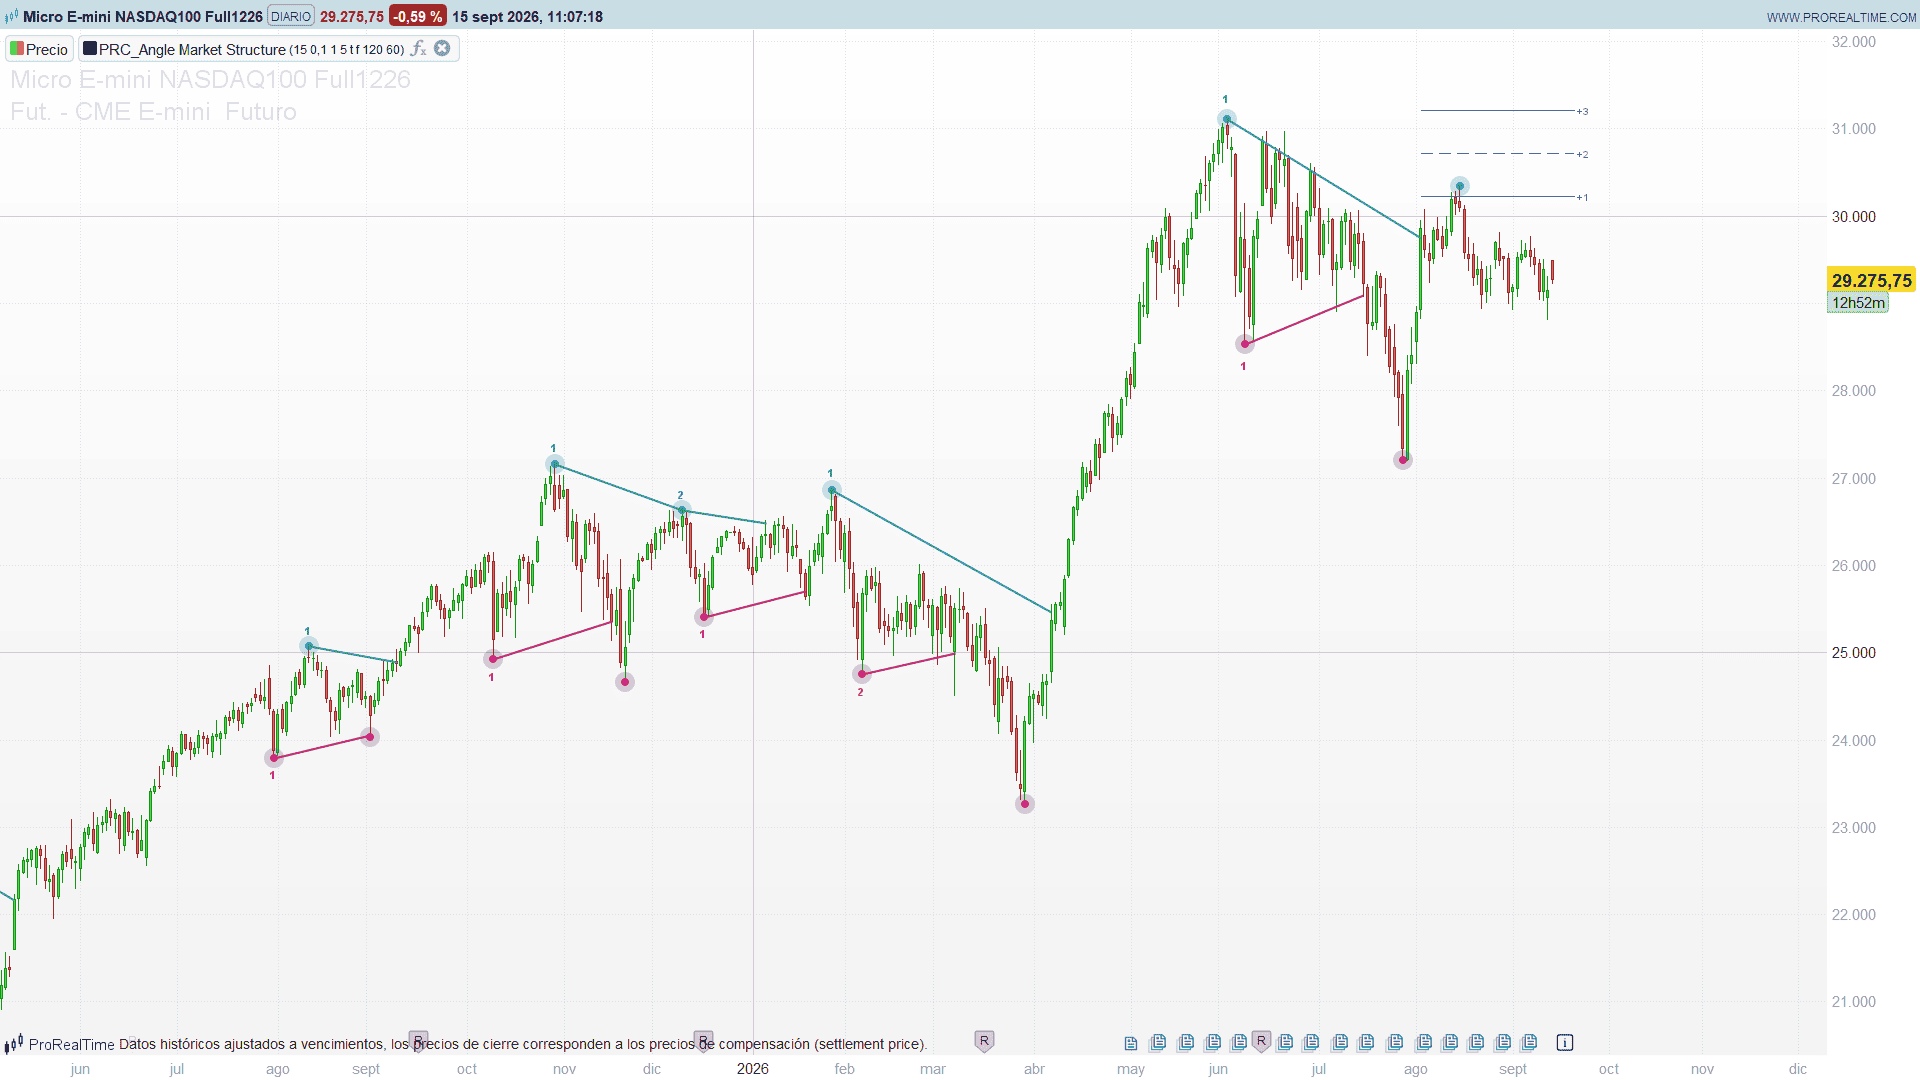
The consequence is the whole indicator. When the break finally happens, what gets drawn is the segment joining the pivot to the point of capture. Its slope is constant by construction — it is the decay rate — so the only thing that varies is its length, and its length is a direct reading of how long the structure held before giving in. A long angle is a level the market respected for forty bars. A short stub is one that folded in five. Both are breaks; they are not the same event, and on most charts you would have no way to tell them apart.
Each break is numbered with a running count of consecutive breaks on the same side, and the last break projects a 1 / 2 / 3 ATR grid ahead of price as a measured-move reference.
Theory Behind the Indicator
1. The pivot, and what it anchors
Both sides run on the standard swing definition: a bar whose high is the highest of the pvLen bars on each side of it (mirrored for lows), confirmed pvLen bars after the fact. Each confirmed pivot is marked with a dot — a wide translucent disc under a small solid one, which is what gives the marker its halo — and it re-anchors the sliding level on its side.
Re-anchoring matters more than it sounds. The level does not track the highest swing, it tracks the latest one. A lower high registered after a big one pulls the level down immediately, because the newest swing is the one the market is currently negotiating.
2. The slope
On every bar without a new pivot:
upper level = upper level - ATR(200) * angle
lower level = lower level + ATR(200) * angle
With angle = 0.1 a level surrenders one full ATR every ten bars. A swing high from forty bars ago sits four ATR below where it printed.
Two things fall out of that, and both are the point of the indicator:
- Old structure is cheap to break. The market does not need to reach the old high to trigger a break, only to reach what is left of it. That matches how ranges actually resolve: the boundary of a stale range gets eaten from the inside long before the extreme is retested.
- The measurement is in ATR, not in points. The decay is scaled to volatility, so the same
anglebehaves consistently across instruments and regimes. In a quiet market the levels barely move; in a violent one they fall fast, which is the correct behaviour — a two-week-old high means much less after a volatility expansion.
Note that the slope is per bar, not per unit of time. Moving from hourly to five-minute charts multiplies the number of bars by twelve and therefore the erosion over the same wall-clock period. The parameter is timeframe-dependent by design and should be retuned when you change timeframe.
3. The break, and the angle it leaves behind
A break is registered when the bar’s high crosses above the eroded upper level (or the low crosses below the eroded lower one). Three things happen at once:
- The angle is drawn: a segment from the pivot bar and pivot price to the current bar and the current level value.
- The level dies. It does not merely move away; it stops sliding and cannot be crossed again. A given swing produces exactly one angle, ever. The side stays silent until a new pivot prints.
- The deviation grid is rebuilt at 1, 2 and 3 ATR beyond the broken level, projected forward and labelled
+1/+2/+3above,-1/-2/-3below.
The “level dies” rule is what keeps the chart honest. Without it, price oscillating around a decaying level would print a break on every wiggle. With it, each structural level gets one verdict.
4. The consecutive break count
Every upside break increments a counter and resets the downside one to zero; every downside break does the mirror. That number is printed at the pivot, and it fades from the side’s own colour towards neutral grey as the run grows, saturating at five.
It is the only judgement the indicator makes, and it is worth reading literally:
- 1, 1, 1, 1 alternating between sides — the market is breaking structure in both directions in turn. That is a range, however impulsive each individual break looks.
- 1, 2, 3, 4 on one side — consecutive structure taken out in the same direction with nothing given back. That is trend, and the fading colour is telling you the run is maturing.
- A high count followed by a 1 on the other side — the first counter-break after a long run. Worth more attention than the tenth break of a chop.
5. The deviation grid
The grid is anchored to the broken level, not to the close, and it is spaced in ATR units. It is a measured-move reference: after a structural break, how far has this instrument typically travelled, in its own units of volatility? Only the most recent grid is kept — the next break replaces it — so the chart always shows the targets belonging to the structure currently in play.
Key Features at a Glance
- Time-decaying structure. Swing levels erode at a fixed ATR rate per bar instead of sitting still, so an old level is genuinely easier to break than a fresh one.
- The angle as a duration reading. Constant slope, variable length: the segment length is how long the structure held.
- One verdict per swing. A broken level is dead, not just distant — no repeated signals from the same oscillation.
- Consecutive break counter. A colour-fading number that separates trend runs from alternating chop at a glance.
- ATR deviation grid. 1 / 2 / 3 ATR targets anchored to the broken level, refreshed on every break.
- Volatility-normalised throughout. Slope and grid both scale off ATR(200), so settings carry across instruments.
- Confirmed marks. Pivots are confirmed
pvLenbars after the fact and their marks are frozen at the bar of the event.
How to Read the Indicator
- Read the length of the angle, not its existence. Every break draws one. The information is in how far the segment stretches back — that is how long the level survived.
- Read the number. A run of 1s alternating sides is a range. A climbing count on one side is a trend that has not yet been contradicted.
- Watch for the first counter-break after a long run. A
4on the teal side followed by a1on the magenta side is the sequence worth flagging. - Use the grid as a scale, not a target list. The
+1/+2/+3rails tell you what a normal, a good and an exceptional follow-through look like on this instrument, in its own volatility. - A quiet side is not a bullish or bearish sign. After a break the level stays dead until the next pivot confirms. Nothing is drawn in the meantime, and that is expected.
Practical Applications
- Range versus trend classification. The alternating-versus-climbing pattern of the counter is a regime filter that needs no extra indicator, and it reads in under a second.
- Ageing-structure breakouts. Set the decay low enough that only genuinely old levels erode meaningfully, then take only the breaks with long angles. The premise being tested is that the resolution of a long-held level carries further than the resolution of a fresh one.
- Measured-move management. Scale out at the
+1and+2rails rather than at fixed point distances — the spacing is already adapted to the instrument’s volatility. - Deciding when structure has gone stale. If a level has been sliding for fifty bars without being touched, the market is not defending it. The indicator makes that visible instead of leaving a horizontal line on the chart pretending the level is still live.
Indicator Configuration
pvLen(default 5) — bars required on each side of a pivot. Higher values give fewer, more significant swings.slopeAtr(default 0.1) — the decay, in ATR(200) per bar. This is the parameter that defines the indicator.0turns it into classic horizontal structure;1.0makes almost everything break within a handful of bars and the counter stops discriminating. The useful band is roughly 0.05 to 0.2, and it is timeframe-dependent.devSize(default 1.0) — spacing of the deviation grid, in ATR(200).devExt(default 5) — bars the grid is projected beyond the last bar.showDev(default 1) — draw the deviation grid of the most recent break.showPend(default 0) — draw the level that is still waiting to be broken, as a thin dotted line from its pivot to the current bar. Off by default so the chart shows only angles that have actually been caught; turn it on to see where the next break would trigger.maxPiv(default 120) — pivot dots kept on the chart.maxBrk(default 60) — broken structures kept on the chart.
Load the indicator with the “on price” option selected, not “new panel” — everything it produces is drawn at price level.
A Note on Warm-Up
The decay is measured against ATR(200), so the indicator needs at least 200 bars plus the pivot window before it produces anything, and it stays silent until then rather than drawing from an undefined average. On a short chart, load more history.
Code
//---------------------------------------------------------------------------//
//PRC_Angle Market Structure
//version = 0
//15.09.2026
//Ivan Gonzalez @ www.prorealcode.com
//Author: BigBeluga
//Sharing ProRealTime knowledge
//---------------------------------------------------------------------------//
//Every pivot high starts a level that slides DOWN a fixed fraction of ATR(200)
//on every bar that follows, and every pivot low starts one that slides up. The
//structure is only broken when price catches that sliding level, so the older
//a swing gets, the less it costs to break it. Each break is drawn as the line
//that joins the pivot to the point where it was caught, which is the angle the
//indicator is named after, and is numbered with the count of consecutive
//breaks on that side. The last break also prints a 1 / 2 / 3 ATR grid ahead of
//price.
//---------------------------------------------------------------------------//
DEFPARAM drawonlastbaronly = true
//-----Structure-------------------------------------------------------------//
pvLen    = 5      //Bars required on each side of a pivot
slopeAtr = 0.1    //Slope of the sliding level, in ATR(200) per bar
devSize  = 1.0    //Spacing of the deviation grid, in ATR(200)
devExt   = 5      //Bars the deviation grid is projected past the last bar

//-----Display---------------------------------------------------------------//
showDev  = 1      //1 = draw the deviation grid of the most recent break
showPend = 0      //1 = draw the level that is still waiting to be broken
maxPiv   = 120    //Pivot dots kept on the chart
maxBrk   = 60     //Broken structures kept on the chart

//-----Colours---------------------------------------------------------------//
//The teal of the original, RGB(27,202,184), scores a 2.06:1 contrast ratio
//against the white background ProRealTime uses by default, so it reads as the
//background itself. Replaced by a medium teal that clears 3:1 on a light AND
//on a dark chart. The magenta of the original already clears both.
bullR = 13
bullG = 148
bullB = 136
bearR = 203
bearG = 30
bearB = 122
//chart.fg_color of the original: the deviation grid, and the far end of the
//gradient that colours the break count.
fgR = 120
fgG = 120
fgB = 120

//---------------------------------------------------------------------------//
//                               STATE AND SEEDS                             //
//---------------------------------------------------------------------------//
//One spare slot on top of the useful capacity: the spare is always the next
//write position and never belongs to the reading window (learning 235).
pvRing  = maxPiv + 1
bkRing  = maxBrk + 1
//ATR(200) needs 200 bars, and a pivot needs 2 * pvLen + 2 more. Reading the
//native before that returns UNDEFINED and would poison the sliding level,
//which is recursive (trap 23).
minBars = 205 + 2 * pvLen

IF barindex = 0 THEN
   nPiv  = 0
   nBrk  = 0
   phVal = high
   plVal = low
   phPx  = high
   plPx  = low
   phBar = 0
   plBar = 0
   phAct = 0
   plAct = 0
   cntUp = 0
   cntDn = 0
   devDir = 0
   devBar = 0
   devPx  = 0
   devAtr = 0
   //One guard per write site. It has to live in an array: a scalar would
   //rewind on every tick of the live bar and would not block anything
   //(trap 26). Seeded below zero so bar 0 itself is not locked out.
   $gBar[1] = 0 - 1
   $gBar[2] = 0 - 1
   $gBar[3] = 0 - 1
   $gBar[4] = 0 - 1
ENDIF

atr200 = averagetruerange[200](close)
hhW    = highest[pvLen](high)
llW    = lowest[pvLen](low)

//---------------------------------------------------------------------------//
//                                   ENGINE                                  //
//---------------------------------------------------------------------------//
supUp = 0
supDn = 0

IF barindex > minBars THEN

   atrSlp = atr200 * slopeAtr
   atrDev = atr200 * devSize

   //-----Pivots-------------------------------------------------------------//
   //A pivot compares high[pvLen] against the pvLen bars on each side, and the
   //right hand half INCLUDES the live bar: on an early tick a swing can
   //qualify and stop qualifying a few ticks later. Scalars rewind on every
   //tick, ring buffers do not, so a swing read live would leave an orphan
   //entry behind (learning 243).
   //supUp is that same test run live bar and all, and it is used for ONE
   //thing: to suppress a break on the bar the level is re-anchored, where it
   //jumps back to the raw swing high and nothing can cross it. It never
   //reaches a buffer.
   //The pivot that does reach the buffers is supUp[1], read one bar later, so
   //every stored input comes from bars that are already closed.
   //Ties: the right hand side accepts an equal bar and the left hand side
   //does not, so on a flat top the FIRST bar of the plateau is the pivot.
   pvTopNow = high[pvLen]
   pvBotNow = low[pvLen]
   IF pvTopNow >= hhW AND pvTopNow > hhW[pvLen + 1] THEN
      supUp = 1
   ENDIF
   IF pvBotNow <= llW AND pvBotNow < llW[pvLen + 1] THEN
      supDn = 1
   ENDIF
   isPh = supUp[1]
   isPl = supDn[1]
   phCand = high[pvLen + 1]
   plCand = low[pvLen + 1]

   //-----The sliding levels-------------------------------------------------//
   //phPrev / plPrev hold the level as it stood on the previous bar for the
   //purpose of the crossover test. They only differ from a plain [1] on the
   //bar a pivot is registered, where the level belongs to the raw swing price
   //with no slope applied yet. Without them the test would compare the
   //previous high against a stale level and miss the break.
   phPrev = phVal[1]
   plPrev = plVal[1]

   IF isPh = 1 THEN
      phBar  = barindex - pvLen - 1
      phPx   = phCand
      phPrev = phCand
      //One slope step is applied right here: the swing was confirmed one bar
      //ago, so by the time this bar is reached the level has already slid
      //once.
      phVal  = phCand - atrSlp
      phAct  = 1
   ELSIF phAct = 1 THEN
      phVal = phVal - atrSlp
   ENDIF

   IF isPl = 1 THEN
      plBar  = barindex - pvLen - 1
      plPx   = plCand
      plPrev = plCand
      plVal  = plCand + atrSlp
      plAct  = 1
   ELSIF plAct = 1 THEN
      plVal = plVal + atrSlp
   ENDIF

   //-----Pivot dots---------------------------------------------------------//
   IF isPh = 1 AND barindex > $gBar[1] THEN
      slP = nPiv MOD pvRing
      $pvX[slP] = phBar
      $pvY[slP] = phPx
      $pvD[slP] = 1
      nPiv = nPiv + 1
      $gBar[1] = barindex
   ENDIF
   IF isPl = 1 AND barindex > $gBar[2] THEN
      slP = nPiv MOD pvRing
      $pvX[slP] = plBar
      $pvY[slP] = plPx
      $pvD[slP] = 0
      nPiv = nPiv + 1
      $gBar[2] = barindex
   ENDIF

   //-----Break of the upper level-------------------------------------------//
   //A broken level is dead, not merely far away: it stops sliding and nothing
   //can cross it again until a new pivot prints. That is what phAct stands
   //for, and it is why a single swing yields exactly one angle.
   brkUp = 0
   IF phAct = 1 AND supUp = 0 AND high > phVal AND high[1] <= phPrev THEN
      brkUp = 1
   ENDIF

   IF brkUp = 1 THEN
      cntUp = cntUp + 1
      cntDn = 0
      IF barindex > $gBar[3] THEN
         slB = nBrk MOD bkRing
         $bkX1[slB]  = phBar
         $bkY1[slB]  = phPx
         $bkX2[slB]  = barindex
         $bkY2[slB]  = phVal
         $bkDir[slB] = 1
         $bkNum[slB] = cntUp
         //Label height frozen on the bar of the event: read at repaint time it
         //would take the ATR of the last bar for every mark (learning 182).
         $bkLY[slB]  = phPx + atr200 * 0.5
         nBrk = nBrk + 1
         $gBar[3] = barindex
      ENDIF
      devDir = 1
      devBar = barindex
      devPx  = phVal
      devAtr = atrDev
      phAct  = 0
   ENDIF

   //-----Break of the lower level-------------------------------------------//
   brkDn = 0
   IF plAct = 1 AND supDn = 0 AND low < plVal AND low[1] >= plPrev THEN
      brkDn = 1
   ENDIF

   IF brkDn = 1 THEN
      cntDn = cntDn + 1
      cntUp = 0
      IF barindex > $gBar[4] THEN
         slB = nBrk MOD bkRing
         $bkX1[slB]  = plBar
         $bkY1[slB]  = plPx
         $bkX2[slB]  = barindex
         $bkY2[slB]  = plVal
         $bkDir[slB] = 0
         $bkNum[slB] = cntDn
         $bkLY[slB]  = plPx - atr200 * 0.5
         nBrk = nBrk + 1
         $gBar[4] = barindex
      ENDIF
      devDir = 2
      devBar = barindex
      devPx  = plVal
      devAtr = atrDev
      plAct  = 0
   ENDIF

ENDIF

//---------------------------------------------------------------------------//
//                                  DRAWING                                  //
//---------------------------------------------------------------------------//
IF islastbarupdate THEN

   //-----Pivot dots: a wide faint disc under a small solid one--------------//
   //That pair is the glow the original gets by plotting the same circle twice
   //at two transparencies. Radii have to be literal numbers (learning 138).
   nP = min(nPiv, maxPiv)
   IF nP > 0 THEN
      stP = (nPiv - nP) MOD pvRing
      FOR q = 0 TO nP - 1 DO
         slP = (stP + q) MOD pvRing
         IF $pvD[slP] = 1 THEN
            DRAWPOINT($pvX[slP], $pvY[slP], 5) COLOURED(bullR, bullG, bullB, 60)
            DRAWPOINT($pvX[slP], $pvY[slP], 2) COLOURED(bullR, bullG, bullB, 220)
         ELSE
            DRAWPOINT($pvX[slP], $pvY[slP], 5) COLOURED(bearR, bearG, bearB, 60)
            DRAWPOINT($pvX[slP], $pvY[slP], 2) COLOURED(bearR, bearG, bearB, 220)
         ENDIF
      NEXT
   ENDIF

   //-----Broken structures: the angle, and its break count------------------//
   //The count fades from the side colour towards neutral grey as the run of
   //consecutive breaks grows, and saturates at five. That is what
   //color.from_gradient(count, 0, 5, col, chart.fg_color) does.
   nB = min(nBrk, maxBrk)
   IF nB > 0 THEN
      stB = (nBrk - nB) MOD bkRing
      FOR q = 0 TO nB - 1 DO
         slB = (stB + q) MOD bkRing
         cntTxt = $bkNum[slB]
         grad = min(cntTxt, 5) / 5
         IF $bkDir[slB] = 1 THEN
            cR = round(bullR + (fgR - bullR) * grad)
            cG = round(bullG + (fgG - bullG) * grad)
            cB = round(bullB + (fgB - bullB) * grad)
            DRAWSEGMENT($bkX1[slB], $bkY1[slB], $bkX2[slB], $bkY2[slB]) COLOURED(bullR, bullG, bullB, 255) STYLE(line, 2)
         ELSE
            cR = round(bearR + (fgR - bearR) * grad)
            cG = round(bearG + (fgG - bearG) * grad)
            cB = round(bearB + (fgB - bearB) * grad)
            DRAWSEGMENT($bkX1[slB], $bkY1[slB], $bkX2[slB], $bkY2[slB]) COLOURED(bearR, bearG, bearB, 255) STYLE(line, 2)
         ENDIF
         DRAWTEXT("#cntTxt#", $bkX1[slB], $bkLY[slB], SansSerif, Bold, 11) COLOURED(cR, cG, cB, 255)
      NEXT
   ENDIF

   //-----Deviation grid of the most recent break----------------------------//
   //The original keeps exactly one grid alive and deletes the previous one,
   //so a single set of scalars is enough: there is nothing to store.
   IF showDev = 1 AND devDir > 0 THEN
      xR = barindex + devExt
      IF devDir = 1 THEN
         d1 = devPx + devAtr
         d2 = devPx + devAtr * 2
         d3 = devPx + devAtr * 3
         DRAWSEGMENT(devBar, d1, xR, d1) COLOURED(fgR, fgG, fgB, 255) STYLE(line, 1)
         DRAWSEGMENT(devBar, d2, xR, d2) COLOURED(fgR, fgG, fgB, 255) STYLE(dottedline2, 1)
         DRAWSEGMENT(devBar, d3, xR, d3) COLOURED(fgR, fgG, fgB, 255) STYLE(line, 1)
         DRAWTEXT("+1", xR + 2, d1, SansSerif, Standard, 10) COLOURED(fgR, fgG, fgB, 255)
         DRAWTEXT("+2", xR + 2, d2, SansSerif, Standard, 10) COLOURED(fgR, fgG, fgB, 255)
         DRAWTEXT("+3", xR + 2, d3, SansSerif, Standard, 10) COLOURED(fgR, fgG, fgB, 255)
      ELSE
         d1 = devPx - devAtr
         d2 = devPx - devAtr * 2
         d3 = devPx - devAtr * 3
         DRAWSEGMENT(devBar, d1, xR, d1) COLOURED(fgR, fgG, fgB, 255) STYLE(line, 1)
         DRAWSEGMENT(devBar, d2, xR, d2) COLOURED(fgR, fgG, fgB, 255) STYLE(dottedline2, 1)
         DRAWSEGMENT(devBar, d3, xR, d3) COLOURED(fgR, fgG, fgB, 255) STYLE(line, 1)
         DRAWTEXT("-1", xR + 2, d1, SansSerif, Standard, 10) COLOURED(fgR, fgG, fgB, 255)
         DRAWTEXT("-2", xR + 2, d2, SansSerif, Standard, 10) COLOURED(fgR, fgG, fgB, 255)
         DRAWTEXT("-3", xR + 2, d3, SansSerif, Standard, 10) COLOURED(fgR, fgG, fgB, 255)
      ENDIF
   ENDIF

   //-----The level that has not been broken yet-----------------------------//
   //Not in the original, which only shows the angle once it has been caught.
   //Switched off by default, so out of the box the chart shows only the
   //angles that have actually been caught.
   IF showPend = 1 THEN
      IF phAct = 1 THEN
         DRAWSEGMENT(phBar, phPx, barindex, phVal) COLOURED(bullR, bullG, bullB, 110) STYLE(dottedline, 1)
      ENDIF
      IF plAct = 1 THEN
         DRAWSEGMENT(plBar, plPx, barindex, plVal) COLOURED(bearR, bearG, bearB, 110) STYLE(dottedline, 1)
      ENDIF
   ENDIF

ENDIF

RETURN
Conclusion
Angle Market Structure takes one small liberty with a very standard idea and gets a surprising amount out of it. Let the swing level decay instead of standing still, and the break stops being a binary event: it acquires a duration, drawn as the angle joining the swing to the point where price finally caught it. From there everything else follows naturally — a level that dies once broken so each swing gets a single verdict, a consecutive break counter that separates a trending sequence from an alternating one without any extra machinery, and an ATR grid that states the follow-through in the instrument’s own units. Everything is normalised by ATR(200), which is what lets the same settings behave sensibly across instruments and volatility regimes. Set slopeAtr to zero and you are back to classic horizontal structure; raise it and you are asking a sharper question — not “was the high exceeded”, but “how long did the market defend it before it stopped bothering”.