RSI Supertrend with Historical Max/Min Levels
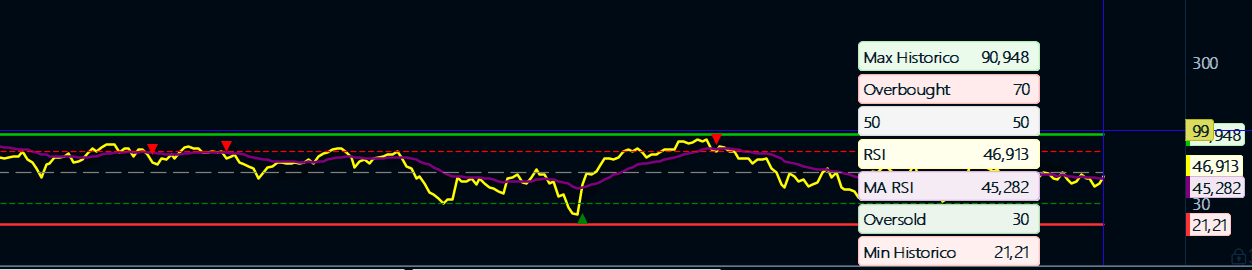
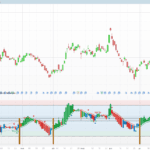
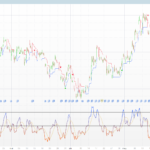
This indicator takes the classic Supertrend logic, normally built on price, and applies it directly to the RSI instead. On top of that trailing band, it also plots two extra lines that record the highest and lowest RSI value reached since the indicator started running on the chart. The result is a way to read RSI trend changes through a visual trailing band, plus a quick reference for how far the RSI has actually swung historically on that instrument and timeframe.
How it works
- The RSI is calculated first, with an adjustable period and price source, then smoothed with a moving average as a reference line.
- An ATR is calculated on the RSI values themselves, not on price, and used to build a trailing band around the RSI. Same mechanism as a standard Supertrend, just applied to the oscillator instead of the candles.
- When the RSI is trending up, the band sits below it and trails upward. When the trend flips down, the band sits above the RSI and trails downward.
- The area between the band and the RSI line is filled for visual clarity.
- Two extra lines track the all time high and all time low of the RSI on the chart, giving a sense of the historical range the RSI has moved in.
- An arrow is drawn when the band crosses over the RSI while in overbought territory, a possible bearish reversal, and another one when the band crosses under the RSI while in oversold territory, a possible bullish reversal.
Settings
- relativeStrengthIndexLength: RSI period, default 14
- rsiInputSource: price source used for the RSI, default CustomClose, can be changed from the chart settings
- movingAverageLength and movingAverageType: length and type of the moving average applied to the RSI, default 21 period EMA
- trendFactor: ATR multiplier used to build the trailing band, default 0.8. Lower it for a tighter, more reactive band, raise it for a smoother band that flips less often
- averageTrueRangeLength: ATR period, calculated on the RSI, default 10
- obline and osline: overbought and oversold thresholds, default 70 and 30, used to filter when the arrows can appear
- midline: reference line at 50
- transparency: opacity of the fill between the band and the RSI, default 80
One thing worth mentioning for anyone reusing this: the band and fill color are currently set to black in both the up and down phases, r, g and b are all at 0 in both branches. If you want the trend direction to stand out at a glance, you can give the up phase and the down phase different colors, green and red for instance.
// RSI Supertrend + Max y Min Historico
relativeStrengthIndexLength=14
rsiInputSource=customclose
movingAverageLength=21
movingAverageType=1
trendFactor=0.8
averageTrueRangeLength=10
obline=70
osline=30
midline=50
transparency=80

myrsi=RSI[relativeStrengthIndexLength](rsiInputSource)
rsiMovingAverage=Average[movingAverageLength,movingAverageType](myrsi)

ONCE MaxHistoricoRSI=0
ONCE MinHistoricoRSI=100
IF myrsi>MaxHistoricoRSI THEN
   MaxHistoricoRSI=myrsi
ENDIF
IF myrsi<MinHistoricoRSI THEN
   MinHistoricoRSI=myrsi
ENDIF

pricesource=myrsi
highestHigh=highest[averageTrueRangeLength](pricesource)
lowestlow=lowest[averageTrueRangeLength](pricesource)

IF barindex<=averageTrueRangeLength THEN
   truerange=highestHigh-lowestlow
ELSE
   truerange=max(highestHigh-lowestlow,max(abs(highestHigh-pricesource[1]),abs(lowestlow-pricesource[1])))
ENDIF

alpha=1/averageTrueRangeLength
IF barindex<=4*averageTrueRangeLength THEN
   atr=average[averageTrueRangeLength](truerange)
ELSE
   atr=alpha*truerange+(1-alpha)*atr[1]
ENDIF

up=pricesource-trendFactor*atr
up1=up[1]
IF pricesource[1]>up1 THEN
   up=max(up,up1)
ENDIF

dn=pricesource+trendFactor*atr
dn1=dn[1]
IF pricesource[1]<dn1 THEN
   dn=min(dn,dn1)
ENDIF

ONCE trend=1
IF trend=-1 AND pricesource>dn1 THEN
   trend=1
ELSIF trend=1 AND pricesource<up1 THEN
   trend=-1
ENDIF

IF trend=1 THEN
   mysupertrend=up
   r=0
   g=0
   b=0
ELSE
   mysupertrend=dn
   r=0
   g=0
   b=0
ENDIF

colorbetween(mysupertrend,pricesource,r,g,b,transparency)

IF mysupertrend CROSSES OVER pricesource AND mysupertrend>obline THEN
   DRAWTEXT("▼",barindex,mysupertrend+2) COLOURED("red")
ENDIF
IF mysupertrend CROSSES UNDER pricesource AND mysupertrend<osline THEN
   DRAWTEXT("▲",barindex,mysupertrend-2) COLOURED("green")
ENDIF

RETURN pricesource AS "RSI",mysupertrend AS "Supertrend" COLOURED(r,g,b),rsiMovingAverage AS "MA RSI" COLOURED("PURPLE") STYLE(LINE,2),MaxHistoricoRSI AS "Max Historico" COLOURED(0,200,0) STYLE(LINE,2),MinHistoricoRSI AS "Min Historico" COLOURED(255,50,50) STYLE(LINE,2),obline AS "Overbought" COLOURED("RED") STYLE(DOTTEDLINE),osline AS "Oversold" COLOURED("GREEN") STYLE(DOTTEDLINE),midline AS "50" COLOURED("grey") STYLE(DOTTEDLINE2)