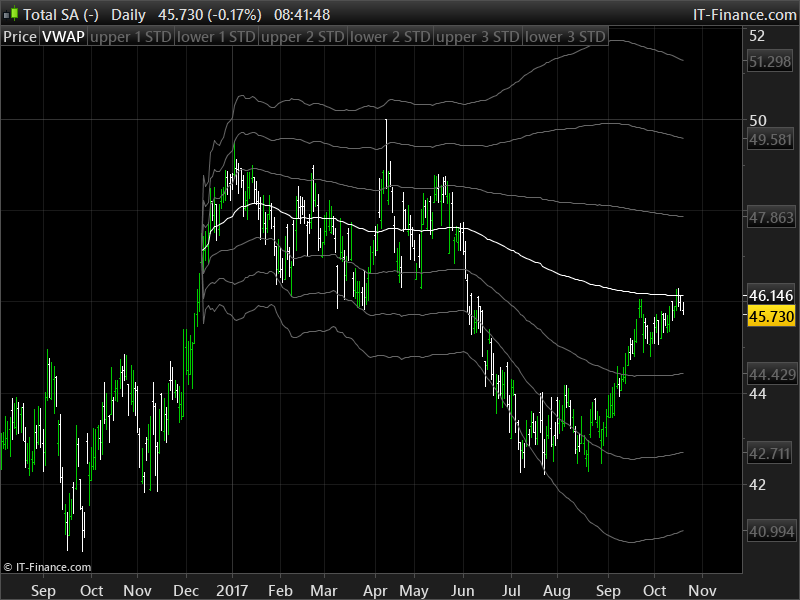
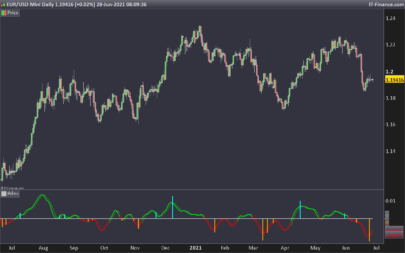
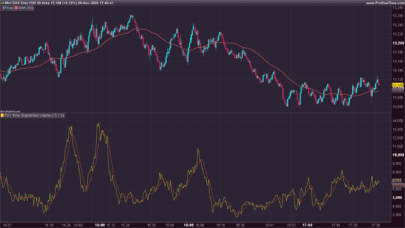
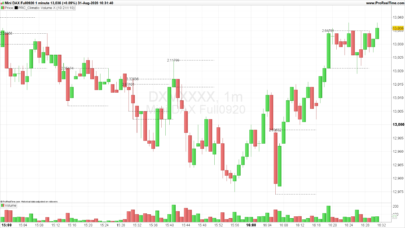
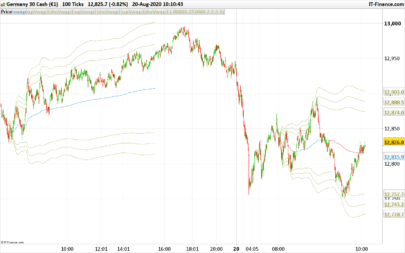
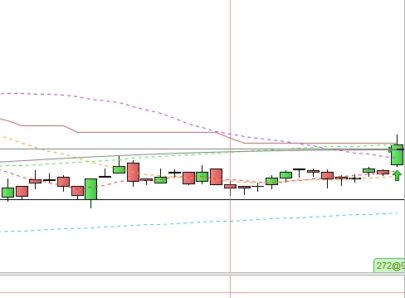
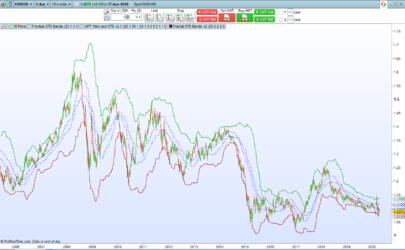
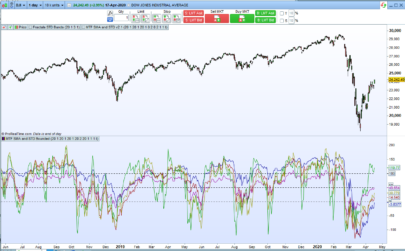
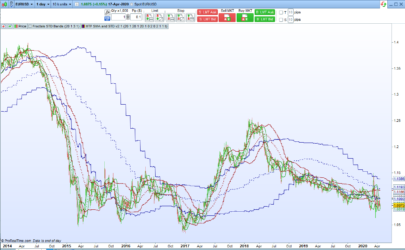
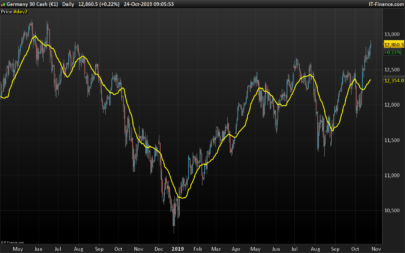
Another version of the VWAP indicator, this time you can set the start of its calculation with a date in YYYYMMDD format (modify it in the indicator settings). Set it on the last gap a stock on a daily timeframe will give you a good idea of the mean price since this particular day.
You also have the possibility to view or not the 3 upper and 3 lower standard deviation lines with a switch in the settings.
The VWAP formula is:
VWAP = Sum (Price[t] x Volume[t]) / Sum(Volume[t])
Indicator coded by a request made in this forum topic: https://www.prorealcode.com/topic/anchored-vwap/
|
1 2 3 4 5 6 7 8 9 10 11 12 13 14 15 16 17 18 19 20 21 22 23 24 25 26 27 28 29 30 31 32 33 34 35 36 37 38 39 40 41 42 43 44 45 46 47 48 49 50 |
//PRC_VWAP Date anchored | indicator //19.10.2017 //Nicolas @ www.prorealcode.com //Sharing ProRealTime knowledge // --- settings //startDate = 20161212 //viewSD = 1 //1 = true / 0 = false // --- end of settings VWAP=undefined SDup1 = undefined SDlw1 = undefined SDup2 = undefined SDlw2 = undefined SDup3 = undefined SDlw3 = undefined if opendate=startDate then startbar=barindex endif if opendate>=startDate then barcount=barindex-startbar d = max(1, barcount) VWAP = SUMMATION[d](volume*typicalprice)/SUMMATION[d](volume) if(barcount=0) then sd = 0 else sd = SUMMATION[d](max(abs(high-vwap),abs(vwap-low)))/d endif if viewSD then SDup1 = vwap+sd SDlw1 = vwap-sd SDup2 = vwap+sd*2 SDlw2 = vwap-sd*2 SDup3 = vwap+sd*3 SDlw3 = vwap-sd*3 endif if vwap>vwap[1] then color = 1 else color = -1 endif endif RETURN VWAP coloured by color as "VWAP", SDup1 coloured(102,102,102) as "upper 1 STD", SDlw1 coloured(102,102,102) as "lower 1 STD", SDup2 coloured(102,102,102) as "upper 2 STD", SDlw2 coloured(102,102,102) as "lower 2 STD", SDup3 coloured(102,102,102) as "upper 3 STD", SDlw3 coloured(102,102,102) as "lower 3 STD" |
Share this
No information on this site is investment advice or a solicitation to buy or sell any financial instrument. Past performance is not indicative of future results. Trading may expose you to risk of loss greater than your deposits and is only suitable for experienced investors who have sufficient financial means to bear such risk.
ProRealTime ITF files and other attachments :
Find other exclusive trading pro-tools on ![]()
PRC is also on YouTube, subscribe to our channel for exclusive content and tutorials


Hi Nicolas,
I couldn’t find a better way to ask you my question. I have a problem of finding a way to rerun a bar index of highest or lowest criteria. For example I want to know what is bar index of this statement highest [250](rsi[14](close)). Is it possible to get the bar index of such statement. Just to make it clear, I want to know what bar number that maximum or minimum RSI has happened in the last 52 weeks?
Thanks in advance for your help.
Hamid
Sorry but this question has nothing to deal with this indicator, it belongs to a specific support to a new topic you need to open in the ProBuilder section of the forums. Thank you.
Hello Nicholas,
I am super excited to see you having built this script (and @jaysay requesting it)! I assume he is a Brian Shannon scholar as am I. However, I am having difficulty creating this on the thinkorswim platform. I’m sure its a noob mistake, but my scripting knowledge is about nill. When I paste this script into thinkorswim, it replies with the error of “Invalid statement: // at 1:1”. When I remove the “//” of course I continually get similar errors. When I remove entire first two ‘paragraphs’ where these forward slashes occur, the script takes, but with no input ability (of course because the date settings you’ve created are removed. How can I get this thing to take?
Hi, we do not offer free assistance for other trading platform than ProRealTime. There is no ThinkOrSwim (TOS) scripts at all here 🙂
You can ask for private paid services through the programming services: https://www.prorealcode.com/trading-programming-services/
Hi! The indicator works perfect, but I can’t find a way to anchored the VWAP specify for each different ticker symbol. This VWAP has default settings like an moving average, eg. 200 days in every symbol, timeframe. I want the anchored VWAP to set different dates on different tickers. Is it possible? Thanks in advance!
just change the starting date in the settings. The indicator does not have any predefined period as it uses the bars quantity elapsed since its first calculation, as per the VWAP formula.
Not working because every change on VWAP not anchored on specific symbol. I want as a trend line is different for every ticker, not for all the same… Maybe this is not possible. Maybe must use drawing functions on code…
Because you change the date in the code it affects all charts. Download the itf file from this page and use the settings from the indicator window and don’t change anything in the code.
No, I change the start date in settings, not in code. The problem is still here. I have installed the .itf file. Don’t know why..
Because your charts are linked together in the same group. Just unlink them.
Hi Nicolas,
I´ve tried to add this script. Nonetheless, a message warning an error on programming code appears
“the following variable is undefined: startDate, viewSD”
I´m using the format yyyymmdd. Also I defined to show each standard deviation (1) .
Suggestions?
Thanks in advance
Download the itf file and import it into the platform, or remove the // before the 2 variables names you mentionned, in your code.
Thank you very much!!
Hello. Firstly, It doesn’t really replicate what Brian Shannon uses on his videos. Anyone has compared it and got the same ? And second It displays the anchored vwap on another window. can it be in the same window as the price? Anyone got any luck with it? Thank you for your help in advance.
Sorry i don’t know who is Brian Shannon?! If you want to get the indicator applied on the price, apply it on the price. Use the wrench on the left upper side of the price chart.
Does look different esp when anchoring from the high… https://www.trendspider.com/blog/trendspider-user-guide-exploring-the-anchored-vwap-with-brian-shannon/
Hi, is it possible to alter the SD setting to SD of say 0.5, 1.5 etc in the code? Thanks (Prorealtime user)
@Bel. I was comparing to Trendspider too. I tried altering the code on Line 35 and Line 36 by adding a smaller the 1 SD to make it as similar as possible
SDup1 = vwap+sd+0.45
SDlw1 = vwap-sd+0.45.
I then unticked the other lines. It makes it a much closer match to Trendspider, using MELI as an example from a youtube video.
Bonjour Nicolas. Avant tout merci beaucoup pour votre aide et cet indicateur. J’aimerais savoir s’il est possible d’apporter une modification à cet indicateur, afin de pouvoir ajouter des heures et minutes. Celapermet de positionner l’anchored VWAP a des bougie précises (gap, point bas, breakout etc)
Où dois-je faire la demande, ici ou j’ouvre un post dans le forum ? merci
voir ces sujets: https://www.prorealcode.com/topic/time-anchored-vwap/#post-128382
https://www.prorealcode.com/topic/vwap-date-time-anchored/
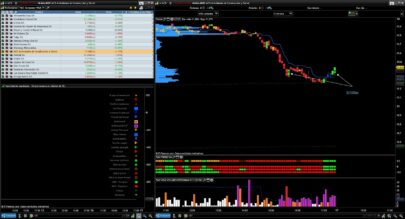
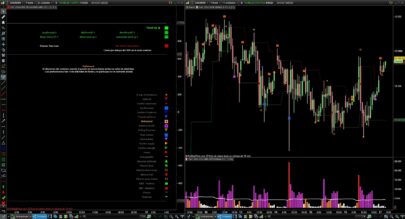
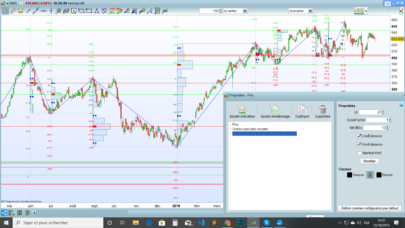
Hi Nicolas. I am really late to the party about this post but I have a question. I am an absolute newbie when it comes to coding and this is the first indicator that I have tried to import to PRT. I would like the indicator to show on my charts and it doesn’t, instead it displays underneath the chart. I know it’s not meant to be like this, from the illustration. Can you help me?
Add it on the price chart with the wrench at the upper left side of price chart.
//PRC_VWAP Date anchored | indicator
//19.10.2017
//Nicolas @ http://www.prorealcode.com
//Sharing ProRealTime knowledge
// — settings
//startDate = 20161212
//viewSD = 1 //1 = true / 0 = false
// — end of settings
whith this setting my vwap is anchorated on 16.06.2022.
where am i wrong?
i want anchorate vwap and sd or at a specified date or at last week?
Thanks you very much
Better to download the file from the page and import it into your platform in order to not change the code by yourself. Once installed you will be able to change the date of the anchor with the setting “startDate” available in the indicator window.
Hi Nicolas, thanks for sharing the VWAP Date Indicator. It is really powerful. Nevertheless, It seems that there are slight differences on values in different time frames if you set the same date. The difference is around about 30/40 points from 1m TF to the daily. Thanks for your feedback. Regards Marco
Are you sure you are using the same exact date, hours, minutes, seconds for anchor?