Volume Rsi oversold/overbought

v10.3
Volume Rsi oversold/overbought

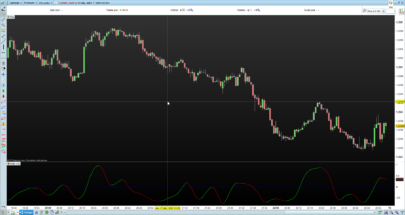
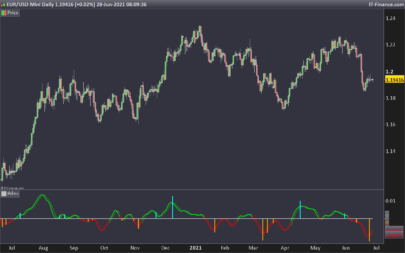
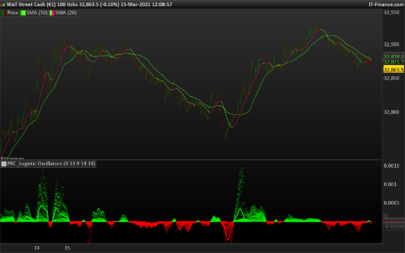
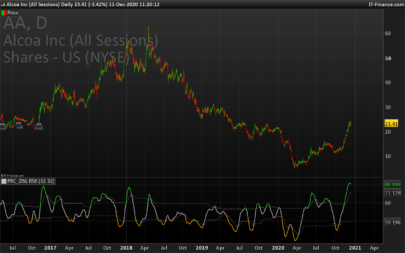
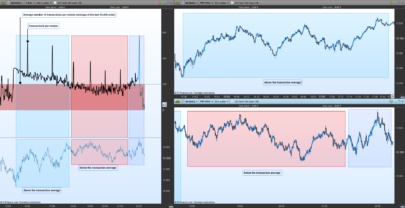
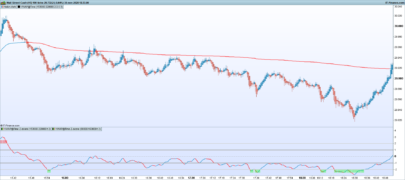
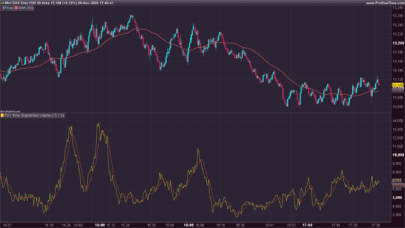
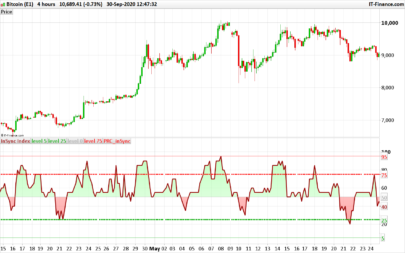
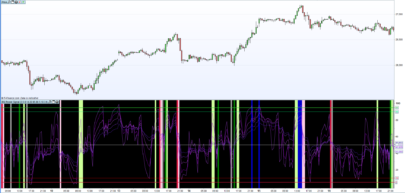
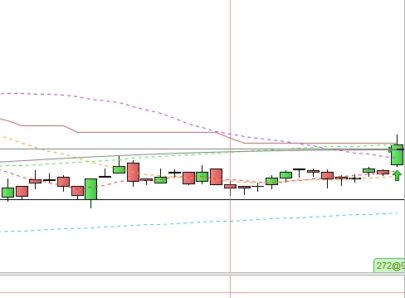
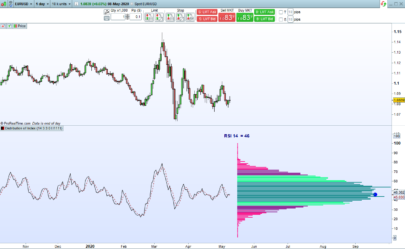
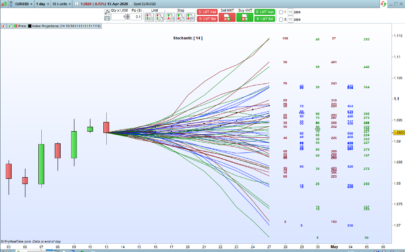
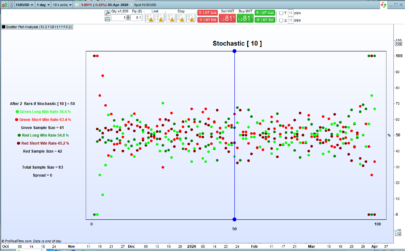
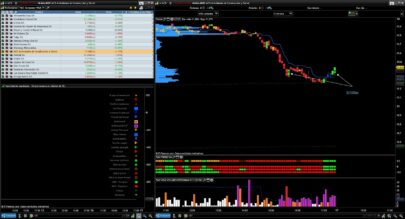
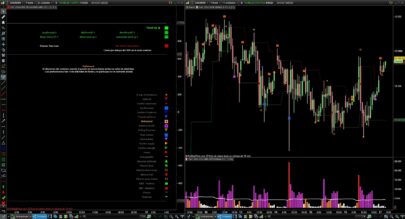
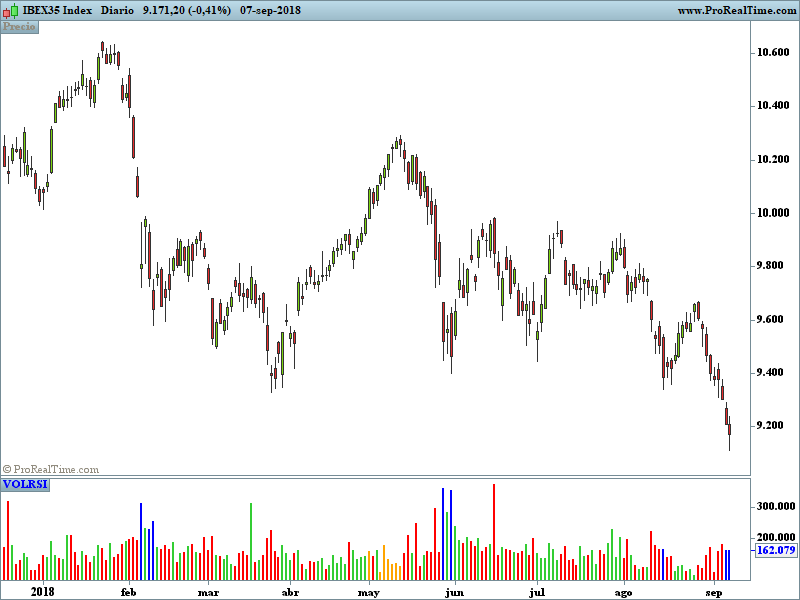
A volume indicator that indicates overbought and oversold based on rsi. this indicator allows you to identify the overbought and oversold areas of the rsi with the colors ;

blue (oversold)

orange (overbought )

on the volume indicator

(adaptation for the Prorealtime v 10.3  platform of the Tradingview indicator.)

Share this

Risk disclosure:

No information on this site is investment advice or a solicitation to buy or sell any financial instrument. Past performance is not indicative of future results. Trading may expose you to risk of loss greater than your deposits and is only suitable for experienced investors who have sufficient financial means to bear such risk.

ProRealTime ITF files and other attachments : How to import ITF files into ProRealTime platform?

PRC is also on YouTube, subscribe to our channel for exclusive content and tutorials
  1. luxrun • 09/10/2018 #

    Thanks, bolsatrilera, for a very good and solid screener!

  2. luxrun • 09/10/2018 #

    sorry… indicator!

  3. Lily Rios • 09/10/2018 #

    Gracias por el indicador, tengo una pregunta necesito programar un screener de valores que entre otras condiciones el RSI de ayer haya sido menor a 30 pero el de hoy es mayor a 30. Me podrías ayudar?

avatar
Register or

Likes

avatar avatar avatar avatar avatar avatar avatar avatar avatar avatar avatar avatar avatar
Related users ' posts
Vinks_o_7 Vonasi you're a beast !!! ;-)))
pableitor Amazing indicator , you are pushing PRT to the limit! But looking at the scatter its not c...
kal Buenos días TACBOLSA. Estoy muy interesado en ver tu blog para ver la explicación con detall...
1Randy I would be interested an invite to your blog. I am still learning about the VSA and it looks...
repropel Buenos días TACBOLSA. Yo también estoy interesado en visitar tu blog. Podrías enviarme una i...
Zigo
4 years ago
fifi743 Good morning, there is no mistake about the shorts c11=SMI[14,3,5](close)>-40
Zigo has to be c11=SMI[14,3,5] < -40 (indeed)
xar3 Thank you ;-) Zigo
Maxime Baudin Very useful! Thanks Mat, and Happy New Year
nicko Great work. Thank you. However I am having trouble getting it to print in the first bar. If ...
Marie-Eve Vergoz Bonsoir - Voici l'erreur qui est signalée lorsque je souhaite utiliser cet indicateur : il...
Meta Signals Pro Pleasure ! Please let us know if you make good trades with it and if you see improvements we...
francis59 Bonjour, Bonjour, comment puis-je créer un screener basé sur cet indicateur, qui affiche le...
Trader Sab I am curious to try it how, however I get an error message for line 47 and 48 - drawsegment,...
Om Hello, thanks for sharing! Getting a message that Variable P is undefined?
matin Intraday Average Volume Indicator Not working, what can i do plz
Sapo Thank you very much. as always your indicators are extremely effective. kind regards Vonasi.
mitsu21 Hi, it looks nice. I'll try it tomorrow thank you for your share kind regards bruno
kj1988 Thank you Vonasi for sharing this indicator. Very useful as a comfirmation to the price act...
ggolfet Thanks Nicolas, I imported the itf file and solved the problem.
Hasardeur Hallo Nicolas, i tried to code the multi period heat map in combination with the Ehler’s ...
Nicolas Please open a new topic with the code in forum.
LucioleLucide Clean view, thanks for sharing
dertopen hi where i can found the window for candle configuration?
paolosab69 Ciao! . I have seen the pictures that explain this metod but i don't understand when is mome...
Marie-Eve Vergoz lorsque je copie les codes, le système me signale des erreurs à la ligne 12 et suivantes
Marie-Eve Vergoz sorry - tout est ok -
AlgoAlex
5 years ago
Marcot18 Alex ti sei superato
AlexF Esagerato!
Ciccio
5 years ago
Vinks_o_7 Apirine also offers a very interesting update of the OBV...
jobswaps Sube como trazar lineas de tendencias a tantas barras
Frankiesc interesting indicator !! Thanks for sharing!!!
robertogozzi Thank you :)
TACBOLSA
5 years ago
dario ti please can you help me to understand? i know i am wrong: Long Histogram = High Volume S...
TAC Bolsa hi, I have already seen the problem and requested that it be removed until an adequate so...
sixeight Hey TAC, Did you ever find a solution to this?
Vinks_o_7 b=close > low and volume > high How can we compare volume and high of the day? (orang...
TAC Bolsa If to understand something you resort to compare Oranges and bananas. You go bad, Without e...
giumagi good morning Sir, great job your indicators! How can I reach your website or blog? please..t...
JJ Tec Hola Las condiciones de entrada / salida vienen en el libro de J. Carter Mastering the trad...
Pixeldd Ich bekomme beim einfügen des Indikators einen Fehler angezeigt. Was bitte muss ich genau än...
HarryPro Hello, Firtly there appears to be a typo on line 6 "lenghkc=20" should this be "lengthkc=...

Top