Volume Profile 3D
Introduction
A volume profile shows where trading actually happened inside a price range. High-volume levels tend to act as magnets and support or resistance; thin levels are where price travels fast. The classic horizontal histogram does the job, but it is flat: every level looks alike until you read the bar lengths one by one.
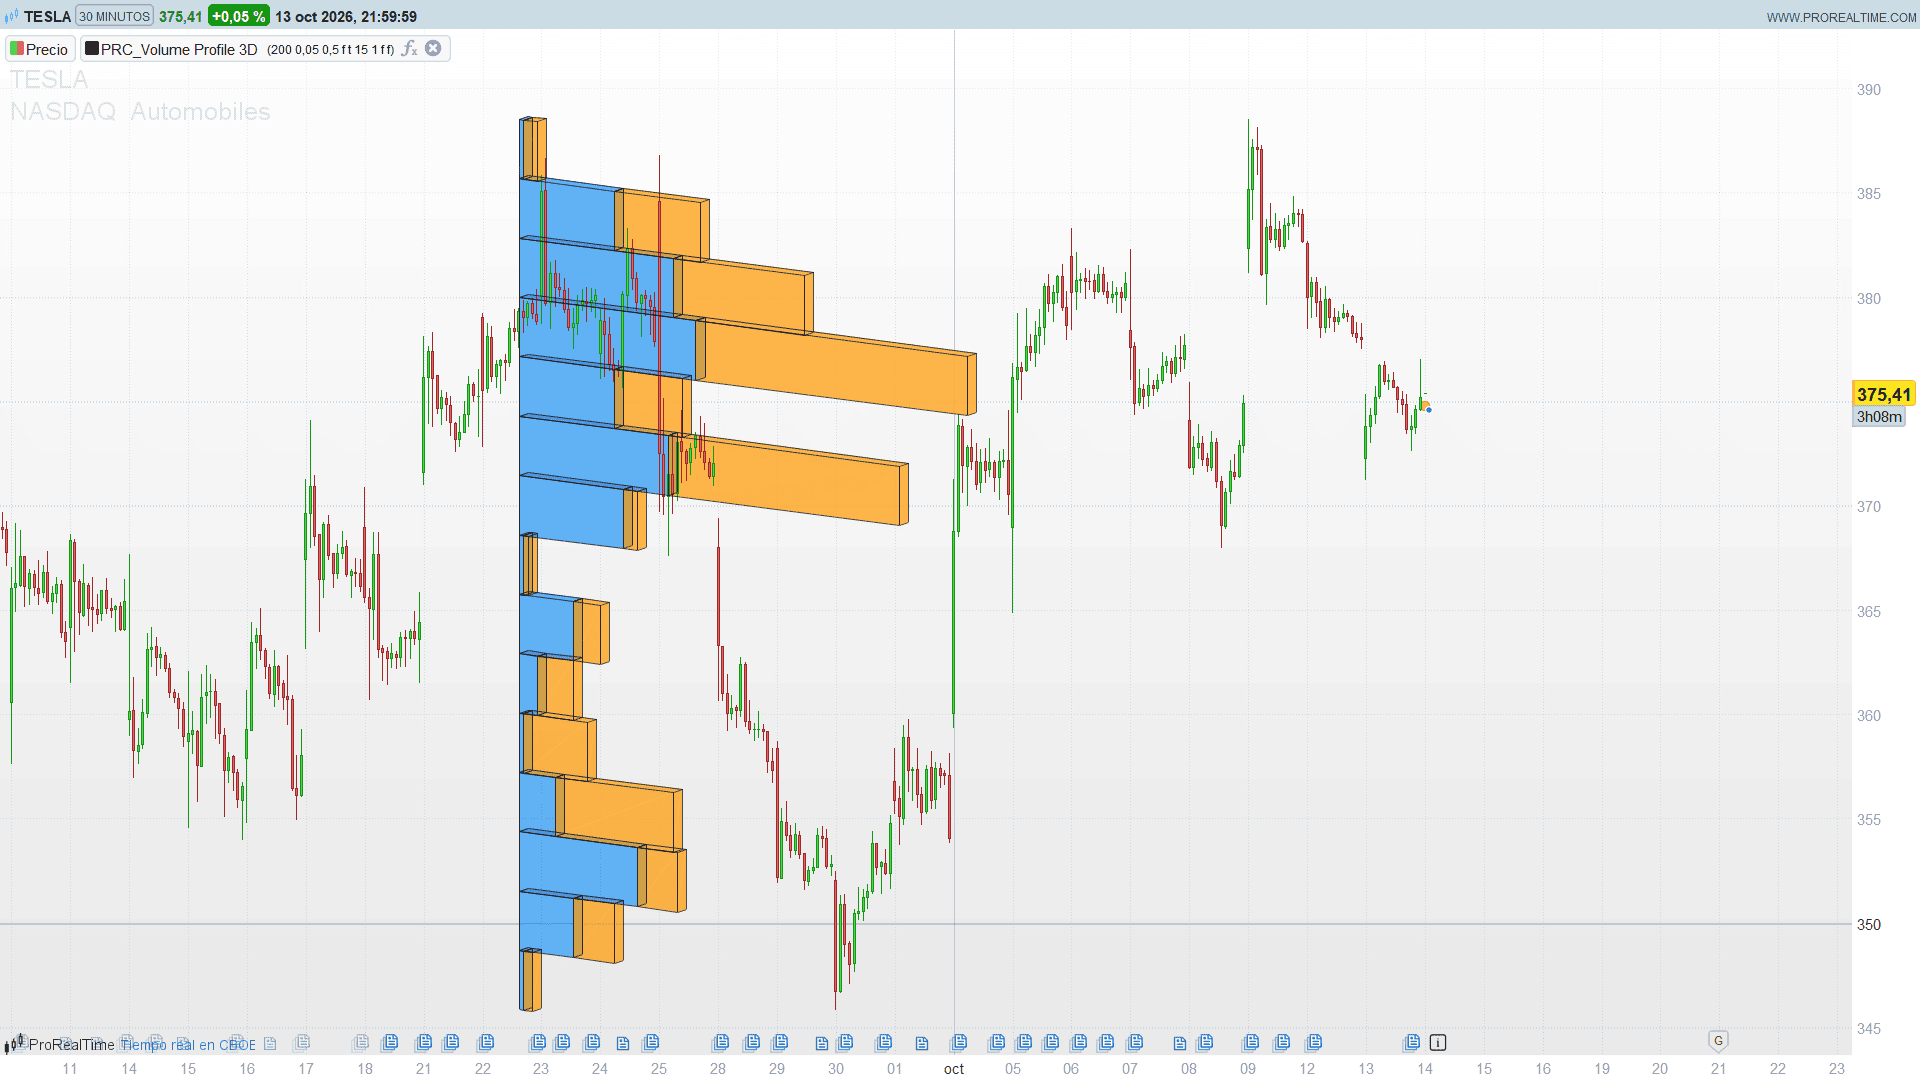
Volume Profile 3D by Zeiierman draws the same information as a set of solid blocks in perspective. Each price level becomes a small prism, its width proportional to the volume traded there, with bullish and bearish volume shown side by side. The depth effect makes the heavy levels stand out at a glance and, at the same time, tells you who built each level: buyers or sellers.
Theory Behind the Indicator
The indicator takes the most recent bars of the chart (200 by default) and splits the range between their highest high and lowest low into a fixed number of equal levels. Each bar contributes its volume to the level that contains its mid price, (high + low) / 2. A bar that closes above its open counts as bullish volume, a bar that closes below its open as bearish volume; doji bars are left out.
The width of each block is the volume of the level divided by the sum of the largest bullish and the largest bearish level, scaled to a fraction of the period length. So the widest blocks are always the dominant levels of the window, whatever the instrument.
The 3D look comes from simple geometry. The front face of every block is tilted by a common slope, and a depth face (on top when the tilt is positive, underneath when it is negative) plus a side face are added with an offset that grows with the tilt. The result is a profile that seems to come out of the chart.
Key Features at a Glance
- Volume profile of the last N bars, split into bullish and bearish volume per level.
- 3D blocks with adjustable tilt (forward or backward) and width.
- Aggregated mode: one block per level with the total volume.
- Bull/Bear shift: choose whether bullish or bearish volume comes first.
- Four colour templates or fully custom colours.
- Optional gradient: the more volume a level has, the more opaque it is drawn.
- Recalculated on every update of the last bar.
How to Read the Indicator
Look for the widest blocks first: those are the high-volume nodes of the period, the prices the market accepted. When price comes back to them it often slows down or reacts. Narrow blocks are low-volume nodes, areas the market went through quickly, and price tends to cross them fast again.
Then compare the colours inside each level. A level dominated by bullish volume was built mostly by rising bars, one dominated by bearish volume by falling bars. A heavy level with balanced colours is a level of agreement; a heavy level with one colour clearly dominant shows which side was in control while it was being built.
Practical Applications
- Support and resistance: use the heaviest levels as reference zones for entries, targets and stops.
- Breakout context: a breakout from a range into a thin area of the profile has room to run; a breakout into a heavy level often stalls.
- Session or swing reading: set the period to the length of the move you want to study (150 to 300 bars intraday, 500 to 1500 for swings).
- Who built the level: with the bull/bear split, check whether a support was built by buyers before trusting it.
Indicator Configuration
- prd (default 200): number of most recent bars included in the profile.
- devIn (default 0.05): tilt of the 3D effect, from -1 to 1. Positive values tilt forward (depth face on top), negative values tilt backward (depth face underneath). 0 draws flat blocks.
- mult (default 0.5): width of the profile relative to the period, from 0.1 to 1.
- agg (default 0): 1 draws one block per level with bullish and bearish volume together.
- shiftBB (default 1): 1 draws bullish volume first and bearish volume next to it; 0 reverses the order.
- buckets (default 15): number of price levels, from 1 to 100.
- colTemplate (default 1): 0 green/red, 1 blue/orange, 2 blue/purple, 3 teal/orange.
- gradient (default 0): 1 makes the transparency depend on the volume of each level.
- customCol (default 0): 1 uses the custom colours below instead of the template.
- cuBullR/G/B/A and cuBearR/G/B/A: custom bullish and bearish colours (RGB plus opacity from 0 to 255).
- lineR/G/B/A (default black, opacity 179): colour of the block edges.
The Code
//---------------------------------------------------------------
// PRC_Volume Profile 3D
// version = 0
// 14.10.2026
// Iván González @ www.prorealcode.com
// Author: Zeiierman
// Sharing ProRealTime knowledge
//--------------------------------------------------------------------//
defparam drawonlastbaronly = true
//----------------------------------------------
// === INPUTS ===
//----------------------------------------------
prd = 200               // Period: number of most recent bars in the profile (1-2500)
devIn = 0.05            // Up/Down 3D tilt (-1 to 1): positive tilts forward, negative backward
mult = 0.5              // Left/Right: width of the profile relative to the period (0.1-1)
agg = 0                 // 1 = one shape per level (bull + bear volume together)
shiftBB = 1             // 1 = bull and bear volume side by side (bull first)
buckets = 15            // Number of price levels (1-100)
colTemplate = 1         // 0 Green/Red, 1 Blue/Yellow, 2 Blue/Purple, 3 Teal/Yellow
gradient = 0            // 1 = transparency driven by the volume of each level
customCol = 0           // 1 = use the custom colours below
// custom colours (used when customCol = 1)
cuBullR = 33
cuBullG = 150
cuBullB = 243
cuBullA = 179
cuBearR = 255
cuBearG = 152
cuBearB = 0
cuBearA = 179
// edge colour of the shapes
lineR = 0
lineG = 0
lineB = 0
lineA = 179
//----------------------------------------------
// === COLOURS ===
//----------------------------------------------
IF customCol = 1 THEN
   c1R = cuBullR
   c1G = cuBullG
   c1B = cuBullB
   c1A = cuBullA
   c2R = cuBearR
   c2G = cuBearG
   c2B = cuBearB
   c2A = cuBearA
ELSE
   c1A = 179
   c2A = 179
   IF colTemplate = 0 THEN
      c1R = 0
      c1G = 230
      c1B = 118
      c2R = 242
      c2G = 54
      c2B = 69
   ELSIF colTemplate = 2 THEN
      c1R = 33
      c1G = 150
      c1B = 243
      c2R = 156
      c2G = 39
      c2B = 176
   ELSIF colTemplate = 3 THEN
      c1R = 8
      c1G = 153
      c1B = 129
      c2R = 255
      c2G = 152
      c2B = 0
   ELSE
      c1R = 33
      c1G = 150
      c1B = 243
      c2R = 255
      c2G = 152
      c2B = 0
   ENDIF
ENDIF
//----------------------------------------------
// === PROFILE ON THE LAST BAR ===
//----------------------------------------------
IF islastbarupdate AND barindex >= prd THEN
   dev = devIn * 10
   b = barindex
   s = barindex - prd
   vTop = highest[prd](high)
   vBot = lowest[prd](low)
   step = (vTop - vBot) / buckets

   IF step > 0 THEN
      // price levels: buckets + 1 edges
      FOR k = 0 TO buckets DO
         $lvl[k] = vBot + k * step
      NEXT
      FOR k = 0 TO buckets - 1 DO
         $bu[k] = 0
         $be[k] = 0
      NEXT

      // volume of each bar into the level that holds its mid price
      // (bullish if close > open, bearish if close < open, dojis are skipped)
      FOR j = 0 TO prd - 1 DO
         mid = (high[j] + low[j]) / 2
         IF mid >= $lvl[0] AND mid < $lvl[buckets] THEN
            bk = floor((mid - vBot) / step)
            bk = min(max(bk, 0), buckets - 1)
            WHILE bk > 0 AND mid < $lvl[bk] DO
               bk = bk - 1
            WEND
            WHILE bk < buckets - 1 AND mid >= $lvl[bk + 1] DO
               bk = bk + 1
            WEND
            IF close[j] > open[j] THEN
               $bu[bk] = $bu[bk] + volume[j]
            ELSIF close[j] < open[j] THEN
               $be[bk] = $be[bk] + volume[j]
            ENDIF
         ENDIF
      NEXT

      maxBu = 0
      maxBe = 0
      FOR k = 0 TO buckets - 1 DO
         maxBu = max(maxBu, $bu[k])
         maxBe = max(maxBe, $be[k])
      NEXT
      maxVol = maxBu + maxBe

      IF maxVol > 0 THEN
         // 3D geometry shared by every level
         slope = 0 - (step * dev) / ((b - s) * (mult / 2))
         factor = sqrt(min(1, abs(slope) / step))
         dx = floor((b - s) * factor * 0.1)

         FOR k = 0 TO buckets - 1 DO
            IF agg = 1 THEN
               vv = $bu[k] + $be[k]
            ELSIF shiftBB = 1 THEN
               vv = $bu[k]
            ELSE
               vv = $be[k]
            ENDIF
            IF shiftBB = 1 THEN
               vvv = $be[k]
            ELSE
               vvv = $bu[k]
            ENDIF

            // colours of this level (gradient: more volume, more opaque)
            IF gradient = 1 THEN
               gf = min(1, max(0, (vv + vvv) / maxVol))
               gTr = round(90 * (1 - gf) + 10 * gf)
               ga1 = round(255 * (100 - gTr) / 100)
               ga2 = ga1
            ELSE
               ga1 = c1A
               ga2 = c2A
            ENDIF

            p1 = $lvl[k]
            p2 = $lvl[k + 1]
            w = max(1, floor(vv / maxVol * ((b - s) * mult)))
            xr = s + w + max(1, floor(vvv / maxVol * ((b - s) * mult)))
            yy = abs(p2 - p1) * factor * 0.5
            IF dev < 0 THEN
               yy = 0 - yy
            ENDIF

            // two boxes per level: q = 0 first box (from s), q = 1 second box (next to it)
            IF agg = 1 THEN
               nBox = 0
            ELSE
               nBox = 1
            ENDIF
            FOR q = 0 TO nBox DO
               IF q = 0 THEN
                  xa = s
                  xb = s + w
                  oa = 0
                  ob = slope * w
                  IF agg = 1 OR shiftBB = 1 THEN
                     fr = c1R
                     fg = c1G
                     fb = c1B
                     fa = ga1
                  ELSE
                     fr = c2R
                     fg = c2G
                     fb = c2B
                     fa = ga2
                  ENDIF
               ELSE
                  xa = s + w
                  xb = xr
                  oa = slope * w
                  ob = slope * (xr - s)
                  IF shiftBB = 1 THEN
                     fr = c2R
                     fg = c2G
                     fb = c2B
                     fa = ga2
                  ELSE
                     fr = c1R
                     fg = c1G
                     fb = c1B
                     fa = ga1
                  ENDIF
               ENDIF

               // front face
               DRAWTRIANGLE(xa, p1 + oa, xa, p2 + oa, xb, p2 + ob) COLOURED(fr, fg, fb, 0) FILLCOLOR(fr, fg, fb, fa)
               DRAWTRIANGLE(xa, p1 + oa, xb, p2 + ob, xb, p1 + ob) COLOURED(fr, fg, fb, 0) FILLCOLOR(fr, fg, fb, fa)
               DRAWSEGMENT(xa, p1 + oa, xa, p2 + oa) COLOURED(lineR, lineG, lineB, lineA)
               DRAWSEGMENT(xa, p2 + oa, xb, p2 + ob) COLOURED(lineR, lineG, lineB, lineA)
               DRAWSEGMENT(xb, p2 + ob, xb, p1 + ob) COLOURED(lineR, lineG, lineB, lineA)
               DRAWSEGMENT(xb, p1 + ob, xa, p1 + oa) COLOURED(lineR, lineG, lineB, lineA)

               IF dev <> 0 THEN
                  // depth faces: the cap is the top face when tilted forward, the bottom one when tilted back
                  IF dev > 0 THEN
                     cy = p2
                  ELSE
                     cy = p1
                  ENDIF
                  DRAWTRIANGLE(xa, cy + oa, xa + dx, cy + oa + yy, xb + dx, cy + ob + yy) COLOURED(fr, fg, fb, 0) FILLCOLOR(fr, fg, fb, fa)
                  DRAWTRIANGLE(xa, cy + oa, xb + dx, cy + ob + yy, xb, cy + ob) COLOURED(fr, fg, fb, 0) FILLCOLOR(fr, fg, fb, fa)
                  DRAWTRIANGLE(xb, p1 + ob, xb, p2 + ob, xb + dx, p2 + ob + yy) COLOURED(fr, fg, fb, 0) FILLCOLOR(fr, fg, fb, fa)
                  DRAWTRIANGLE(xb, p1 + ob, xb + dx, p2 + ob + yy, xb + dx, p1 + ob + yy) COLOURED(fr, fg, fb, 0) FILLCOLOR(fr, fg, fb, fa)
                  DRAWSEGMENT(xa, cy + oa, xa + dx, cy + oa + yy) COLOURED(lineR, lineG, lineB, lineA)
                  DRAWSEGMENT(xa + dx, cy + oa + yy, xb + dx, cy + ob + yy) COLOURED(lineR, lineG, lineB, lineA)
                  DRAWSEGMENT(xb + dx, cy + ob + yy, xb, cy + ob) COLOURED(lineR, lineG, lineB, lineA)
                  DRAWSEGMENT(xb + dx, p2 + ob + yy, xb + dx, p1 + ob + yy) COLOURED(lineR, lineG, lineB, lineA)
                  IF dev > 0 THEN
                     DRAWSEGMENT(xb + dx, p1 + ob + yy, xb, p1 + ob) COLOURED(lineR, lineG, lineB, lineA)
                  ELSE
                     DRAWSEGMENT(xb + dx, p2 + ob + yy, xb, p2 + ob) COLOURED(lineR, lineG, lineB, lineA)
                  ENDIF
               ENDIF
            NEXT
         NEXT
      ENDIF
   ENDIF
ENDIF

RETURN
Conclusion
Volume Profile 3D does not add new information to a classic profile, but it changes how fast you read it. The perspective puts the heavy levels in front of you, and the bullish and bearish split shows who built them. Use it on the window that matters for your trade, and combine it with price action at the highlighted levels.