FVG Profile + Rolling POC
Introduction
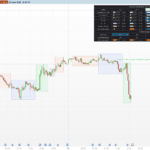
A fair value gap is a three-candle imbalance: the market moved so fast that the wick of the first candle and the wick of the third one do not overlap, leaving a price zone where only one side traded. Traders who follow order flow and Smart Money Concepts watch these zones because price often comes back to them.
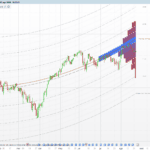
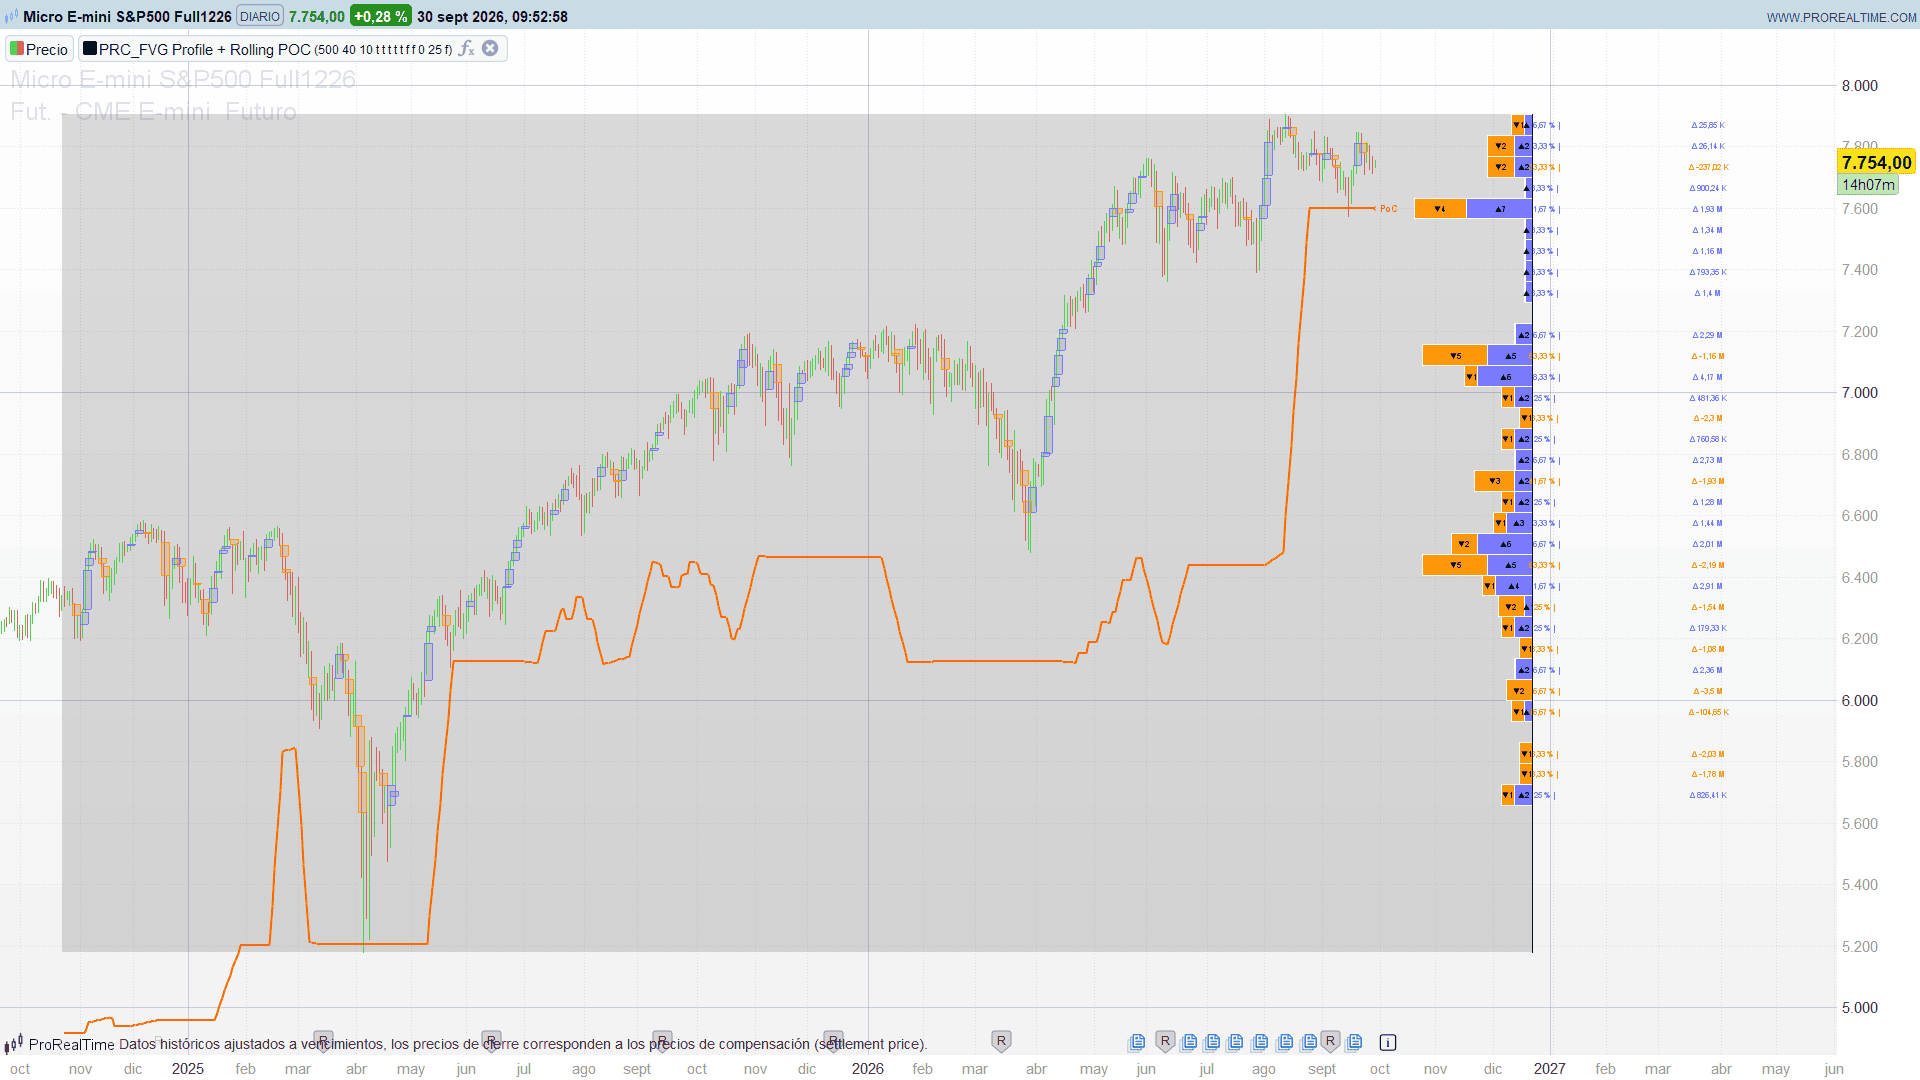
Looking at gaps one by one tells you little about where they concentrate. FVG Profile + Rolling POC, by BigBeluga, turns them into a profile: it counts every bullish and bearish gap of the last 500 bars by price level, draws the result as horizontal bars to the right of the chart, and tracks the level with the most gap activity as a rolling point of control (POC).
Theory Behind the Indicator
Detecting the gaps
- Bullish gap: the low of the current bar is above the high of the bar two positions earlier. The gap is the zone between them.
- Bearish gap: the high of the current bar is below the low of the bar two positions earlier.
Each gap is summarised by its midpoint.
Building the profile
The high-low range of the last 500 bars is split into 40 equal price rows. Every gap is assigned to the row that contains its midpoint, and the indicator keeps four numbers per row: the number of bullish gaps, the number of bearish gaps, and the volume of the middle candle of each type of gap. The middle candle is the one that created the imbalance, so its volume measures how much trading went into the move.
For each row with at least one gap, the profile shows:
- A bullish bar (lime) and a bearish bar (orange) whose lengths are proportional to the count, relative to the busiest bullish and the busiest bearish row.
- The activity percentage: the gaps of the row divided by the sum of the busiest bullish and busiest bearish rows.
- The volume delta: volume of bullish gaps minus volume of bearish gaps, abbreviated in K, M or B.
The rolling POC
On every bar, the indicator repeats the count over the previous 500 bars and takes the centre of the busiest row. That level is smoothed with a 10-bar average and drawn as an orange line over the last 500 bars, with a “< PoC” label on the current bar. Where the POC moves, the area that the market has repeatedly left unbalanced has shifted.
Key Features at a Glance
- Automatic detection of bullish and bearish fair value gaps, drawn as boxes on the chart
- 40-row profile of gap counts to the right of the price, split into bullish and bearish bars
- Activity percentage and volume delta for each row, coloured by the sign of the delta
- Rolling point of control recomputed on every bar and smoothed over 10 bars
- Optional heatmap that shades each price row across the whole lookback by its activity
- Optional moving average (SMA, EMA, SMMA, WMA or VWMA), with a fixed or automatic length
- Light and dark chart modes for the text and outline colours
How to Read the Indicator
- Long bullish bars mark the price levels where the market repeatedly moved up too fast to fill the gap. These are the areas that buyers left behind.
- Long bearish bars mark the opposite: levels where sellers pushed the price down leaving imbalances.
- The activity percentage ranks the rows: the higher it is, the more gaps of both types sit at that level.
- The volume delta tells you which side put more volume into the gaps at that level. A green delta means the bullish gaps carried more volume; an orange one, the bearish gaps.
- The rolling POC is the level with the most gap activity. Price above the POC is trading above the main imbalance zone; a POC that migrates higher over time shows that the area of imbalance is moving with the trend.
Practical Applications
- Mapping reaction zones. Rows with high activity show where imbalances have piled up. Combined with your usual structure analysis, they point to levels worth watching when price returns.
- Reading the side in control. A price level dominated by bullish gaps with a positive delta, or by bearish gaps with a negative one, tells you who created most of the imbalance there.
- Context for mean reversion. The distance between price and the rolling POC shows how far the market has moved from its main imbalance area.
Fair value gaps are descriptive: the profile shows where the market left imbalances, not whether or when they will be revisited.
Indicator Configuration
period(default: 500): number of bars analysed for fair value gaps.binSize(default: 40): number of price rows in the profile. More rows give more detail and thinner rows.profOffset(default: 10): extra distance, in bars, between the last candle and the profile.displayFVG(default: 1): draw every fair value gap as a box on the chart.displayPer(default: 1): show the activity percentage of each row.showPOC(default: 1): rolling POC line.displayDelta(default: 1): show the volume delta of each row.displayQty(default: 1): show the bullish and bearish gap counts inside the profile bars.heatMap(default: 0): shade each row across the lookback by its activity.darkMode(default: 0): set to 1 on a dark chart background.maType(default: 0): optional moving average. 0 = none, 1 = SMA, 2 = EMA, 3 = SMMA (RMA), 4 = WMA, 5 = VWMA.maLen(default: 25): length of the moving average.autoLength(default: 0): with 1, the length restarts at 3 at the start of the lookback and grows by one each bar, so the average is anchored to the first bar of the profile.- Colours:
bullR/G/B,bearR/G/B,bgR/G/BandbgA,pocR/G/B,maR/G/B.
Apply the indicator on the price chart. The profile and the lines are redrawn on the last bar, and the calculation covers the last 5,000 bars. Leave some empty space to the right of the chart so the profile (placed 60 bars after the last candle by default) is visible.
Code
//---------------------------------------------------------------
// PRC_FVG Profile + Rolling POC
// version = 0
// 30.09.2026
// Iván González @ www.prorealcode.com
// Author: BigBeluga
// Sharing ProRealTime knowledge
//--------------------------------------------------------------------//
// Apply it on the price chart.
// Profile of the fair value gaps of the last "period" bars, drawn to the right of the price,
// plus a rolling point of control (the price bin with the most gaps, recomputed on every bar).
DEFPARAM DRAWONLASTBARONLY = true
DEFPARAM CALCULATEONLASTBARS = 5000

//----- Parameters
period = 500           // bars analysed for fair value gaps
binSize = 40           // number of price rows of the profile
profOffset = 10        // extra bars between the last candle and the profile
displayFVG = 1         // 1 = draw every fair value gap box on the chart
displayPer = 1         // 1 = show the activity percentage of each row
showPOC = 1            // 1 = rolling POC line
displayDelta = 1       // 1 = show the volume delta (bullish - bearish gaps) of each row
displayQty = 1         // 1 = show the bullish / bearish gap count inside the profile bars
heatMap = 0            // 1 = shade each row across the lookback by its gap activity
darkMode = 0           // 1 = dark chart background (text and outline colours), 0 = light

//----- Moving average (optional)
maType = 0             // 0 = none, 1 = SMA, 2 = EMA, 3 = SMMA (RMA), 4 = WMA, 5 = VWMA
maLen = 25             // length of the moving average
autoLength = 0         // 1 = the length grows from 3, starting "period" bars before the last one
src = customclose      // source of the moving average

//----- Colours
bullR = 120              // bullish gaps and positive delta
bullG = 120
bullB = 255
bearR = 255            // bearish gaps and negative delta (orange)
bearG = 152
bearB = 0
bgR = 73               // background of the profile area
bgG = 73
bgB = 73
bgA = 51
pocR = 255             // rolling POC
pocG = 102
pocB = 0
maR = 255              // moving average (yellow)
maG = 235
maB = 59
IF darkMode = 1 THEN
   fgR = 255
   fgG = 255
   fgB = 255
   cbR = 0
   cbG = 0
   cbB = 0
ELSE
   fgR = 0
   fgG = 0
   fgB = 0
   cbR = 255
   cbG = 255
   cbB = 255
ENDIF

//----- Rolling POC, recomputed on every bar
// every gap of the last "period" bars is counted in the bin of its midpoint, over the
// high-low range of the same bars; the POC is the centre of the busiest bin
rollOk = 0
rollPoc = 0
IF showPOC = 1 AND barindex >= period - 1 THEN
   hiP = highest[period](high)
   loP = lowest[period](low)
   stp = (hiP - loP) / binSize
   FOR k = 0 TO binSize - 1 DO
      $cnt[k] = 0
   NEXT
   IF stp > 0 THEN
      FOR i = 0 TO period - 1 DO
         IF barindex >= i + 2 THEN
            IF high[i + 2] < low[i] THEN
               avgP = (high[i + 2] + low[i]) / 2
               bi = floor((avgP - loP) / stp)
               IF bi >= 0 AND bi < binSize THEN
                  $cnt[bi] = $cnt[bi] + 1
               ENDIF
            ENDIF
            IF low[i + 2] > high[i] THEN
               avgP = (low[i + 2] + high[i]) / 2
               bi = floor((avgP - loP) / stp)
               IF bi >= 0 AND bi < binSize THEN
                  $cnt[bi] = $cnt[bi] + 1
               ENDIF
            ENDIF
         ENDIF
      NEXT
      maxAct = 0
      pocIdx = 0
      FOR k = 0 TO binSize - 1 DO
         IF $cnt[k] > maxAct THEN
            maxAct = $cnt[k]
            pocIdx = k
         ENDIF
      NEXT
      IF maxAct > 0 THEN
         rollPoc = loP + stp * pocIdx + stp / 2
         rollOk = 1
      ENDIF
   ENDIF
ENDIF
// 10-bar average of the rolling POC, only when the 10 values exist
pocOk = 0
pocVal = 0
IF barindex >= 9 THEN
   IF summation[10](rollOk) = 10 THEN
      pocOk = 1
      pocVal = summation[10](rollPoc) / 10
   ENDIF
ENDIF
$pocV[barindex] = pocVal
$pocF[barindex] = pocOk

//----- Moving average with a fixed length (series, stored per bar)
IF maType = 1 THEN
   maOk = 0
   maVal = 0
   IF barindex >= maLen - 1 THEN
      maOk = 1
      maVal = average[maLen](src)
   ENDIF
ELSIF maType = 2 THEN
   IF barindex = 0 THEN
      emaF = src
   ELSE
      emaF = 2 / (maLen + 1) * src + (1 - 2 / (maLen + 1)) * emaF[1]
   ENDIF
   maOk = 1
   maVal = emaF
ELSIF maType = 3 THEN
   maOk = 0
   maVal = 0
   IF barindex = maLen - 1 THEN
      rmaF = average[maLen](src)
   ELSIF barindex > maLen - 1 THEN
      rmaF = src / maLen + (1 - 1 / maLen) * rmaF[1]
   ELSE
      rmaF = 0
   ENDIF
   IF barindex >= maLen - 1 THEN
      maOk = 1
      maVal = rmaF
   ENDIF
ELSIF maType = 4 THEN
   maOk = 0
   maVal = 0
   IF barindex >= maLen - 1 THEN
      maOk = 1
      maVal = average[maLen, 2](src)
   ENDIF
ELSIF maType = 5 THEN
   maOk = 0
   maVal = 0
   IF barindex >= maLen - 1 THEN
      vSum = summation[maLen](volume)
      IF vSum > 0 THEN
         maOk = 1
         maVal = summation[maLen](src * volume) / vSum
      ENDIF
   ENDIF
ELSE
   maOk = 0
   maVal = 0
ENDIF
$maV[barindex] = maVal
$maF[barindex] = maOk

// EMA with the automatic length before its reset: the length is barindex + 3
IF barindex = 0 THEN
   emaPre = src
ELSE
   emaPre = 2 / (barindex + 4) * src + (1 - 2 / (barindex + 4)) * emaPre[1]
ENDIF

//----- Last bar: fair value gaps, profile, POC and moving average
IF islastbarupdate THEN
   pMax = highest[period](high)
   pMin = lowest[period](low)
   stepP = (pMax - pMin) / binSize
   FOR k = 0 TO binSize - 1 DO
      $bullGaps[k] = 0
      $bearGaps[k] = 0
      $bullVol[k] = 0
      $bearVol[k] = 0
   NEXT

   FOR i = 0 TO period - 1 DO
      IF barindex >= i + 2 THEN
         // bullish gap: the low of this bar is above the high of two bars earlier
         IF high[i + 2] < low[i] THEN
            IF displayFVG = 1 THEN
               DRAWRECTANGLE(barindex - i - 2, high[i + 2], barindex - i + 1, low[i]) COLOURED(bullR, bullG, bullB, 230) FILLCOLOR(bullR, bullG, bullB, 51)
            ENDIF
            IF stepP > 0 THEN
               avgB = (high[i + 2] + low[i]) / 2
               kc = floor((avgB - pMin) / stepP)
               FOR kk = kc - 1 TO kc + 1 DO
                  IF kk >= 0 AND kk < binSize THEN
                     lvl = pMin + stepP * kk + stepP / 2
                     IF abs(avgB - lvl) < stepP / 2 THEN
                        $bullGaps[kk] = $bullGaps[kk] + 1
                        $bullVol[kk] = $bullVol[kk] + volume[i + 1]
                     ENDIF
                  ENDIF
               NEXT
            ENDIF
         ENDIF
         // bearish gap: the high of this bar is below the low of two bars earlier
         IF low[i + 2] > high[i] THEN
            IF displayFVG = 1 THEN
               DRAWRECTANGLE(barindex - i - 2, low[i + 2], barindex - i + 1, high[i]) COLOURED(bearR, bearG, bearB, 230) FILLCOLOR(bearR, bearG, bearB, 51)
            ENDIF
            IF stepP > 0 THEN
               avgS = (low[i + 2] + high[i]) / 2
               kc = floor((avgS - pMin) / stepP)
               FOR kk = kc - 1 TO kc + 1 DO
                  IF kk >= 0 AND kk < binSize THEN
                     lvl = pMin + stepP * kk + stepP / 2
                     IF abs(avgS - lvl) < stepP / 2 THEN
                        $bearGaps[kk] = $bearGaps[kk] + 1
                        $bearVol[kk] = $bearVol[kk] + volume[i + 1]
                     ENDIF
                  ENDIF
               NEXT
            ENDIF
         ENDIF
      ENDIF
   NEXT

   bullMax = 0
   bearMax = 0
   FOR k = 0 TO binSize - 1 DO
      bullMax = max(bullMax, $bullGaps[k])
      bearMax = max(bearMax, $bearGaps[k])
   NEXT
   maxActP = bullMax + bearMax
   xProf = barindex + 50 + profOffset

   // background of the profile area, from the start of the lookback to the profile axis
   DRAWRECTANGLE(barindex - period, pMax, xProf, pMin) COLOURED(bgR, bgG, bgB, 0) FILLCOLOR(bgR, bgG, bgB, bgA)

   FOR k = 0 TO binSize - 1 DO
      rowLo = pMin + stepP * k
      rowHi = rowLo + stepP
      rowMid = (rowLo + rowHi) / 2
      bc = $bullGaps[k]
      sc = $bearGaps[k]
      IF bc <> 0 OR sc <> 0 THEN
         bullW = floor(bc / max(1, bullMax) * 25)
         bearW = floor(sc / max(1, bearMax) * 25)
         tot = (bc + sc) / max(1, maxActP) * 100
         delta = $bullVol[k] - $bearVol[k]
         IF delta > 0 THEN
            txR = bullR
            txG = bullG
            txB = bullB
         ELSE
            txR = bearR
            txG = bearG
            txB = bearB
         ENDIF

         IF heatMap = 1 THEN
            hmA = round(127 * tot / 100)
            hmR = round(fgR * tot / 100)
            hmG = round(fgG * tot / 100)
            hmB = round(fgB * tot / 100)
            DRAWRECTANGLE(barindex - period, rowHi, xProf, rowLo) COLOURED(hmR, hmG, hmB, 0) FILLCOLOR(hmR, hmG, hmB, hmA)
         ENDIF

         // bullish count bar grows left from the axis, bearish bar continues after it
         xBull = xProf - bullW
         xBear = xBull - bearW
         DRAWRECTANGLE(xProf, rowHi, xBull, rowLo) COLOURED(cbR, cbG, cbB, 255) FILLCOLOR(bullR, bullG, bullB, 255)
         DRAWRECTANGLE(xBull, rowHi, xBear, rowLo) COLOURED(cbR, cbG, cbB, 255) FILLCOLOR(bearR, bearG, bearB, 255)
         IF displayQty = 1 THEN
            IF bc > 0 THEN
               DRAWTEXT("▲#bc#", (xProf + xBull) / 2, rowMid, SansSerif, Standard, 8) COLOURED(0, 0, 0, 255)
            ENDIF
            IF sc > 0 THEN
               DRAWTEXT("▼#sc#", (xBull + xBear) / 2, rowMid, SansSerif, Standard, 8) COLOURED(0, 0, 0, 255)
            ENDIF
         ENDIF

         // activity of the row, in % of the busiest bullish row + busiest bearish row
         IF displayPer = 1 THEN
            totTxt = round(tot * 100) / 100
            DRAWTEXT("#totTxt#% |", xProf + 5, rowMid, SansSerif, Standard, 8) COLOURED(txR, txG, txB, 255)
         ENDIF

         // volume delta of the row (volume of the middle bar of each gap)
         IF displayDelta = 1 THEN
            IF displayPer = 1 THEN
               xDelta = xProf + 67
            ELSE
               xDelta = xProf + 55
            ENDIF
            dAbs = abs(delta)
            IF dAbs >= 1000000000 THEN
               dTxt = round(delta / 10000000) / 100
               DRAWTEXT("Δ #dTxt#B", xDelta, rowMid, SansSerif, Standard, 8) COLOURED(txR, txG, txB, 255)
            ELSIF dAbs >= 1000000 THEN
               dTxt = round(delta / 10000) / 100
               DRAWTEXT("Δ #dTxt#M", xDelta, rowMid, SansSerif, Standard, 8) COLOURED(txR, txG, txB, 255)
            ELSIF dAbs >= 1000 THEN
               dTxt = round(delta / 10) / 100
               DRAWTEXT("Δ #dTxt#K", xDelta, rowMid, SansSerif, Standard, 8) COLOURED(txR, txG, txB, 255)
            ELSE
               dTxt = round(delta)
               DRAWTEXT("Δ #dTxt#", xDelta, rowMid, SansSerif, Standard, 8) COLOURED(txR, txG, txB, 255)
            ENDIF
         ENDIF
      ENDIF
   NEXT

   // profile axis
   DRAWSEGMENT(xProf, pMax, xProf, pMin) COLOURED(fgR, fgG, fgB, 255)

   // rolling POC over the last "period" bars, broken where it has no value
   IF showPOC = 1 THEN
      FOR j = period - 1 DOWNTO 1 DO
         IF barindex - j >= 0 THEN
            xa = barindex - j
            IF $pocF[xa] = 1 AND $pocF[xa + 1] = 1 THEN
               DRAWSEGMENT(xa, $pocV[xa], xa + 1, $pocV[xa + 1]) COLOURED(pocR, pocG, pocB, 255) STYLE(line, 2)
            ENDIF
         ENDIF
      NEXT
      IF pocOk = 1 THEN
         DRAWTEXT("< PoC", barindex + 4, pocVal, SansSerif, Standard, 9) COLOURED(pocR, pocG, pocB, 255)
      ENDIF
   ENDIF

   // moving average over the last "period" bars
   IF maType > 0 THEN
      FOR j = 0 TO period - 1 DO
         $maD[j] = 0
         $maDF[j] = 0
      NEXT
      IF autoLength = 0 THEN
         FOR j = 0 TO period - 1 DO
            IF barindex - j >= 0 THEN
               $maD[j] = $maV[barindex - j]
               $maDF[j] = $maF[barindex - j]
            ENDIF
         NEXT
         lenShow = maLen
      ELSE
         // automatic length: it restarts at 3 "period" bars before the last bar and grows by 1
         // per bar, so on offset j it is period - j + 3 and every window starts on offset period + 2
         lenShow = period + 3
         IF barindex >= period + 2 THEN
            IF maType = 1 OR maType = 4 OR maType = 5 THEN
               sSrc = 0
               sW = 0
               sVol = 0
               sVolSrc = 0
               FOR j = period + 2 DOWNTO 0 DO
                  sSrc = sSrc + src[j]
                  sW = sW + (period + 3 - j) * src[j]
                  sVol = sVol + volume[j]
                  sVolSrc = sVolSrc + src[j] * volume[j]
                  IF j <= period - 1 THEN
                     lenJ = period - j + 3
                     IF maType = 1 THEN
                        $maD[j] = sSrc / lenJ
                        $maDF[j] = 1
                     ELSIF maType = 4 THEN
                        $maD[j] = sW / (lenJ * (lenJ + 1) / 2)
                        $maDF[j] = 1
                     ELSIF sVol > 0 THEN
                        $maD[j] = sVolSrc / sVol
                        $maDF[j] = 1
                     ENDIF
                  ENDIF
               NEXT
            ELSIF maType = 2 THEN
               // EMA: continues from the value of the bar before the reset
               eAuto = emaPre[period + 1]
               FOR j = period DOWNTO 0 DO
                  lenJ = period - j + 3
                  eAuto = 2 / (lenJ + 1) * src[j] + (1 - 2 / (lenJ + 1)) * eAuto
                  IF j <= period - 1 THEN
                     $maD[j] = eAuto
                     $maDF[j] = 1
                  ENDIF
               NEXT
            ELSE
               // RMA: before the reset it has no value, so it restarts from the 3-bar average
               rAuto = (src[period] + src[period + 1] + src[period + 2]) / 3
               FOR j = period - 1 DOWNTO 0 DO
                  lenJ = period - j + 3
                  rAuto = src[j] / lenJ + (1 - 1 / lenJ) * rAuto
                  $maD[j] = rAuto
                  $maDF[j] = 1
               NEXT
            ENDIF
         ENDIF
      ENDIF
      FOR j = period - 1 DOWNTO 1 DO
         IF $maDF[j] = 1 AND $maDF[j - 1] = 1 THEN
            DRAWSEGMENT(barindex - j, $maD[j], barindex - j + 1, $maD[j - 1]) COLOURED(maR, maG, maB, 255)
         ENDIF
      NEXT
      IF $maDF[0] = 1 THEN
         maLast = $maD[0]
         IF maType = 1 THEN
            DRAWTEXT("SMA: #lenShow#", barindex + 6, maLast, SansSerif, Standard, 9) COLOURED(maR, maG, maB, 255)
         ELSIF maType = 2 THEN
            DRAWTEXT("EMA: #lenShow#", barindex + 6, maLast, SansSerif, Standard, 9) COLOURED(maR, maG, maB, 255)
         ELSIF maType = 3 THEN
            DRAWTEXT("SMMA (RMA): #lenShow#", barindex + 8, maLast, SansSerif, Standard, 9) COLOURED(maR, maG, maB, 255)
         ELSIF maType = 4 THEN
            DRAWTEXT("WMA: #lenShow#", barindex + 6, maLast, SansSerif, Standard, 9) COLOURED(maR, maG, maB, 255)
         ELSE
            DRAWTEXT("VWMA: #lenShow#", barindex + 6, maLast, SansSerif, Standard, 9) COLOURED(maR, maG, maB, 255)
         ENDIF
      ENDIF
   ENDIF
ENDIF

RETURN
Conclusion
FVG Profile + Rolling POC takes a concept that is usually read candle by candle and aggregates it by price. The result is a map of where the market has left imbalances over the last 500 bars, which side created them and how much volume went into them, plus a rolling POC that follows the main imbalance level through time.