







Session Edge Profiler: Which Trading Session Really Moves Your Market?
Introduction
Intraday traders talk about sessions all the time: London sets the high of the day, New York lunch is dead, Asia is a range. These statements are sometimes true and sometimes folklore, and they change from one instrument to another.
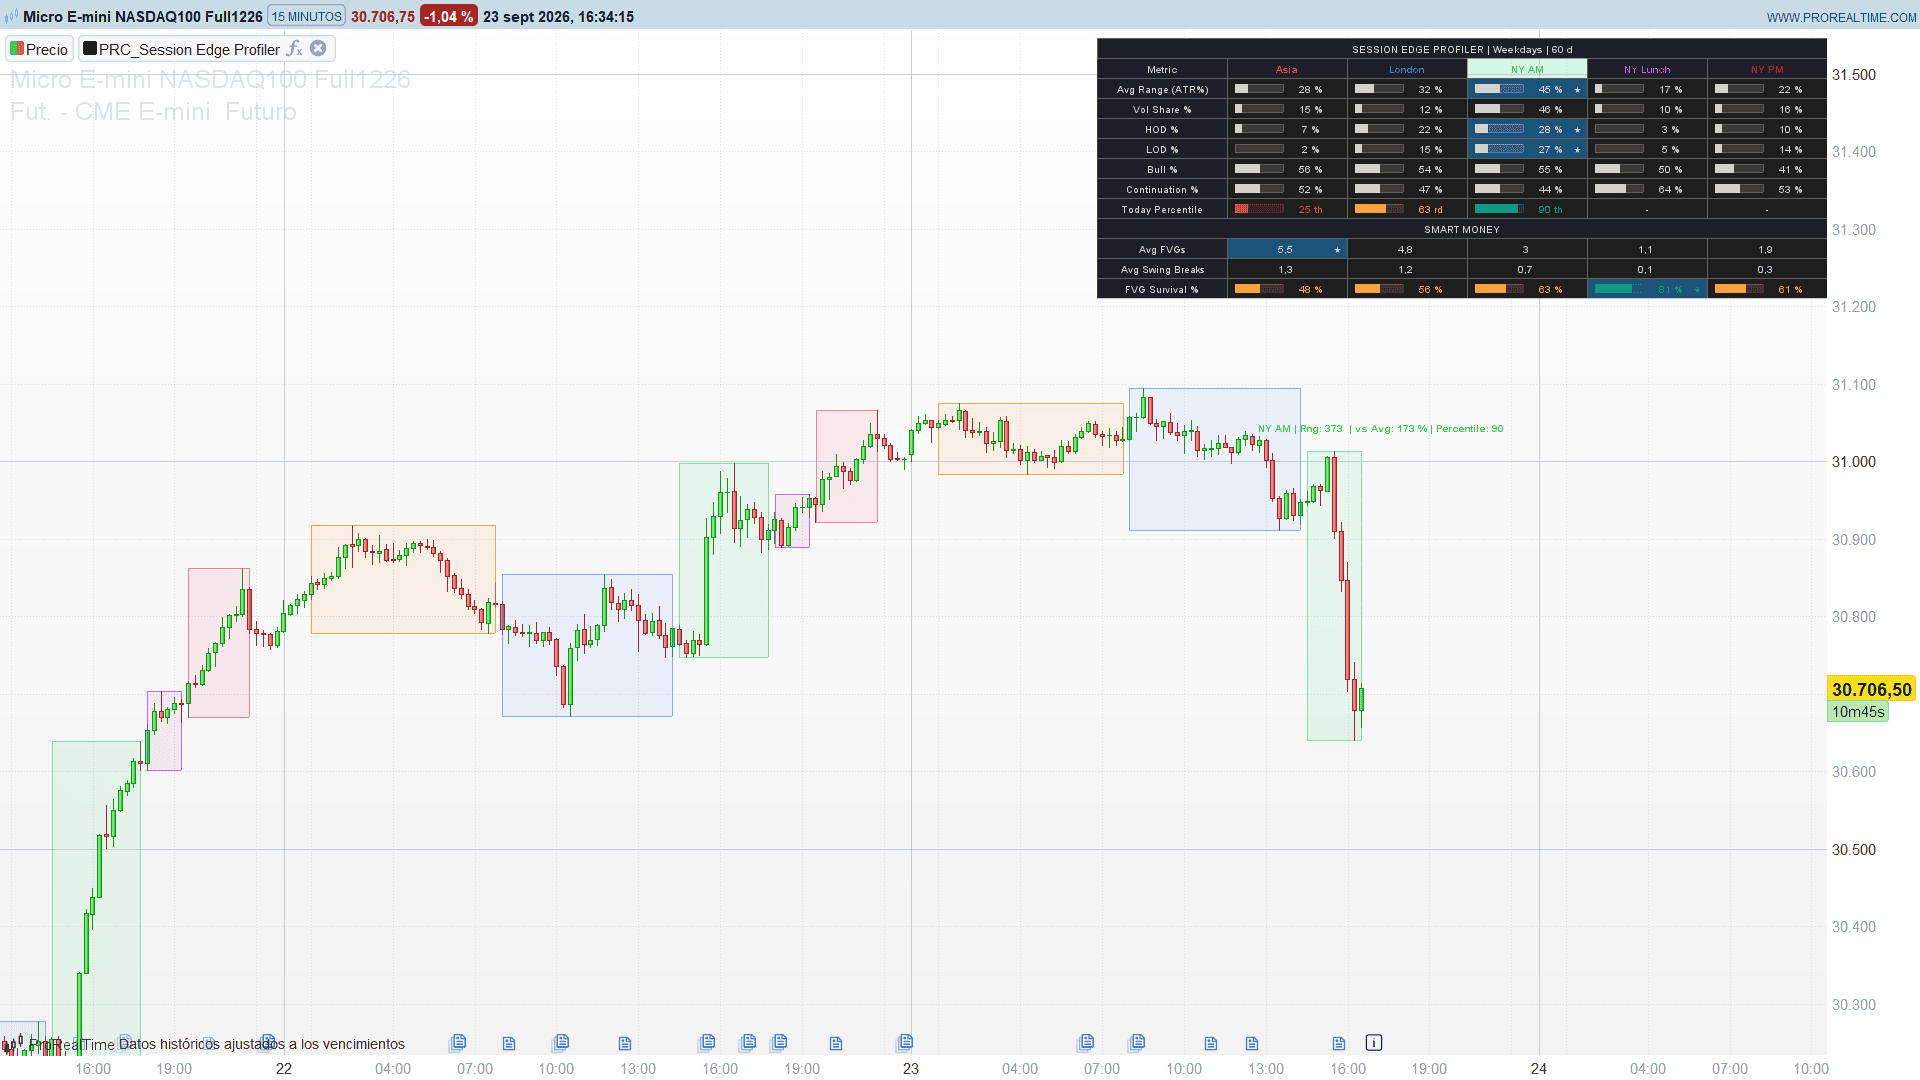
Session Edge Profiler, by Flux Charts, replaces the folklore with numbers. It follows the five classic intraday sessions bar by bar, stores a record of each one at the end of every trading day, and summarises the whole history in a dashboard: how much each session moves, how often it makes the high or the low of the day, how much of the daily volume it carries, how often it closes up, and how its fair value gaps and swing breaks behave. A label on the active session tells you how today’s range compares with its own history.
Theory Behind the Indicator
The sessions
The five sessions are set in Central European Time (Paris, Madrid, Berlin), the time most ProRealTime charts run on:
- Asia: 01:00 to 08:00
- London: 08:00 to 14:30
- NY AM: 14:30 to 18:00
- NY Lunch: 18:00 to 19:30
- NY PM: 19:30 to 22:00
The trading day starts at midnight, which is 18:00 in New York, so Asia is the first session of each day. Each session can be switched off and its hours can be changed.
Normalising the range
A 50 point range means very different things in a quiet week and in a volatile one. The indicator divides every session range by the daily ATR of the previous day, so the averages and percentiles compare like with like across the whole history.
What is recorded for each session and day
- Its range, raw and normalised by the daily ATR
- Whether it made the high and the low of the trading day
- Whether it closed above its open, and whether it closed in the same direction as the same session the day before
- Its volume and its share of the day’s total volume
- The number of fair value gaps formed inside it, and how many of them were invalidated by a close on the other side before the session ended
- The number of swing breaks (a close crossing the last pivot high or pivot low)
- The number of higher highs and lower lows on 3 bar pivots
A weekday filter lets you restrict all the statistics to specific days, for example to see whether Mondays behave differently.
Key Features at a Glance
- Five configurable sessions, preset in Central European Time
- Dashboard with up to 13 statistics per session and the best session of the key rows marked with a star
- Progress bars for the percentage rows
- Today Percentile with colour coding: green above the 75th percentile, red below the 25th
- Smart money block: average FVGs, FVG survival rate, swing breaks, higher highs and lower lows
- Live label on the active session with its current range, the range as a percentage of its average, and its percentile
- Optional session range boxes, current and past
- Weekday filter, dark and light dashboard themes
How to Read the Indicator
- Avg Range (ATR%) tells you which session does the moving. A session at 60% of the daily ATR carries most of the day; one at 15% is noise.
- HOD % and LOD % show where the extremes of the day are usually set. If London makes the low of the day 45% of the time, a new low during NY PM deserves more suspicion.
- Vol Share % shows where the liquidity is. Breakouts in low volume sessions are easier to fade.
- Continuation % above 50% means a session tends to repeat yesterday’s direction; below 50% it tends to reverse it.
- Today Percentile is the most practical reading during the day. A session already in its 90th percentile has done more than usual; a session in its 10th percentile with time left still has room.
- FVG Survival % tells you how reliable the gaps of each session are. High survival means gaps tend to hold as support or resistance; low survival means they are usually run through.
Practical Applications
- Choosing when to trade. Concentrate on the sessions that carry the range and the volume of your instrument, and reduce size in the others.
- Setting intraday expectations. Compare the current session range with its average before chasing a breakout or fading an extension.
- Filtering setups by session behaviour. Use gap based entries only in sessions where FVGs tend to survive, and expect reversals where continuation is low.
- Comparing weekdays. Switch the weekday filter to see whether the profile of a session changes on specific days.
Indicator Configuration
enAsia,enLondon,enNYAM,enLunch,enNYPM(default: 1): switch each session on or off.asiaStart/asiaEnd(100/800),londonStart/londonEnd(800/1430),nyamStart/nyamEnd(1430/1800),lunchStart/lunchEnd(1800/1930),nypmStart/nypmEnd(1930/2200): session hours in the time of your chart, HHMM format. The start is included, the end excluded. The defaults assume a chart in Central European Time; with a chart in London time, subtract one hour from every value. Keep every session inside the calendar day of your chart, so that the high and the low of the day are measured correctly.- The New York sessions follow the US clock changes. For two or three weeks a year, in March and at the turn of October and November, Europe and the US are not on summer time at the same moment, and during those weeks the New York sessions start one hour earlier on a European chart.
wdSuntowdSat(Monday to Friday on by default): weekday filter for the statistics.atrLen(default: 14): length of the daily ATR used to normalise the ranges.pivotLen(default: 5): pivot strength used for the swing breaks.showDash(default: 1),darkTheme(default: 1),showBars(default: 1): dashboard, theme and progress bars.showAvgRange,showVolShare,showHOD,showLOD,showBull,showCont,showPctl,showFVGs,showOBs,showSurv(default: 1) andshowAvgVol,showHH,showLL(default: 0): rows of the dashboard.showBoxes(default: 0) andmaxBoxes(default: 100): session range boxes and how many past ones stay on the chart.showLabel(default: 1): live label on the active session.
Apply the indicator on an intraday price chart. The more history is loaded, the more days feed the statistics: the number of days used is shown in the title of the dashboard.
Code
//---------------------------------------------------------------
//PRC_Session Edge Profiler
//version = 0
//23.09.26
//Iván González @ www.prorealcode.com
//Author: Flux Charts
//Sharing ProRealTime knowledge
//--------------------------------------------------------------------//
// Apply it on an intraday price chart.
defparam drawonlastbaronly = true
//----- Sessions, in the time of your chart (HHMM). Start included, end excluded.
// Defaults for a chart in Central European Time (Paris, Madrid, Berlin).
// Chart in London time: subtract one hour from every session.
enAsia = 1
asiaStart = 100
asiaEnd = 800
enLondon = 1
londonStart = 800
londonEnd = 1430
enNYAM = 1
nyamStart = 1430
nyamEnd = 1800
enLunch = 1
lunchStart = 1800
lunchEnd = 1930
enNYPM = 1
nypmStart = 1930
nypmEnd = 2200
//----- Filters
wdSun = 0
wdMon = 1
wdTue = 1
wdWed = 1
wdThu = 1
wdFri = 1
wdSat = 0
atrLen = 14 // daily ATR used to normalise the session ranges
pivotLen = 5 // pivot strength for the swing breaks
//----- Dashboard
showDash = 1
darkTheme = 1 // 1 = dark, 0 = light
showBars = 1 // progress bars in the percentage cells
showAvgRange = 1
showVolShare = 1
showAvgVol = 0
showHOD = 1
showLOD = 1
showBull = 1
showCont = 1
showPctl = 1
showFVGs = 1
showOBs = 1
showSurv = 1
showHH = 0
showLL = 0
//----- Display
showBoxes = 0 // session range boxes (current and past sessions)
maxBoxes = 100 // past session boxes kept on the chart
showLabel = 1 // stats label on the active session
//---------------------------------------------------------------
// Session colors and switches (index 0 Asia .. 4 NY PM)
//---------------------------------------------------------------
$sOn[0] = enAsia
$sOn[1] = enLondon
$sOn[2] = enNYAM
$sOn[3] = enLunch
$sOn[4] = enNYPM
$sR[0] = 255
$sG[0] = 109
$sB[0] = 0
$sR[1] = 41
$sG[1] = 98
$sB[1] = 255
$sR[2] = 0
$sG[2] = 200
$sB[2] = 83
$sR[3] = 170
$sG[3] = 0
$sB[3] = 255
$sR[4] = 255
$sG[4] = 23
$sB[4] = 68
// weekday switches (1 Sunday .. 7 Saturday)
$wdOk[1] = wdSun
$wdOk[2] = wdMon
$wdOk[3] = wdTue
$wdOk[4] = wdWed
$wdOk[5] = wdThu
$wdOk[6] = wdFri
$wdOk[7] = wdSat
//---------------------------------------------------------------
// Daily ATR of the previous day
//---------------------------------------------------------------
timeframe(daily)
dAtrRaw = averagetruerange[atrLen](close)
dAtrPrev = dAtrRaw[1]
timeframe(default)
dAtr = dAtrPrev
atrChart = averagetruerange[atrLen](close)
//---------------------------------------------------------------
// Clock and trading day. The trading day starts at 18:00 New York
// time, which is midnight in Central European Time, so it is simply
// the calendar day of the chart.
//---------------------------------------------------------------
once tdKey = 0
IF barindex > 0 AND date <> date[1] THEN
tdKey = tdKey + 1
ENDIF
sessMin = floor(opentime / 10000) * 60 + (floor(opentime / 100) MOD 100)
tdWk = (dayofweek MOD 7) + 1
//----- session membership of the bar
$sSt[0] = floor(asiaStart / 100) * 60 + (asiaStart MOD 100)
$sEn[0] = floor(asiaEnd / 100) * 60 + (asiaEnd MOD 100)
$sSt[1] = floor(londonStart / 100) * 60 + (londonStart MOD 100)
$sEn[1] = floor(londonEnd / 100) * 60 + (londonEnd MOD 100)
$sSt[2] = floor(nyamStart / 100) * 60 + (nyamStart MOD 100)
$sEn[2] = floor(nyamEnd / 100) * 60 + (nyamEnd MOD 100)
$sSt[3] = floor(lunchStart / 100) * 60 + (lunchStart MOD 100)
$sEn[3] = floor(lunchEnd / 100) * 60 + (lunchEnd MOD 100)
$sSt[4] = floor(nypmStart / 100) * 60 + (nypmStart MOD 100)
$sEn[4] = floor(nypmEnd / 100) * 60 + (nypmEnd MOD 100)
FOR s = 0 TO 4 DO
inside = 0
IF $sOn[s] = 1 THEN
IF $sSt[s] < $sEn[s] THEN
IF sessMin >= $sSt[s] AND sessMin < $sEn[s] THEN
inside = 1
ENDIF
ELSE
IF sessMin >= $sSt[s] OR sessMin < $sEn[s] THEN
inside = 1
ENDIF
ENDIF
ENDIF
$inLive[s] = inside
NEXT
in0 = $inLive[0]
in1 = $inLive[1]
in2 = $inLive[2]
in3 = $inLive[3]
in4 = $inLive[4]
//---------------------------------------------------------------
// Swing breaks: close crossing the last pivot high / pivot low
//---------------------------------------------------------------
pivHiWin = highest[2 * pivotLen + 1](high)
pivLoWin = lowest[2 * pivotLen + 1](low)
IF barindex >= 2 * pivotLen AND high[pivotLen] = pivHiWin THEN
shLevel = high[pivotLen]
shOn = 1
ENDIF
IF barindex >= 2 * pivotLen AND low[pivotLen] = pivLoWin THEN
slLevel = low[pivotLen]
slOn = 1
ENDIF
bullOB = 0
bearOB = 0
IF shOn = 1 AND close > shLevel AND close[1] <= shLevel THEN
bullOB = 1
shOn = 0
ENDIF
IF slOn = 1 AND close < slLevel AND close[1] >= slLevel THEN
bearOB = 1
slOn = 0
ENDIF
//---------------------------------------------------------------
// Engine. Runs ONCE per bar on the last CLOSED bar only, so every
// tick of the live bar computes the same thing (arrays are NOT
// rewound between ticks the way scalars are).
//---------------------------------------------------------------
fvCap = 500
IF barindex = 0 THEN
$g[0] = 0 - 1
$g[5] = 0
$g[6] = 0
FOR s = 0 TO 4 DO
$act[s] = 0
$dDone[s] = 0
$hasPrev[s] = 0
$prevBull[s] = 0
$hN[s] = 0
$fvN[s] = 0
$dVol[s] = 0
NEXT
ENDIF
IF barindex > $g[0] THEN
$g[0] = barindex
IF barindex >= 4 THEN
$inC[0] = in0[1]
$inC[1] = in1[1]
$inC[2] = in2[1]
$inC[3] = in3[1]
$inC[4] = in4[1]
bHi = high[1]
bLo = low[1]
bOp = open[1]
bVol = volume[1]
bCl = close[1]
bClPrev = close[2]
fvBullC = low[1] > high[3]
fvBearC = high[1] < low[3]
pv3Hi = high[2] > high[3] AND high[2] > high[1]
pv3Lo = low[2] < low[3] AND low[2] < low[1]
obBullC = bullOB[1]
obBearC = bearOB[1]
tdKeyC = tdKey[1]
tdWkC = tdWk[1]
dAtrC = dAtr[1]
//----- session tracking
FOR s = 0 TO 4 DO
IF $sOn[s] = 1 THEN
IF $inC[s] = 1 AND $act[s] = 0 THEN
$cHi[s] = bHi
$cLo[s] = bLo
$cOpen[s] = bOp
$cBar[s] = barindex - 1
$act[s] = 1
$cF[s] = 0
$cIf[s] = 0
$cOb[s] = 0
$cHH[s] = 0
$cLL[s] = 0
$cVol[s] = bVol
$cSwHOn[s] = 0
$cSwLOn[s] = 0
$fvN[s] = 0
ELSIF $inC[s] = 1 AND $act[s] = 1 THEN
$cHi[s] = max($cHi[s], bHi)
$cLo[s] = min($cLo[s], bLo)
$cVol[s] = $cVol[s] + bVol
IF fvBullC OR fvBearC THEN
$cF[s] = $cF[s] + 1
IF $fvN[s] < fvCap THEN
IF fvBullC THEN
$fvLvl[s * fvCap + $fvN[s]] = high[3]
$fvBull[s * fvCap + $fvN[s]] = 1
ELSE
$fvLvl[s * fvCap + $fvN[s]] = low[3]
$fvBull[s * fvCap + $fvN[s]] = 0
ENDIF
$fvN[s] = $fvN[s] + 1
ENDIF
ENDIF
// inverted FVGs: close through the gap level
IF $fvN[s] > 0 THEN
FOR jf = $fvN[s] - 1 DOWNTO 0 DO
qf = s * fvCap + jf
hitF = 0
IF $fvBull[qf] = 1 AND bCl < $fvLvl[qf] THEN
hitF = 1
ELSIF $fvBull[qf] = 0 AND bCl > $fvLvl[qf] THEN
hitF = 1
ENDIF
IF hitF = 1 THEN
$cIf[s] = $cIf[s] + 1
IF jf < $fvN[s] - 1 THEN
FOR mf = jf TO $fvN[s] - 2 DO
$fvLvl[s * fvCap + mf] = $fvLvl[s * fvCap + mf + 1]
$fvBull[s * fvCap + mf] = $fvBull[s * fvCap + mf + 1]
NEXT
ENDIF
$fvN[s] = $fvN[s] - 1
ENDIF
NEXT
ENDIF
IF obBullC = 1 THEN
$cOb[s] = $cOb[s] + 1
ENDIF
IF obBearC = 1 THEN
$cOb[s] = $cOb[s] + 1
ENDIF
// higher highs / lower lows on 3-bar pivots
IF pv3Hi THEN
IF $cSwHOn[s] = 1 AND high[2] > $cSwH[s] THEN
$cHH[s] = $cHH[s] + 1
ENDIF
$cSwH[s] = high[2]
$cSwHOn[s] = 1
ENDIF
IF pv3Lo THEN
IF $cSwLOn[s] = 1 AND low[2] < $cSwL[s] THEN
$cLL[s] = $cLL[s] + 1
ENDIF
$cSwL[s] = low[2]
$cSwLOn[s] = 1
ENDIF
ELSIF $inC[s] = 0 AND $act[s] = 1 THEN
$dHi[s] = $cHi[s]
$dLo[s] = $cLo[s]
$dOpen[s] = $cOpen[s]
$dClose[s] = bClPrev
$dDone[s] = 1
$act[s] = 0
$dVol[s] = $cVol[s]
$dF[s] = $cF[s]
$dIf[s] = $cIf[s]
$dOb[s] = $cOb[s]
$dHH[s] = $cHH[s]
$dLL[s] = $cLL[s]
// past session box, kept in a ring buffer
IF showBoxes = 1 THEN
qb = $g[6] MOD maxBoxes
$bxL[qb] = $cBar[s]
$bxR[qb] = barindex - 2
$bxT[qb] = $cHi[s]
$bxB[qb] = $cLo[s]
$bxS[qb] = s
$g[6] = $g[6] + 1
ENDIF
ENDIF
ENDIF
NEXT
//----- trading day finalisation
IF $g[5] = 0 THEN
$g[1] = tdKeyC
$g[2] = tdWkC
$g[3] = bHi
$g[4] = bLo
$g[5] = 1
ELSIF tdKeyC <> $g[1] THEN
dayVol = 0
FOR s = 0 TO 4 DO
IF $dDone[s] = 1 THEN
dayVol = dayVol + $dVol[s]
ENDIF
NEXT
FOR s = 0 TO 4 DO
IF $dDone[s] = 1 THEN
rngD = $dHi[s] - $dLo[s]
nRng = 0
IF dAtrC > 0 THEN
nRng = rngD / dAtrC
ENDIF
isBullD = 0
IF $dClose[s] > $dOpen[s] THEN
isBullD = 1
ENDIF
qr = $hN[s] * 5 + s
$rWk[qr] = $g[2]
$rN[qr] = nRng
$rHod[qr] = 0
IF $dHi[s] = $g[3] THEN
$rHod[qr] = 1
ENDIF
$rLod[qr] = 0
IF $dLo[s] = $g[4] THEN
$rLod[qr] = 1
ENDIF
$rBull[qr] = isBullD
$rCont[qr] = 0
IF $hasPrev[s] = 1 AND $prevBull[s] = isBullD THEN
$rCont[qr] = 1
ENDIF
$rCOk[qr] = $hasPrev[s]
$rF[qr] = $dF[s]
$rIf[qr] = $dIf[s]
$rOb[qr] = $dOb[s]
$rHH[qr] = $dHH[s]
$rLL[qr] = $dLL[s]
$rVol[qr] = $dVol[s]
$rVs[qr] = 0
IF dayVol > 0 THEN
$rVs[qr] = $dVol[s] / dayVol * 100
ENDIF
$hN[s] = $hN[s] + 1
$prevBull[s] = isBullD
$hasPrev[s] = 1
ENDIF
IF $act[s] = 0 THEN
$dDone[s] = 0
$dVol[s] = 0
ENDIF
NEXT
$g[1] = tdKeyC
$g[2] = tdWkC
$g[3] = bHi
$g[4] = bLo
ELSE
$g[3] = max($g[3], bHi)
$g[4] = min($g[4], bLo)
ENDIF
ENDIF
ENDIF
//---------------------------------------------------------------
// Drawing, on the last bar
//---------------------------------------------------------------
IF islastbarupdate THEN
liveNewDay = 0
IF tdKey <> $g[1] THEN
liveNewDay = 1
ENDIF
//----- live range of each session: committed state + the live bar
FOR s = 0 TO 4 DO
$lvAct[s] = 0
$lvOk[s] = 0
IF $sOn[s] = 1 THEN
IF $inLive[s] = 1 AND $act[s] = 1 THEN
$lvAct[s] = 1
$lvOk[s] = 1
$lvHi[s] = max($cHi[s], high)
$lvLo[s] = min($cLo[s], low)
$lvBar[s] = $cBar[s]
ELSIF $inLive[s] = 1 THEN
$lvAct[s] = 1
$lvOk[s] = 1
$lvHi[s] = high
$lvLo[s] = low
$lvBar[s] = barindex
ELSIF $act[s] = 1 AND liveNewDay = 0 THEN
$lvOk[s] = 1
$lvHi[s] = $cHi[s]
$lvLo[s] = $cLo[s]
ELSIF $dDone[s] = 1 AND liveNewDay = 0 THEN
$lvOk[s] = 1
$lvHi[s] = $dHi[s]
$lvLo[s] = $dLo[s]
ENDIF
ENDIF
NEXT
//----- past session boxes
IF showBoxes = 1 THEN
nb = min($g[6], maxBoxes)
IF nb > 0 THEN
FOR kb = 0 TO nb - 1 DO
sb = $bxS[kb]
DRAWRECTANGLE($bxL[kb], $bxT[kb], $bxR[kb], $bxB[kb]) COLOURED($sR[sb], $sG[sb], $sB[sb], 128) FILLCOLOR($sR[sb], $sG[sb], $sB[sb], 18)
NEXT
ENDIF
FOR s = 0 TO 4 DO
IF $lvAct[s] = 1 THEN
DRAWRECTANGLE($lvBar[s], $lvHi[s], barindex, $lvLo[s]) COLOURED($sR[s], $sG[s], $sB[s], 102) FILLCOLOR($sR[s], $sG[s], $sB[s], 20)
ENDIF
NEXT
ENDIF
//----- history statistics per session (weekday filter applied)
maxDays = 0
FOR s = 0 TO 4 DO
tot = 0
sumN = 0
hodC = 0
lodC = 0
bullC = 0
contC = 0
contT = 0
sumFvg = 0
sumIfvg = 0
sumOb = 0
sumHH = 0
sumLL = 0
sumVol = 0
sumVShr = 0
curNorm = 0
curOk = 0
IF $lvOk[s] = 1 AND dAtr > 0 THEN
curNorm = ($lvHi[s] - $lvLo[s]) / dAtr
curOk = 1
ENDIF
bel = 0
IF $hN[s] > 0 THEN
FOR n = 0 TO $hN[s] - 1 DO
qr = n * 5 + s
wkq = $rWk[qr]
IF $wdOk[wkq] = 1 THEN
tot = tot + 1
sumN = sumN + $rN[qr]
hodC = hodC + $rHod[qr]
lodC = lodC + $rLod[qr]
bullC = bullC + $rBull[qr]
sumFvg = sumFvg + $rF[qr]
sumIfvg = sumIfvg + $rIf[qr]
sumOb = sumOb + $rOb[qr]
sumHH = sumHH + $rHH[qr]
sumLL = sumLL + $rLL[qr]
sumVol = sumVol + $rVol[qr]
sumVShr = sumVShr + $rVs[qr]
IF $rCOk[qr] = 1 THEN
contT = contT + 1
contC = contC + $rCont[qr]
ENDIF
IF curOk = 1 AND $rN[qr] <= curNorm THEN
bel = bel + 1
ENDIF
ENDIF
NEXT
ENDIF
FOR rt = 0 TO 13 DO
$vOk[rt * 5 + s] = 0
NEXT
$avgN[s] = 0
$tot[s] = tot
IF tot > 0 THEN
$avgN[s] = sumN / tot
$val[0 * 5 + s] = round(sumN / tot * 100)
$vOk[0 * 5 + s] = 1
$val[1 * 5 + s] = floor(sumVShr / tot)
$vOk[1 * 5 + s] = 1
$val[2 * 5 + s] = round(sumVol / tot)
$vOk[2 * 5 + s] = 1
$val[3 * 5 + s] = round(hodC * 100 / tot)
$vOk[3 * 5 + s] = 1
$val[4 * 5 + s] = round(lodC * 100 / tot)
$vOk[4 * 5 + s] = 1
$val[5 * 5 + s] = round(bullC * 100 / tot)
$vOk[5 * 5 + s] = 1
IF contT > 0 THEN
$val[6 * 5 + s] = round(contC * 100 / contT)
$vOk[6 * 5 + s] = 1
ENDIF
$val[9 * 5 + s] = round(sumFvg * 10 / tot) / 10
$vOk[9 * 5 + s] = 1
$val[10 * 5 + s] = round(sumOb * 10 / tot) / 10
$vOk[10 * 5 + s] = 1
IF sumFvg > 0 THEN
$val[11 * 5 + s] = round((sumFvg - sumIfvg) * 100 / sumFvg)
$vOk[11 * 5 + s] = 1
ENDIF
$val[12 * 5 + s] = round(sumHH * 10 / tot) / 10
$vOk[12 * 5 + s] = 1
$val[13 * 5 + s] = round(sumLL * 10 / tot) / 10
$vOk[13 * 5 + s] = 1
IF curOk = 1 THEN
$val[7 * 5 + s] = round(bel * 100 / tot)
$vOk[7 * 5 + s] = 1
ENDIF
IF $sOn[s] = 1 AND tot > maxDays THEN
maxDays = tot
ENDIF
ENDIF
$curN[s] = curNorm
$curOk[s] = curOk
NEXT
//----- active session label
IF showLabel = 1 THEN
FOR s = 0 TO 4 DO
IF $lvAct[s] = 1 THEN
curRng = round(($lvHi[s] - $lvLo[s]) / pipsize) * pipsize
lbX = barindex + 3
lbY = $lvHi[s] + atrChart * 0.6
fullLbl = 0
IF $tot[s] > 0 AND $curOk[s] = 1 AND $avgN[s] > 0 THEN
fullLbl = 1
vsAvg = round($curN[s] / $avgN[s] * 100)
pctlL = $val[7 * 5 + s]
ENDIF
lr = $sR[s]
lg = $sG[s]
lb = $sB[s]
IF fullLbl = 1 THEN
IF s = 0 THEN
DRAWTEXT("Asia | Rng: #curRng# | vs Avg: #vsAvg#% | Percentile: #pctlL#", lbX, lbY, SansSerif, Bold, 10) COLOURED(lr, lg, lb, 255)
ELSIF s = 1 THEN
DRAWTEXT("London | Rng: #curRng# | vs Avg: #vsAvg#% | Percentile: #pctlL#", lbX, lbY, SansSerif, Bold, 10) COLOURED(lr, lg, lb, 255)
ELSIF s = 2 THEN
DRAWTEXT("NY AM | Rng: #curRng# | vs Avg: #vsAvg#% | Percentile: #pctlL#", lbX, lbY, SansSerif, Bold, 10) COLOURED(lr, lg, lb, 255)
ELSIF s = 3 THEN
DRAWTEXT("NY Lunch | Rng: #curRng# | vs Avg: #vsAvg#% | Percentile: #pctlL#", lbX, lbY, SansSerif, Bold, 10) COLOURED(lr, lg, lb, 255)
ELSE
DRAWTEXT("NY PM | Rng: #curRng# | vs Avg: #vsAvg#% | Percentile: #pctlL#", lbX, lbY, SansSerif, Bold, 10) COLOURED(lr, lg, lb, 255)
ENDIF
ELSE
IF s = 0 THEN
DRAWTEXT("Asia | Rng: #curRng# | vs Avg: - | Percentile: -", lbX, lbY, SansSerif, Bold, 10) COLOURED(lr, lg, lb, 255)
ELSIF s = 1 THEN
DRAWTEXT("London | Rng: #curRng# | vs Avg: - | Percentile: -", lbX, lbY, SansSerif, Bold, 10) COLOURED(lr, lg, lb, 255)
ELSIF s = 2 THEN
DRAWTEXT("NY AM | Rng: #curRng# | vs Avg: - | Percentile: -", lbX, lbY, SansSerif, Bold, 10) COLOURED(lr, lg, lb, 255)
ELSIF s = 3 THEN
DRAWTEXT("NY Lunch | Rng: #curRng# | vs Avg: - | Percentile: -", lbX, lbY, SansSerif, Bold, 10) COLOURED(lr, lg, lb, 255)
ELSE
DRAWTEXT("NY PM | Rng: #curRng# | vs Avg: - | Percentile: -", lbX, lbY, SansSerif, Bold, 10) COLOURED(lr, lg, lb, 255)
ENDIF
ENDIF
ENDIF
NEXT
ENDIF
//---------------------------------------------------------------
// Dashboard (anchored top right)
//---------------------------------------------------------------
nEn = 0
FOR s = 0 TO 4 DO
IF $sOn[s] = 1 THEN
$colOf[s] = nEn
nEn = nEn + 1
ENDIF
NEXT
IF showDash = 1 AND nEn > 0 THEN
IF darkTheme = 1 THEN
hR = 30
hG = 30
hB = 40
rwR = 30
rwG = 30
rwB = 30
btR = 26
btG = 82
btB = 118
txR = 210
txG = 210
txB = 210
ELSE
hR = 230
hG = 230
hB = 240
rwR = 245
rwG = 245
rwB = 245
btR = 200
btG = 221
btB = 240
txR = 30
txG = 30
txB = 30
ENDIF
rowH = 20
lblW = 130
colW = 120
tbR = -90
tbL = tbR - lblW - nEn * colW
//----- best values
FOR rt = 0 TO 13 DO
$bestOk[rt] = 0
FOR s = 0 TO 4 DO
IF $sOn[s] = 1 AND $vOk[rt * 5 + s] = 1 THEN
IF $bestOk[rt] = 0 OR $val[rt * 5 + s] > $best[rt] THEN
$best[rt] = $val[rt * 5 + s]
$bestOk[rt] = 1
ENDIF
ENDIF
NEXT
NEXT
//----- row 0: title
yT = -8
DRAWRECTANGLE(tbL, yT, tbR, yT - rowH) ANCHOR(TOPRIGHT, XSHIFT, YSHIFT) COLOURED(128, 128, 128, 153) FILLCOLOR(hR, hG, hB, 255)
xMidT = (tbL + tbR) / 2
allDays = wdSun + wdMon + wdTue + wdWed + wdThu + wdFri + wdSat
wkDays = wdMon + wdTue + wdWed + wdThu + wdFri
IF allDays = 7 THEN
DRAWTEXT("SESSION EDGE PROFILER | All | #maxDays#d", xMidT, yT - rowH / 2, SansSerif, Bold, 10) ANCHOR(TOPRIGHT, XSHIFT, YSHIFT) COLOURED(txR, txG, txB, 255)
ELSIF wkDays = 5 AND wdSun = 0 AND wdSat = 0 THEN
DRAWTEXT("SESSION EDGE PROFILER | Weekdays | #maxDays#d", xMidT, yT - rowH / 2, SansSerif, Bold, 10) ANCHOR(TOPRIGHT, XSHIFT, YSHIFT) COLOURED(txR, txG, txB, 255)
ELSIF allDays = 0 THEN
DRAWTEXT("SESSION EDGE PROFILER | None | #maxDays#d", xMidT, yT - rowH / 2, SansSerif, Bold, 10) ANCHOR(TOPRIGHT, XSHIFT, YSHIFT) COLOURED(txR, txG, txB, 255)
ELSE
DRAWTEXT("SESSION EDGE PROFILER | Custom days | #maxDays#d", xMidT, yT - rowH / 2, SansSerif, Bold, 10) ANCHOR(TOPRIGHT, XSHIFT, YSHIFT) COLOURED(txR, txG, txB, 255)
ENDIF
//----- row 1: headers
yT = -8 - rowH
yC = yT - rowH / 2
DRAWRECTANGLE(tbL, yT, tbL + lblW, yT - rowH) ANCHOR(TOPRIGHT, XSHIFT, YSHIFT) COLOURED(128, 128, 128, 102) FILLCOLOR(hR, hG, hB, 255)
DRAWTEXT("Metric", tbL + lblW / 2, yC, SansSerif, Bold, 10) ANCHOR(TOPRIGHT, XSHIFT, YSHIFT) COLOURED(txR, txG, txB, 255)
FOR s = 0 TO 4 DO
IF $sOn[s] = 1 THEN
cx1 = tbL + lblW + $colOf[s] * colW
cxm = cx1 + colW / 2
IF $lvAct[s] = 1 AND darkTheme = 1 THEN
DRAWRECTANGLE(cx1, yT, cx1 + colW, yT - rowH) ANCHOR(TOPRIGHT, XSHIFT, YSHIFT) COLOURED(128, 128, 128, 102) FILLCOLOR($sR[s], $sG[s], $sB[s], 38)
ELSE
DRAWRECTANGLE(cx1, yT, cx1 + colW, yT - rowH) ANCHOR(TOPRIGHT, XSHIFT, YSHIFT) COLOURED(128, 128, 128, 102) FILLCOLOR(hR, hG, hB, 255)
ENDIF
IF s = 0 THEN
DRAWTEXT("Asia", cxm, yC, SansSerif, Bold, 10) ANCHOR(TOPRIGHT, XSHIFT, YSHIFT) COLOURED($sR[s], $sG[s], $sB[s], 255)
ELSIF s = 1 THEN
DRAWTEXT("London", cxm, yC, SansSerif, Bold, 10) ANCHOR(TOPRIGHT, XSHIFT, YSHIFT) COLOURED($sR[s], $sG[s], $sB[s], 255)
ELSIF s = 2 THEN
DRAWTEXT("NY AM", cxm, yC, SansSerif, Bold, 10) ANCHOR(TOPRIGHT, XSHIFT, YSHIFT) COLOURED($sR[s], $sG[s], $sB[s], 255)
ELSIF s = 3 THEN
DRAWTEXT("NY Lunch", cxm, yC, SansSerif, Bold, 10) ANCHOR(TOPRIGHT, XSHIFT, YSHIFT) COLOURED($sR[s], $sG[s], $sB[s], 255)
ELSE
DRAWTEXT("NY PM", cxm, yC, SansSerif, Bold, 10) ANCHOR(TOPRIGHT, XSHIFT, YSHIFT) COLOURED($sR[s], $sG[s], $sB[s], 255)
ENDIF
ENDIF
NEXT
//----- metric rows
$rowOn[0] = showAvgRange
$rowOn[1] = showVolShare
$rowOn[2] = showAvgVol
$rowOn[3] = showHOD
$rowOn[4] = showLOD
$rowOn[5] = showBull
$rowOn[6] = showCont
$rowOn[7] = showPctl
$rowOn[8] = 0
IF showFVGs + showOBs + showSurv + showHH + showLL > 0 THEN
$rowOn[8] = 1
ENDIF
$rowOn[9] = showFVGs
$rowOn[10] = showOBs
$rowOn[11] = showSurv
$rowOn[12] = showHH
$rowOn[13] = showLL
rowNo = 2
FOR rt = 0 TO 13 DO
IF $rowOn[rt] = 1 THEN
yT = -8 - rowNo * rowH
yC = yT - rowH / 2
rowNo = rowNo + 1
IF rt = 8 THEN
DRAWRECTANGLE(tbL, yT, tbR, yT - rowH) ANCHOR(TOPRIGHT, XSHIFT, YSHIFT) COLOURED(128, 128, 128, 102) FILLCOLOR(hR, hG, hB, 255)
DRAWTEXT("SMART MONEY", xMidT, yC, SansSerif, Bold, 10) ANCHOR(TOPRIGHT, XSHIFT, YSHIFT) COLOURED(txR, txG, txB, 255)
ELSE
//----- row label
DRAWRECTANGLE(tbL, yT, tbL + lblW, yT - rowH) ANCHOR(TOPRIGHT, XSHIFT, YSHIFT) COLOURED(128, 128, 128, 102) FILLCOLOR(hR, hG, hB, 255)
xLb = tbL + lblW / 2
IF rt = 0 THEN
DRAWTEXT("Avg Range (ATR%)", xLb, yC, SansSerif, Standard, 10) ANCHOR(TOPRIGHT, XSHIFT, YSHIFT) COLOURED(txR, txG, txB, 255)
ELSIF rt = 1 THEN
DRAWTEXT("Vol Share %", xLb, yC, SansSerif, Standard, 10) ANCHOR(TOPRIGHT, XSHIFT, YSHIFT) COLOURED(txR, txG, txB, 255)
ELSIF rt = 2 THEN
DRAWTEXT("Avg Vol", xLb, yC, SansSerif, Standard, 10) ANCHOR(TOPRIGHT, XSHIFT, YSHIFT) COLOURED(txR, txG, txB, 255)
ELSIF rt = 3 THEN
DRAWTEXT("HOD %", xLb, yC, SansSerif, Standard, 10) ANCHOR(TOPRIGHT, XSHIFT, YSHIFT) COLOURED(txR, txG, txB, 255)
ELSIF rt = 4 THEN
DRAWTEXT("LOD %", xLb, yC, SansSerif, Standard, 10) ANCHOR(TOPRIGHT, XSHIFT, YSHIFT) COLOURED(txR, txG, txB, 255)
ELSIF rt = 5 THEN
DRAWTEXT("Bull %", xLb, yC, SansSerif, Standard, 10) ANCHOR(TOPRIGHT, XSHIFT, YSHIFT) COLOURED(txR, txG, txB, 255)
ELSIF rt = 6 THEN
DRAWTEXT("Continuation %", xLb, yC, SansSerif, Standard, 10) ANCHOR(TOPRIGHT, XSHIFT, YSHIFT) COLOURED(txR, txG, txB, 255)
ELSIF rt = 7 THEN
DRAWTEXT("Today Percentile", xLb, yC, SansSerif, Standard, 10) ANCHOR(TOPRIGHT, XSHIFT, YSHIFT) COLOURED(txR, txG, txB, 255)
ELSIF rt = 9 THEN
DRAWTEXT("Avg FVGs", xLb, yC, SansSerif, Standard, 10) ANCHOR(TOPRIGHT, XSHIFT, YSHIFT) COLOURED(txR, txG, txB, 255)
ELSIF rt = 10 THEN
DRAWTEXT("Avg Swing Breaks", xLb, yC, SansSerif, Standard, 10) ANCHOR(TOPRIGHT, XSHIFT, YSHIFT) COLOURED(txR, txG, txB, 255)
ELSIF rt = 11 THEN
DRAWTEXT("FVG Survival %", xLb, yC, SansSerif, Standard, 10) ANCHOR(TOPRIGHT, XSHIFT, YSHIFT) COLOURED(txR, txG, txB, 255)
ELSIF rt = 12 THEN
DRAWTEXT("Avg HH", xLb, yC, SansSerif, Standard, 10) ANCHOR(TOPRIGHT, XSHIFT, YSHIFT) COLOURED(txR, txG, txB, 255)
ELSE
DRAWTEXT("Avg LL", xLb, yC, SansSerif, Standard, 10) ANCHOR(TOPRIGHT, XSHIFT, YSHIFT) COLOURED(txR, txG, txB, 255)
ENDIF
//----- row kind: percentage, count, raw volume or percentile
isPct = 0
IF rt <= 6 AND rt <> 2 THEN
isPct = 1
ENDIF
IF rt = 11 THEN
isPct = 1
ENDIF
hasBest = 0
IF rt = 0 OR rt = 3 OR rt = 4 OR rt = 9 OR rt = 11 THEN
hasBest = 1
ENDIF
//----- one cell per enabled session
FOR s = 0 TO 4 DO
IF $sOn[s] = 1 THEN
q = rt * 5 + s
cx1 = tbL + lblW + $colOf[s] * colW
cxm = cx1 + colW / 2
isBst = 0
IF hasBest = 1 AND $vOk[q] = 1 AND $bestOk[rt] = 1 THEN
IF $val[q] = $best[rt] THEN
isBst = 1
ENDIF
ENDIF
IF isBst = 1 THEN
DRAWRECTANGLE(cx1, yT, cx1 + colW, yT - rowH) ANCHOR(TOPRIGHT, XSHIFT, YSHIFT) COLOURED(128, 128, 128, 102) FILLCOLOR(btR, btG, btB, 255)
ELSE
DRAWRECTANGLE(cx1, yT, cx1 + colW, yT - rowH) ANCHOR(TOPRIGHT, XSHIFT, YSHIFT) COLOURED(128, 128, 128, 102) FILLCOLOR(rwR, rwG, rwB, 255)
ENDIF
//----- text color: signal colors on Today Percentile and FVG Survival
txtCr = txR
txtCg = txG
txtCb = txB
IF $vOk[q] = 1 AND rt = 7 THEN
IF $val[q] >= 75 THEN
txtCr = 8
txtCg = 153
txtCb = 129
ELSIF $val[q] <= 25 THEN
txtCr = 242
txtCg = 54
txtCb = 69
ELSE
txtCr = 255
txtCg = 152
txtCb = 0
ENDIF
ENDIF
IF $vOk[q] = 1 AND rt = 11 THEN
IF $val[q] >= 70 THEN
txtCr = 8
txtCg = 153
txtCb = 129
ELSIF $val[q] >= 40 THEN
txtCr = 255
txtCg = 152
txtCb = 0
ELSE
txtCr = 242
txtCg = 54
txtCb = 69
ENDIF
ENDIF
IF $vOk[q] = 0 THEN
DRAWTEXT("-", cxm, yC, SansSerif, Standard, 10) ANCHOR(TOPRIGHT, XSHIFT, YSHIFT) COLOURED(txtCr, txtCg, txtCb, 255)
ELSE
v = $val[q]
xTx = cxm
//----- progress bar (8 steps) on percentage and percentile rows
IF showBars = 1 AND (isPct = 1 OR rt = 7) THEN
nFill = round(max(0, min(v, 100)) / 100 * 8)
pbL = cx1 + 8
DRAWRECTANGLE(pbL, yC + 4, pbL + 48, yC - 4) ANCHOR(TOPRIGHT, XSHIFT, YSHIFT) COLOURED(txtCr, txtCg, txtCb, 90) FILLCOLOR(txtCr, txtCg, txtCb, 40)
IF nFill > 0 THEN
DRAWRECTANGLE(pbL, yC + 4, pbL + 6 * nFill, yC - 4) ANCHOR(TOPRIGHT, XSHIFT, YSHIFT) COLOURED(txtCr, txtCg, txtCb, 255) FILLCOLOR(txtCr, txtCg, txtCb, 255)
ENDIF
xTx = cx1 + 84
ENDIF
IF rt = 7 THEN
vm10 = v MOD 10
vm100 = v MOD 100
IF vm100 >= 11 AND vm100 <= 13 THEN
DRAWTEXT("#v#th", xTx, yC, SansSerif, Standard, 10) ANCHOR(TOPRIGHT, XSHIFT, YSHIFT) COLOURED(txtCr, txtCg, txtCb, 255)
ELSIF vm10 = 1 THEN
DRAWTEXT("#v#st", xTx, yC, SansSerif, Standard, 10) ANCHOR(TOPRIGHT, XSHIFT, YSHIFT) COLOURED(txtCr, txtCg, txtCb, 255)
ELSIF vm10 = 2 THEN
DRAWTEXT("#v#nd", xTx, yC, SansSerif, Standard, 10) ANCHOR(TOPRIGHT, XSHIFT, YSHIFT) COLOURED(txtCr, txtCg, txtCb, 255)
ELSIF vm10 = 3 THEN
DRAWTEXT("#v#rd", xTx, yC, SansSerif, Standard, 10) ANCHOR(TOPRIGHT, XSHIFT, YSHIFT) COLOURED(txtCr, txtCg, txtCb, 255)
ELSE
DRAWTEXT("#v#th", xTx, yC, SansSerif, Standard, 10) ANCHOR(TOPRIGHT, XSHIFT, YSHIFT) COLOURED(txtCr, txtCg, txtCb, 255)
ENDIF
ELSIF isPct = 1 THEN
DRAWTEXT("#v#%", xTx, yC, SansSerif, Standard, 10) ANCHOR(TOPRIGHT, XSHIFT, YSHIFT) COLOURED(txtCr, txtCg, txtCb, 255)
ELSE
DRAWTEXT("#v#", xTx, yC, SansSerif, Standard, 10) ANCHOR(TOPRIGHT, XSHIFT, YSHIFT) COLOURED(txtCr, txtCg, txtCb, 255)
ENDIF
IF isBst = 1 THEN
DRAWTEXT("★", cx1 + colW - 10, yC, SansSerif, Standard, 10) ANCHOR(TOPRIGHT, XSHIFT, YSHIFT) COLOURED(txtCr, txtCg, txtCb, 255)
ENDIF
ENDIF
ENDIF
NEXT
ENDIF
ENDIF
NEXT
ENDIF
ENDIF
RETURN
Conclusion
Session behaviour is one of the most repeated ideas in intraday trading and one of the least measured. This indicator measures it on your own instrument and history, and keeps the reading up to date bar after bar, so that “London sets the low” becomes a number you can check instead of a belief.