Swing Profile: volume profile of every swing leg
Introduction
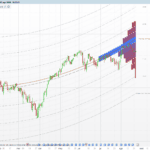
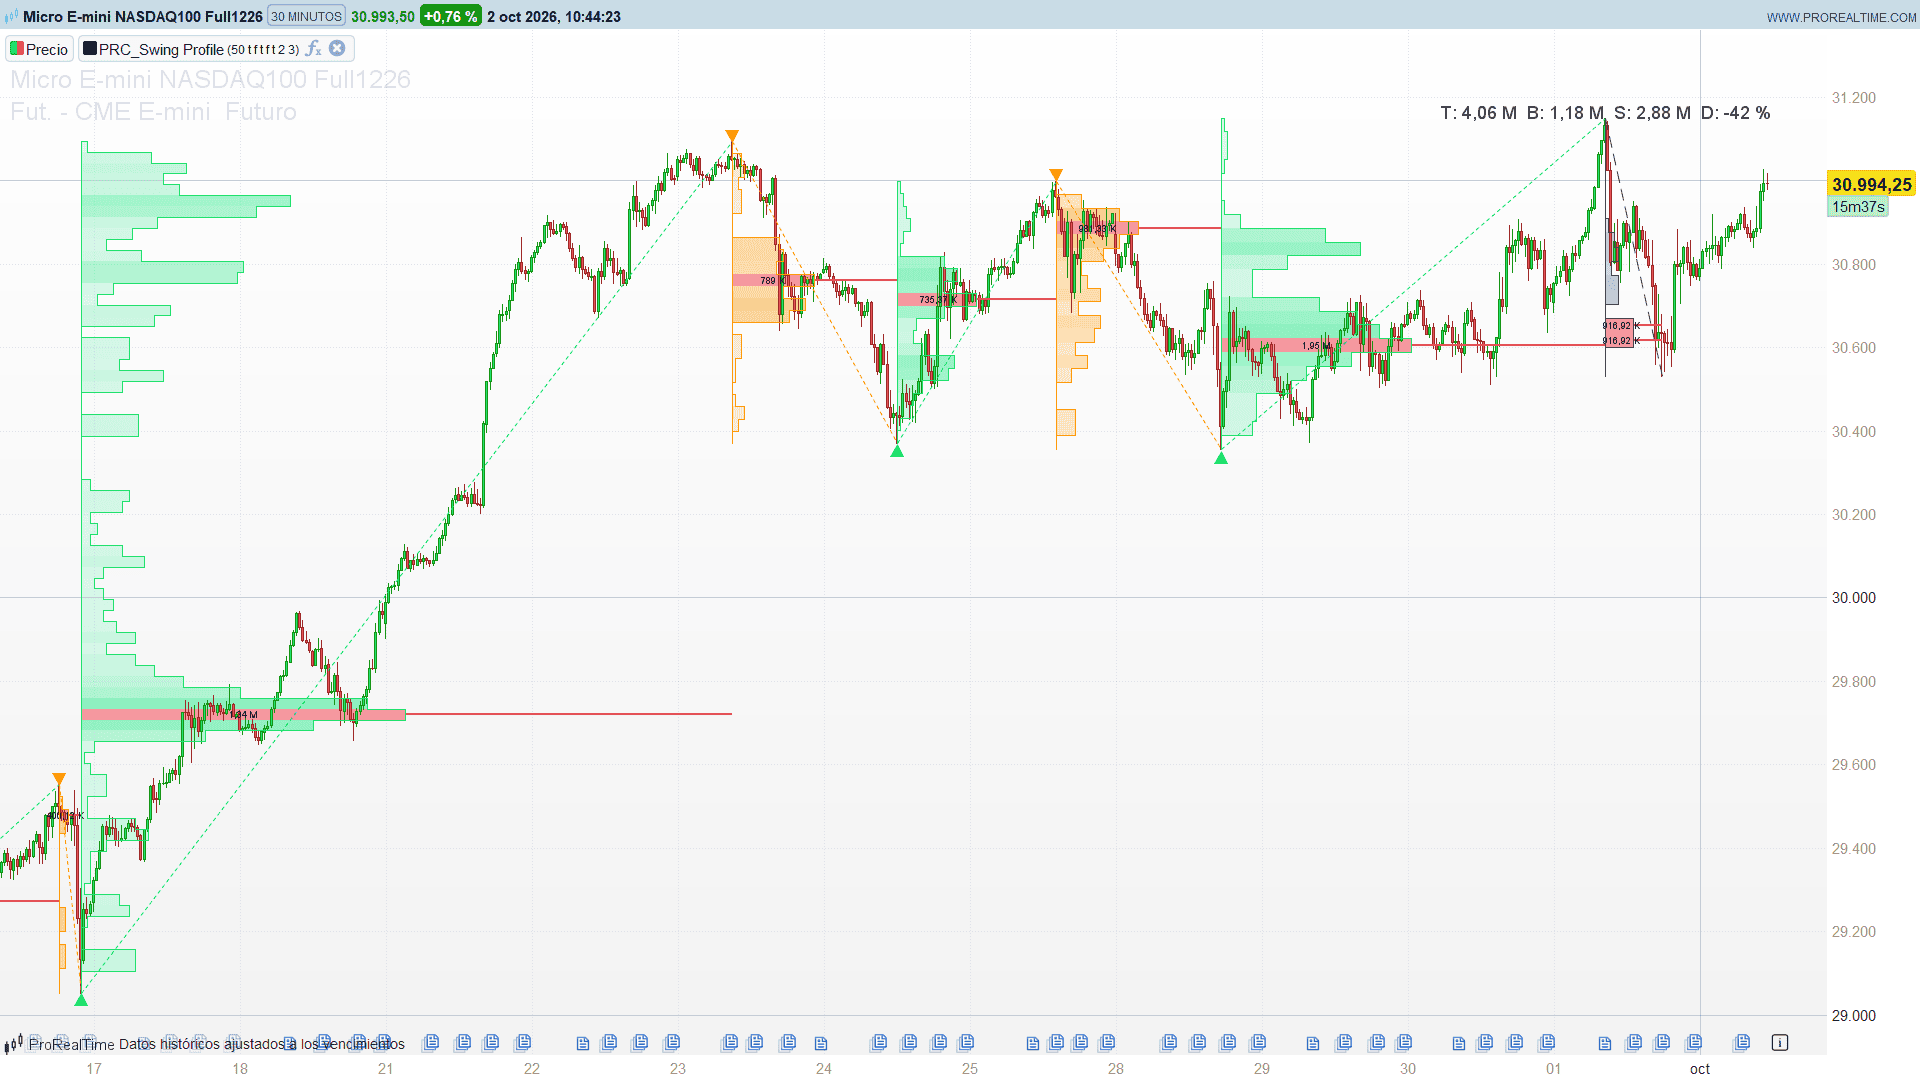
A classic volume profile is anchored to a session or to a fixed number of bars. Swing Profile anchors it to the market structure instead: every time a swing leg is completed, the indicator builds the volume profile of that leg alone, from the swing that started it to the swing that ended it. You get, for each impulse and each pullback, where the volume was traded, which price level was the point of control and how the leg was split between buying and selling volume.
The leg that is still forming is drawn live on the last bar, with a summary label of its total, buy and sell volume and its volume delta.
Theory Behind the Indicator
Finding the swings
The indicator keeps a direction flag. A new highest high over the last swingLen bars sets it to “down” (a down leg will start from that high) and a new lowest low over the same window sets it to “up”. A swing high is confirmed on the bar after the extreme, as soon as the high stops making a new swingLen-bar high; the same applies to swing lows.
When the direction flag changes, the leg between the last swing high and the last swing low is complete: a down leg (orange) runs from a swing high to a swing low and is closed when a new high appears; an up leg (lime) runs from a swing low to a swing high and is closed when a new low appears.
Building the profile of a leg
- The price range of the leg is split into bins of half an ATR(200).
- Every bar of the leg adds its volume to the bins whose middle is less than one bin height away from its close, so a close can feed up to two neighbouring bins.
- The volume of bullish bars (close above open) is counted as buy volume and the rest as sell volume.
- Each bin is drawn as a box starting at the first swing of the leg, with a length proportional to its volume (at most half the length of the leg) and an opacity that grows with the volume.
- The bin with the most volume is the point of control (POC): it is drawn in red, its volume is written inside and a line extends from the edge of the profile to the end of the leg.
Key Features at a Glance
- Swing detection over a configurable number of bars, with a zigzag that connects the confirmed swings (dotted, dashed or solid)
- One volume profile per completed swing leg, coloured by the direction of the leg
- Point of control of every leg, with its volume
- Live profile of the leg still forming, with total, buy and sell volume and volume delta in percent
- Optional heatmap mode that stretches every bin across the whole leg
- Configurable label size, POC width and colours
How to Read the Indicator
- The shape of the profile shows how the leg was traded. A profile with a single dominant bin means most of the volume went through one price level; a flat profile means the move travelled through its range without stopping.
- The position of the POC inside the leg tells you where the market accepted price. A POC close to the end of an impulse shows heavy trading at the extreme; a POC near the start shows that most of the volume was traded before the move accelerated.
- The POC line runs to the end of the leg, so you can follow how price behaved around that level for the rest of the swing.
- The live label on the forming leg gives the balance of the current swing: a positive delta means bullish bars carried more volume than bearish bars inside the bins.
Practical Applications
- Support and resistance from past legs. The POC of a completed leg is a natural reference level when price comes back into that range.
- Comparing impulses and pullbacks. A pullback with much less volume than the impulse before it, or with a delta that disagrees with its direction, is a sign that the counter move lacks participation.
- Reading the forming swing. The live profile shows, before the swing is confirmed, where the volume of the current move is concentrating.
Indicator Configuration
swingLen(default: 50, minimum 10): number of bars used to detect swing highs and lows.showProfile(default: 1): draw the volume profile of each leg.showHeatMap(default: 0): stretch each bin across the whole leg as a heatmap.showZigZag(default: 1): connect the confirmed swings.zigZagStyle(default: 0): 0 = dotted, 1 = dashed, 2 = solid.showPOC(default: 1): draw the point of control of each leg.pocWidth(default: 2): width of the POC line, from 1 to 4.dataSize(default: 1): size of the labels. 0 = tiny, 1 = small, 2 = normal, 3 = large, 4 = huge.- Colours:
upR/G/B(up legs),dnR/G/B(down legs),pocR/G/B(point of control) andfgR/G/B(leg still forming).
The indicator is calculated on the last 2000 bars, and the profiles need 200 bars of history for the ATR that sets the bin height.
Code
//---------------------------------------------------------------
// PRC_Swing Profile
// version = 0
// 02.10.2026
// Iván González @ www.prorealcode.com
// Author: BigBeluga
// Sharing ProRealTime knowledge
//--------------------------------------------------------------------//
DEFPARAM DRAWONLASTBARONLY = true
DEFPARAM CALCULATEONLASTBARS = 2000
//---------------------------------------------------------------
// INPUTS
//---------------------------------------------------------------
swingLen = 50          // swing length (minimum 10)
showProfile = 1        // 1 = volume profile of each swing leg
showHeatMap = 0        // 1 = stretch the bins across the whole leg (heatmap)
showZigZag = 1         // 1 = connect the confirmed swing points
zigZagStyle = 0        // 0 = dotted, 1 = dashed, 2 = solid
showPOC = 1            // 1 = point of control of each leg
pocWidth = 2           // POC line width (1 to 4)
dataSize = 1           // label size: 0 tiny, 1 small, 2 normal, 3 large, 4 huge
// colour of the up legs, swing low to swing high (lime)
upR = 0
upG = 230
upB = 118
// colour of the down legs, swing high to swing low (orange)
dnR = 255
dnG = 152
dnB = 0
// POC colour (red)
pocR = 242
pocG = 54
pocB = 69
// colour of the leg still forming (chart foreground)
fgR = 60
fgG = 60
fgB = 60
//---------------------------------------------------------------
// SWING DETECTION
//---------------------------------------------------------------
swingLen = max(10, swingLen)
hiSwing = highest[swingLen](high)
loSwing = lowest[swingLen](low)
atrV = averagetruerange[200](close)

// direction flag: 1 after a new swingLen-bar high, 0 after a new swingLen-bar low
ONCE isDown = 0
IF barindex >= swingLen - 1 THEN
   IF high = hiSwing THEN
      isDown = 1
   ENDIF
   IF low = loSwing THEN
      isDown = 0
   ENDIF
ENDIF

// a swing point is confirmed on the bar after the extreme
ONCE hsIdx = -1
ONCE hsPx = 0
ONCE lsIdx = -1
ONCE lsPx = 0
IF barindex >= swingLen THEN
   IF high[1] = hiSwing[1] AND high < hiSwing THEN
      hsIdx = barindex - 1
      hsPx = high[1]
   ENDIF
   IF low[1] = loSwing[1] AND low > loSwing THEN
      lsIdx = barindex - 1
      lsPx = low[1]
   ENDIF
ENDIF

// bin height = half an ATR(200)
binSize = 0
IF barindex >= 200 THEN
   binSize = atrV * 0.5
ENDIF

flip = 0
IF barindex > swingLen THEN
   IF isDown <> isDown[1] THEN
      flip = 1
   ENDIF
ENDIF
//---------------------------------------------------------------
// LEG PROFILES
// pass 1: the leg that has just been completed (direction flip), stored for good
// pass 2: the leg still forming, rebuilt on every tick of the last bar in the
//         free slot after the stored legs
// Every array cell written here is first reset and then rebuilt from the price
// series in the same pass, so the result does not depend on how many ticks ran.
//---------------------------------------------------------------
ONCE nLeg = 0
ONCE binPtr = 0
liveOk = 0
FOR ps = 1 TO 2 DO
   doLeg = 0
   IF hsIdx >= 0 AND lsIdx >= 0 THEN
      IF ps = 1 AND flip = 1 THEN
         doLeg = 1
      ENDIF
      IF ps = 2 AND islastbarupdate THEN
         doLeg = 1
      ENDIF
   ENDIF
   IF doLeg = 1 THEN
      q = nLeg
      p0 = binPtr
      legLo = min(hsPx, lsPx)
      legHi = max(hsPx, lsPx)
      lastI = max(hsIdx, lsIdx)
      prevI = min(hsIdx, lsIdx)
      $lgHsX[q] = hsIdx
      $lgHsY[q] = hsPx
      $lgLsX[q] = lsIdx
      $lgLsY[q] = lsPx
      $lgLo[q] = legLo
      $lgHi[q] = legHi
      $lgPrev[q] = prevI
      $lgLast[q] = lastI
      $lgDir[q] = isDown
      $lgOff[q] = binSize
      $lgPtr[q] = p0
      nBin = 0
      IF binSize > 0 THEN
         nBin = floor(abs(hsPx - lsPx) / binSize)
      ENDIF
      binStp = 0
      vMax = 0
      vTot = 0
      vBuy = 0
      vSell = 0
      IF nBin >= 1 THEN
         binStp = abs(hsPx - lsPx) / nBin
         FOR k = 0 TO nBin - 1 DO
            $bVol[p0 + k] = 0
            $bBuy[p0 + k] = 0
            $bSell[p0 + k] = 0
         NEXT
         // every close of the leg feeds the bins whose middle is closer than one bin height
         // (at most two bins, around floor(uPos); one extra candidate on each side keeps
         // closes that sit exactly on a boundary identical to a full scan of the bins)
         FOR i = barindex - lastI TO barindex - prevI DO
            candC = close[i]
            candO = open[i]
            candV = volume[i]
            uPos = (candC - legLo) / binStp - 0.5
            kA = floor(uPos)
            FOR kk = kA - 1 TO kA + 2 DO
               IF kk >= 0 AND kk <= nBin - 1 THEN
                  binMid = legLo + kk * binStp + binStp / 2
                  IF abs(binMid - candC) < binStp THEN
                     $bVol[p0 + kk] = $bVol[p0 + kk] + candV
                     IF candC > candO THEN
                        $bBuy[p0 + kk] = $bBuy[p0 + kk] + candV
                     ELSE
                        $bSell[p0 + kk] = $bSell[p0 + kk] + candV
                     ENDIF
                  ENDIF
               ENDIF
            NEXT
         NEXT
         FOR k = 0 TO nBin - 1 DO
            vMax = max(vMax, $bVol[p0 + k])
            vTot = vTot + $bVol[p0 + k]
            vBuy = vBuy + $bBuy[p0 + k]
            vSell = vSell + $bSell[p0 + k]
         NEXT
      ENDIF
      $lgNb[q] = nBin
      $lgStp[q] = binStp
      $lgMax[q] = vMax
      $lgTot[q] = vTot
      $lgBuy[q] = vBuy
      $lgSell[q] = vSell
      IF ps = 1 THEN
         nLeg = nLeg + 1
         binPtr = binPtr + nBin
      ELSE
         liveOk = 1
      ENDIF
   ENDIF
NEXT
//---------------------------------------------------------------
// DRAWING
//---------------------------------------------------------------
IF islastbarupdate AND nLeg + liveOk > 0 THEN
   nDraw = nLeg + liveOk
   FOR q = 0 TO nDraw - 1 DO
      isLive = 0
      IF q = nLeg THEN
         isLive = 1
      ENDIF
      IF isLive = 1 THEN
         mR = fgR
         mG = fgG
         mB = fgB
      ELSIF $lgDir[q] = 1 THEN
         mR = dnR
         mG = dnG
         mB = dnB
      ELSE
         mR = upR
         mG = upG
         mB = upB
      ENDIF
      prevI = $lgPrev[q]
      lastI = $lgLast[q]
      legLo = $lgLo[q]
      legHi = $lgHi[q]
      nBin = $lgNb[q]
      binStp = $lgStp[q]
      p0 = $lgPtr[q]
      vMax = $lgMax[q]
      offY = $lgOff[q] * 0.5
      zx1 = $lgHsX[q]
      zy1 = $lgHsY[q]
      zx2 = $lgLsX[q]
      zy2 = $lgLsY[q]

      // zigzag: dashed preview for the forming leg, chosen style for completed legs
      IF isLive = 1 THEN
         DRAWSEGMENT(zx1, zy1, zx2, zy2) COLOURED(mR, mG, mB) STYLE(dottedline2, 1)
      ELSIF showZigZag = 1 THEN
         IF zigZagStyle = 0 THEN
            DRAWSEGMENT(zx1, zy1, zx2, zy2) COLOURED(mR, mG, mB) STYLE(dottedline, 1)
         ELSIF zigZagStyle = 1 THEN
            DRAWSEGMENT(zx1, zy1, zx2, zy2) COLOURED(mR, mG, mB) STYLE(dottedline2, 1)
         ELSE
            DRAWSEGMENT(zx1, zy1, zx2, zy2) COLOURED(mR, mG, mB) STYLE(line, 1)
         ENDIF
      ENDIF

      IF nBin >= 1 AND vMax > 0 THEN
         halfW = (lastI - prevI) / 2
         olA = 255
         IF showHeatMap = 1 THEN
            olA = 127
         ENDIF
         prevW = 0
         FOR k = 0 TO nBin - 1 DO
            binLo = legLo + k * binStp
            binHi = binLo + binStp
            binV = $bVol[p0 + k]
            vRatio = binV / vMax
            profW = floor(vRatio * halfW)
            isPoc = 0
            IF binV = vMax THEN
               isPoc = 1
            ENDIF
            IF showProfile = 1 THEN
               xL = prevI + profW
            ELSE
               xL = prevI
            ENDIF
            IF showHeatMap = 1 THEN
               xR = lastI
            ELSE
               xR = prevI
            ENDIF

            // bin: transparency grows with the volume of the bin, the POC bin takes the POC colour
            IF showProfile = 1 OR showHeatMap = 1 THEN
               IF isPoc = 1 AND showPOC = 1 THEN
                  fR = pocR
                  fG = pocG
                  fB = pocB
                  fA = 127
               ELSE
                  fR = mR
                  fG = mG
                  fB = mB
                  fA = round(25 + vRatio * 102)
               ENDIF
               DRAWRECTANGLE(xL, binHi, xR, binLo) COLOURED(fR, fG, fB, 0) FILLCOLOR(fR, fG, fB, fA)
            ENDIF

            // point of control: from the edge of the profile to the end of the leg
            IF isPoc = 1 AND showPOC = 1 THEN
               pocY = (binLo + binHi) / 2
               IF pocWidth <= 1 THEN
                  DRAWSEGMENT(xL, pocY, lastI, pocY) COLOURED(pocR, pocG, pocB) STYLE(line, 1)
               ELSIF pocWidth = 2 THEN
                  DRAWSEGMENT(xL, pocY, lastI, pocY) COLOURED(pocR, pocG, pocB) STYLE(line, 2)
               ELSIF pocWidth = 3 THEN
                  DRAWSEGMENT(xL, pocY, lastI, pocY) COLOURED(pocR, pocG, pocB) STYLE(line, 3)
               ELSE
                  DRAWSEGMENT(xL, pocY, lastI, pocY) COLOURED(pocR, pocG, pocB) STYLE(line, 4)
               ENDIF
            ENDIF

            // volume of the POC bin, written inside it
            IF isPoc = 1 AND showHeatMap = 0 THEN
               txtX = round((xL + xR) / 2)
               txtY = (binLo + binHi) / 2
               IF binV >= 1000000000 THEN
                  vTxt = round(binV / 10000000) / 100
                  DRAWTEXT("#vTxt#B", txtX, txtY, SansSerif, Standard, 9) COLOURED(0, 0, 0)
               ELSIF binV >= 1000000 THEN
                  vTxt = round(binV / 10000) / 100
                  DRAWTEXT("#vTxt#M", txtX, txtY, SansSerif, Standard, 9) COLOURED(0, 0, 0)
               ELSIF binV >= 1000 THEN
                  vTxt = round(binV / 10) / 100
                  DRAWTEXT("#vTxt#K", txtX, txtY, SansSerif, Standard, 9) COLOURED(0, 0, 0)
               ELSE
                  vTxt = round(binV * 100) / 100
                  DRAWTEXT("#vTxt#", txtX, txtY, SansSerif, Standard, 9) COLOURED(0, 0, 0)
               ENDIF
            ENDIF

            // outline of the profile
            IF showProfile = 1 THEN
               IF k = 0 THEN
                  DRAWSEGMENT(prevI, binLo, prevI + profW, binLo) COLOURED(mR, mG, mB, olA)
               ELSE
                  DRAWSEGMENT(prevI + prevW, binLo, prevI + profW, binLo) COLOURED(mR, mG, mB, olA)
               ENDIF
               DRAWSEGMENT(prevI + profW, binLo, prevI + profW, binHi) COLOURED(mR, mG, mB, olA)
               IF k = nBin - 1 THEN
                  DRAWSEGMENT(prevI + profW, binHi, prevI, binHi) COLOURED(mR, mG, mB, olA)
                  DRAWSEGMENT(prevI, binHi, prevI, legLo) COLOURED(mR, mG, mB, olA)
               ENDIF
            ENDIF
            prevW = profW
         NEXT
      ENDIF

      // labels
      IF isLive = 0 THEN
         // completed leg: arrow at the start of the leg
         IF $lgDir[q] = 1 THEN
            lbY = legHi + offY
            IF dataSize = 0 THEN
               DRAWTEXT("▼", prevI, lbY, SansSerif, Standard, 8) COLOURED(mR, mG, mB)
            ELSIF dataSize = 1 THEN
               DRAWTEXT("▼", prevI, lbY, SansSerif, Standard, 11) COLOURED(mR, mG, mB)
            ELSIF dataSize = 2 THEN
               DRAWTEXT("▼", prevI, lbY, SansSerif, Standard, 14) COLOURED(mR, mG, mB)
            ELSIF dataSize = 3 THEN
               DRAWTEXT("▼", prevI, lbY, SansSerif, Standard, 18) COLOURED(mR, mG, mB)
            ELSE
               DRAWTEXT("▼", prevI, lbY, SansSerif, Standard, 24) COLOURED(mR, mG, mB)
            ENDIF
         ELSE
            lbY = legLo - offY
            IF dataSize = 0 THEN
               DRAWTEXT("▲", prevI, lbY, SansSerif, Standard, 8) COLOURED(mR, mG, mB)
            ELSIF dataSize = 1 THEN
               DRAWTEXT("▲", prevI, lbY, SansSerif, Standard, 11) COLOURED(mR, mG, mB)
            ELSIF dataSize = 2 THEN
               DRAWTEXT("▲", prevI, lbY, SansSerif, Standard, 14) COLOURED(mR, mG, mB)
            ELSIF dataSize = 3 THEN
               DRAWTEXT("▲", prevI, lbY, SansSerif, Standard, 18) COLOURED(mR, mG, mB)
            ELSE
               DRAWTEXT("▲", prevI, lbY, SansSerif, Standard, 24) COLOURED(mR, mG, mB)
            ENDIF
         ENDIF
      ELSIF nBin >= 1 AND vMax > 0 THEN
         // forming leg: total, buy and sell volume of the bins and the delta in percent
         vTot = $lgTot[q]
         IF isDown = 0 THEN
            lbY = legHi + offY
         ELSE
            lbY = legLo - offY
         ENDIF
         dPct = round(($lgBuy[q] - $lgSell[q]) / vTot * 10000) / 100
         IF vTot >= 1000000000 THEN
            vDiv = 1000000000
            vUnit = 3
         ELSIF vTot >= 1000000 THEN
            vDiv = 1000000
            vUnit = 2
         ELSIF vTot >= 1000 THEN
            vDiv = 1000
            vUnit = 1
         ELSE
            vDiv = 1
            vUnit = 0
         ENDIF
         tT = round(vTot / vDiv * 100) / 100
         tB = round($lgBuy[q] / vDiv * 100) / 100
         tS = round($lgSell[q] / vDiv * 100) / 100
         IF vUnit = 3 THEN
            IF dataSize = 0 THEN
               DRAWTEXT("T: #tT#B  B: #tB#B  S: #tS#B  D: #dPct#%", prevI, lbY, SansSerif, Standard, 8) COLOURED(mR, mG, mB)
            ELSIF dataSize = 1 THEN
               DRAWTEXT("T: #tT#B  B: #tB#B  S: #tS#B  D: #dPct#%", prevI, lbY, SansSerif, Standard, 11) COLOURED(mR, mG, mB)
            ELSIF dataSize = 2 THEN
               DRAWTEXT("T: #tT#B  B: #tB#B  S: #tS#B  D: #dPct#%", prevI, lbY, SansSerif, Standard, 14) COLOURED(mR, mG, mB)
            ELSIF dataSize = 3 THEN
               DRAWTEXT("T: #tT#B  B: #tB#B  S: #tS#B  D: #dPct#%", prevI, lbY, SansSerif, Standard, 18) COLOURED(mR, mG, mB)
            ELSE
               DRAWTEXT("T: #tT#B  B: #tB#B  S: #tS#B  D: #dPct#%", prevI, lbY, SansSerif, Standard, 24) COLOURED(mR, mG, mB)
            ENDIF
         ELSIF vUnit = 2 THEN
            IF dataSize = 0 THEN
               DRAWTEXT("T: #tT#M  B: #tB#M  S: #tS#M  D: #dPct#%", prevI, lbY, SansSerif, Standard, 8) COLOURED(mR, mG, mB)
            ELSIF dataSize = 1 THEN
               DRAWTEXT("T: #tT#M  B: #tB#M  S: #tS#M  D: #dPct#%", prevI, lbY, SansSerif, Standard, 11) COLOURED(mR, mG, mB)
            ELSIF dataSize = 2 THEN
               DRAWTEXT("T: #tT#M  B: #tB#M  S: #tS#M  D: #dPct#%", prevI, lbY, SansSerif, Standard, 14) COLOURED(mR, mG, mB)
            ELSIF dataSize = 3 THEN
               DRAWTEXT("T: #tT#M  B: #tB#M  S: #tS#M  D: #dPct#%", prevI, lbY, SansSerif, Standard, 18) COLOURED(mR, mG, mB)
            ELSE
               DRAWTEXT("T: #tT#M  B: #tB#M  S: #tS#M  D: #dPct#%", prevI, lbY, SansSerif, Standard, 24) COLOURED(mR, mG, mB)
            ENDIF
         ELSIF vUnit = 1 THEN
            IF dataSize = 0 THEN
               DRAWTEXT("T: #tT#K  B: #tB#K  S: #tS#K  D: #dPct#%", prevI, lbY, SansSerif, Standard, 8) COLOURED(mR, mG, mB)
            ELSIF dataSize = 1 THEN
               DRAWTEXT("T: #tT#K  B: #tB#K  S: #tS#K  D: #dPct#%", prevI, lbY, SansSerif, Standard, 11) COLOURED(mR, mG, mB)
            ELSIF dataSize = 2 THEN
               DRAWTEXT("T: #tT#K  B: #tB#K  S: #tS#K  D: #dPct#%", prevI, lbY, SansSerif, Standard, 14) COLOURED(mR, mG, mB)
            ELSIF dataSize = 3 THEN
               DRAWTEXT("T: #tT#K  B: #tB#K  S: #tS#K  D: #dPct#%", prevI, lbY, SansSerif, Standard, 18) COLOURED(mR, mG, mB)
            ELSE
               DRAWTEXT("T: #tT#K  B: #tB#K  S: #tS#K  D: #dPct#%", prevI, lbY, SansSerif, Standard, 24) COLOURED(mR, mG, mB)
            ENDIF
         ELSE
            IF dataSize = 0 THEN
               DRAWTEXT("T: #tT#  B: #tB#  S: #tS#  D: #dPct#%", prevI, lbY, SansSerif, Standard, 8) COLOURED(mR, mG, mB)
            ELSIF dataSize = 1 THEN
               DRAWTEXT("T: #tT#  B: #tB#  S: #tS#  D: #dPct#%", prevI, lbY, SansSerif, Standard, 11) COLOURED(mR, mG, mB)
            ELSIF dataSize = 2 THEN
               DRAWTEXT("T: #tT#  B: #tB#  S: #tS#  D: #dPct#%", prevI, lbY, SansSerif, Standard, 14) COLOURED(mR, mG, mB)
            ELSIF dataSize = 3 THEN
               DRAWTEXT("T: #tT#  B: #tB#  S: #tS#  D: #dPct#%", prevI, lbY, SansSerif, Standard, 18) COLOURED(mR, mG, mB)
            ELSE
               DRAWTEXT("T: #tT#  B: #tB#  S: #tS#  D: #dPct#%", prevI, lbY, SansSerif, Standard, 24) COLOURED(mR, mG, mB)
            ENDIF
         ENDIF
      ENDIF
   NEXT
ENDIF
RETURN
Conclusion
Swing Profile ties volume to market structure. Instead of one profile for a session, you get one for every swing, which makes it easy to compare impulses and pullbacks, find the level where each leg was accepted and follow the balance of the swing that is still forming.