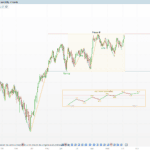
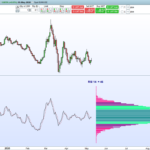
Multi-Distribution Volume Profile
Introduction
A volume profile answers a simple question: at which prices did the market trade the most? To build it, every bar’s volume has to be assigned to the price levels it covered. Most profiles make one silent assumption here, usually that the volume was spread evenly between the low and the high of the bar. That assumption shapes the whole picture, yet it is rarely visible or adjustable.
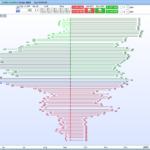
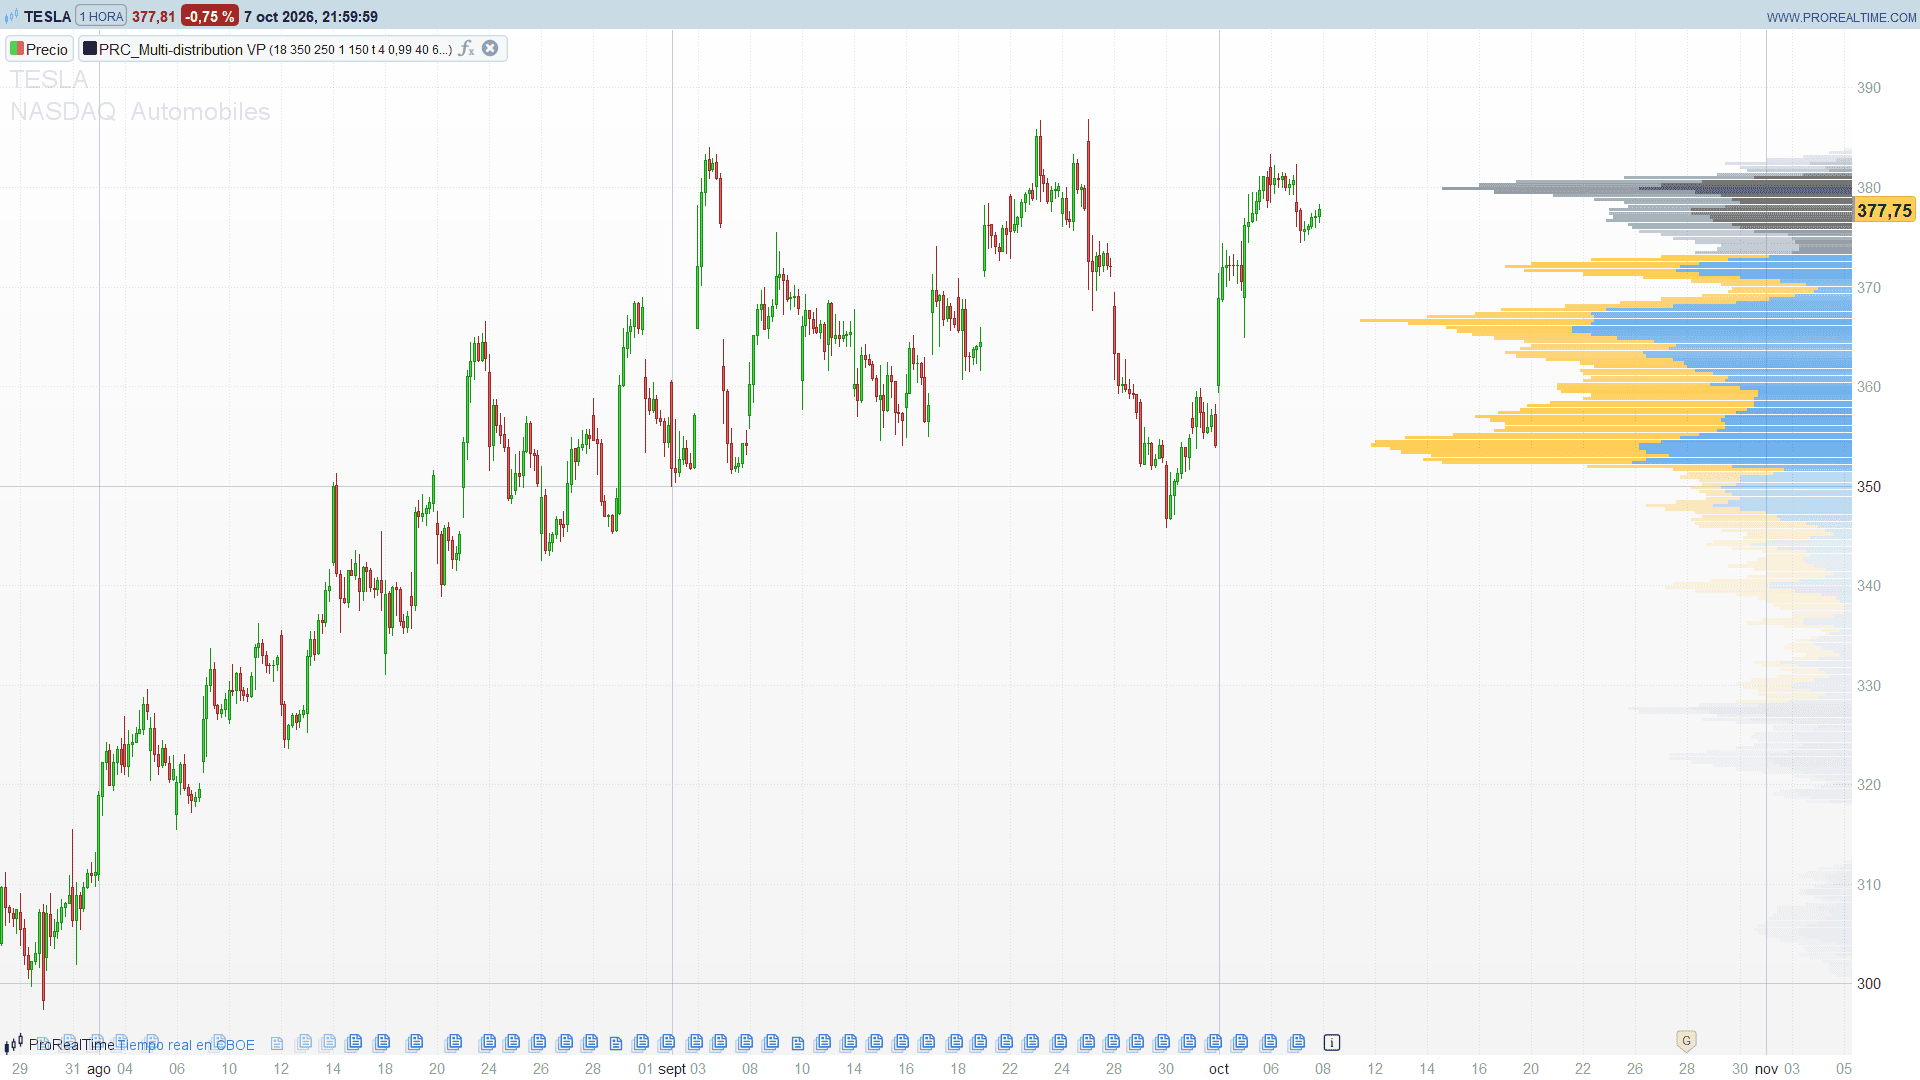
Multi-Distribution Volume Profile by Zeiierman makes it explicit. It offers 30 ways to distribute each bar’s volume over its price rows, from the classic uniform spread to body-only, wick-only, single-price and 18 statistical shapes such as Gaussian, Laplace, Student-t or Pareto. Each row is split into bullish and bearish volume, the central band holding most of the volume is highlighted, and the opacity of each row can follow a second metric: freshness, volatility, dwell time, reversal density and more.
Theory Behind the Indicator
Building the rows
The indicator takes the last 240 bars (adjustable), finds their highest high and lowest low and splits that range into up to 250 price rows. Every bar is then projected onto the rows between its low and its high, and its volume is shared among those rows according to the chosen build mode. A bar that closes at or above its open adds to the bullish side of the row, any other bar to the bearish side.
The build modes
- Range modes: Range Uniform spreads the volume evenly from low to high; Range Body Only uses only the rows of the candle body; Range Wick Only uses only the wick rows.
- Single price: Midpoint Only, Close Price Only and Open Price Only put the whole volume of the bar in one row.
- Center weighted: HL2 Center Weighted and Body Center Weighted give more weight to the middle of the range or of the body, falling linearly towards the edges.
- Volume variants: Recent-Weighted Volume multiplies each bar’s volume by the decay factor raised to its age; Volume Squared (Hard) uses volume squared, so the heaviest bars dominate; Up Bars Only and Down Bars Only keep only one candle colour.
- Statistical shapes: the bar’s range is mapped to a position from 0 (low) to 1 (high) and each row gets the weight of a shape at that position: Linear, Triangular Center, Exponential to High, Cosine Centered, PERT, Gaussian Center (the default), Lognormal, Cauchy, Laplace, Pareto, Weibull, Logistic, Gumbel, Gamma, Beta, Chi-Square, Student-t and F. The weights are normalised so that each bar still contributes its full volume.
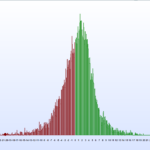
The choice matters. A Gaussian or Laplace shape assumes that most trading happened near the middle of the bar and produces a sharper profile with clearer peaks; heavy-tailed shapes such as Cauchy or Student-t give more weight to the extremes; skewed shapes such as Exponential to High, Lognormal or Pareto lean the volume towards one end of each bar.
The central band
Rows are accumulated from the bottom of the range. The central band starts where the running total passes the lower tail and ends where it reaches the upper one: with the default 68 %, it covers the volume between the 16th and the 84th percentile of the profile. Rows inside the band use their own bullish and bearish colours.
Fade metrics
With the gradient on, the opacity of each row goes from almost transparent to fully opaque according to one of nine metrics, each one relative to the largest row:
- Volume: total volume of the row.
- Price Hits: how many bars touched the row.
- Blended: the average of the two above.
- Freshness (default): every touch adds the decay factor raised to the age of the bar, so rows visited recently stand out.
- Volatility Impact: range of the bars that touched the row.
- Dwell Time: time spent in the row, counting each bar’s share of its range.
- Reversal Density: touches by bars whose colour flipped against the previous bar.
- Compression: touches by narrow bars, where the row height is large relative to the bar’s range.
- Liquidity Void: the inverse of volume, highlighting the thinnest rows.
Key Features at a Glance
- 30 build modes for distributing each bar’s volume across price.
- Bullish and bearish volume shown side by side in every row.
- Central band (value area) with its own colours, adjustable from 10 % to 95 %.
- Nine fade metrics to colour the rows by something other than volume.
- Four layouts: right side with an offset, left side of the window, or a vertical histogram under or over the price.
- Rebuilt on every update of the last bar, with no state carried between ticks.
How to Read the Indicator
- Long rows are the prices where the most volume was exchanged; they tend to act as magnets and as support or resistance when price returns to them.
- Short rows inside the range are low volume areas that price usually crosses quickly. Switch the fade metric to Liquidity Void to make them stand out.
- Bullish versus bearish split: a row dominated by bullish volume was mostly traded during rising bars, a row dominated by bearish volume during falling bars.
- Central band: the area where most of the business happened. Price leaving the band with conviction is a sign of a new balance being sought; price returning inside it suggests acceptance of the old one.
- Comparing modes: switching between Range Uniform, Close Price Only and a statistical shape on the same chart shows how much of the profile’s shape comes from the assumption itself. Peaks that survive every mode are the most robust.
Practical Applications
- Support and resistance: use the longest rows and the edges of the central band as reference levels for entries, stops and targets.
- Breakout context: a breakout from the central band into a thin area of the profile has less volume to absorb it than one that runs straight into a heavy row.
- Recency filter: with the Freshness metric, old heavy rows fade out, so the profile shows which levels are still being defended now.
- Intraday versus swing: on intraday charts a short lookback (a session or two) gives a working profile for the day; on daily charts a lookback of one year shows the main acceptance areas.
Indicator Configuration
Profile:
- profileMode (default: 18): build mode, from 1 to 30 (the full list is in the comments at the top of the code; 18 = Gaussian Center).
- barsLookback (default: 240): number of bars included, from 50 to 4000.
- levelsIn (default: 250): number of price rows, from 8 to 250.
Layout:
- sideChoice (default: 1): 1 right side, 2 left side, 3 bottom, 4 top.
- edgeOffsetBars (default: 100): offset in bars from the last bar when the profile is on the right side.
Style:
- useGradient (default: 1): fade the rows with the selected metric.
- fadeMode (default: 4): 1 Volume, 2 Price Hits, 3 Blended, 4 Freshness, 5 Volatility Impact, 6 Dwell Time, 7 Reversal Density, 8 Compression, 9 Liquidity Void.
- freshDecay (default: 0.99): per-bar decay of the Freshness metric and of the Recent-Weighted Volume mode, from 0.90 to 0.999.
- thicknessPct (default: 40): profile thickness as a percentage of the lookback window (capped at 360 bars).
- centerBandPct (default: 68): percentage of the volume included in the central band.
- bandUpR/G/B/A, bandDnR/G/B/A: bullish and bearish colours inside the central band.
- bodyUpR/G/B/A, bodyDnR/G/B/A: bullish and bearish colours outside the band.
Code
//---------------------------------------------------------------
// PRC_Multi-Distribution VP
// version = 0
// 08.10.2026
// Iván González @ www.prorealcode.com
// Author: Zeiierman
// Sharing ProRealTime knowledge
//--------------------------------------------------------------------//
defparam drawonlastbaronly = true
//---------------------------------------------------------------
// SETTINGS
//---------------------------------------------------------------
// Profile build mode: how each bar's volume is spread over its price rows
// 1 Range Uniform 2 Range Body Only 3 Range Wick Only
// 4 Midpoint Only 5 Close Price Only 6 Open Price Only
// 7 HL2 Center Weighted 8 Body Center Weighted 9 Recent-Weighted Volume
// 10 Volume Squared (Hard) 11 Up Bars Only 12 Down Bars Only
// 13 Linear 14 Triangular Center 15 Exponential to High
// 16 Cosine Centered 17 PERT 18 Gaussian Center
// 19 Lognormal (Right-Skew) 20 Cauchy (Heavy Tails) 21 Laplace (Sharp Center)
// 22 Pareto (Tail-heavy) 23 Weibull (Shape Bias) 24 Logistic (S-Curve)
// 25 Gumbel (Extreme Value) 26 Gamma (Right-Skew) 27 Beta (Flexible Shape)
// 28 Chi-Square (Right-Tail) 29 Student-t (Fat Tails) 30 F-Shape (Variance Tail)
profileMode = 18
barsLookback = 240 // bars included (50 to 4000)
levelsIn = 250 // price levels / rows (8 to 250)
// Layout: 1 = Right Side, 2 = Left Side, 3 = Bottom, 4 = Top
sideChoice = 1
edgeOffsetBars = 100 // offset in bars from the last bar (right side only)
// Style
useGradient = 1 // fade the rows with the metric below
// Fade metric: 1 Volume, 2 Price Hits, 3 Blended (Vol+Hits), 4 Freshness,
// 5 Volatility Impact, 6 Dwell Time, 7 Reversal Density, 8 Compression, 9 Liquidity Void
fadeMode = 4
freshDecay = 0.99 // per-bar decay of the Freshness metric (0.90 to 0.999)
thicknessPct = 40 // profile thickness, % of the lookback window (5 to 250)
centerBandPct = 68 // % of the volume in the central band around the middle
// Colours (R, G, B and opacity 0-255)
bandUpR = 30 // bullish rows inside the central band
bandUpG = 136
bandUpB = 229
bandUpA = 191
bandDnR = 255 // bearish rows inside the central band
bandDnG = 179
bandDnB = 0
bandDnA = 191
bodyUpR = 97 // bullish rows outside the band
bodyUpG = 97
bodyUpB = 97
bodyUpA = 127
bodyDnR = 144 // bearish rows outside the band
bodyDnG = 164
bodyDnB = 174
bodyDnA = 115
//---------------------------------------------------------------
// PROFILE (rebuilt from scratch on the last bar)
//---------------------------------------------------------------
IF islastbarupdate THEN
lookbackBars = min(barsLookback, barindex + 1)
profStartIdx = barindex - lookbackBars + 1
profLow = lowest[lookbackBars](low)
profHigh = highest[lookbackBars](high)
priceSpan = profHigh - profLow
nRows = max(levelsIn, 1)
IF priceSpan > 0 THEN
pStep = priceSpan / nRows
thick = thicknessPct / 100
bandPct = centerBandPct / 100
// reset the per-row statistics
FOR rw = 0 TO nRows - 1 DO
$vT[rw] = 0
$vU[rw] = 0
$vD[rw] = 0
$hit[rw] = 0
$rev[rw] = 0
$vlt[rw] = 0
$dwl[rw] = 0
$rcy[rw] = 0
$cmp[rw] = 0
NEXT
customDist = profileMode >= 13
//------------------------------------------------------------
// accumulate every bar of the window
//------------------------------------------------------------
FOR iBar = 0 TO lookbackBars - 1 DO
bLow = low[iBar]
bHigh = high[iBar]
bVol = volume[iBar]
bOpen = open[iBar]
bClose = close[iBar]
isUp = bClose >= bOpen
bRange = bHigh - bLow
IF bClose > bOpen THEN
cDir = 1
ELSIF bOpen > bClose THEN
cDir = -1
ELSE
cDir = 0
ENDIF
pDir = 0
IF barindex >= iBar + 1 THEN
IF close[iBar + 1] > open[iBar + 1] THEN
pDir = 1
ELSIF open[iBar + 1] > close[iBar + 1] THEN
pDir = -1
ENDIF
ENDIF
// reversal bar: candle colour flips against the previous one
isRev = (cDir * pDir = -1)
bodyLow = min(bOpen, bClose)
bodyHigh = max(bOpen, bClose)
startRow = max(floor((bLow - profLow) / pStep), 0)
endRow = min(floor((bHigh - profLow) / pStep), nRows - 1)
spanR = endRow - startRow + 1
bodyStart = max(floor((bodyLow - profLow) / pStep), 0)
bodyEnd = min(floor((bodyHigh - profLow) / pStep), nRows - 1)
IF bodyEnd >= bodyStart THEN
bodySpan = bodyEnd - bodyStart + 1
ELSE
bodySpan = 0
ENDIF
IF bodyStart > startRow THEN
lowWick = bodyStart - startRow
ELSE
lowWick = 0
ENDIF
IF endRow > bodyEnd THEN
highWick = endRow - bodyEnd
ELSE
highWick = 0
ENDIF
wickSpan = lowWick + highWick
wRec = pow(freshDecay, iBar)
effVol = bVol
IF profileMode = 9 THEN
effVol = bVol * wRec
ENDIF
IF profileMode = 10 THEN
effVol = bVol * bVol
ENDIF
IF profileMode = 11 AND NOT isUp THEN
effVol = 0
ENDIF
IF profileMode = 12 AND isUp THEN
effVol = 0
ENDIF
IF spanR > 0 AND effVol > 0 THEN
midRow = min(max(floor(((bHigh + bLow) * 0.5 - profLow) / pStep), 0), nRows - 1)
closeRow = min(max(floor((bClose - profLow) / pStep), 0), nRows - 1)
openRow = min(max(floor((bOpen - profLow) / pStep), 0), nRows - 1)
// statistical shapes: weight of each row of the bar, t = 0 at the low, 1 at the high
sumW = 0
IF customDist THEN
FOR k = 0 TO spanR - 1 DO
IF spanR = 1 THEN
tK = 0.5
ELSE
tK = k / (spanR - 1)
ENDIF
tS = min(0.999, max(0.001, tK))
wK = 0
IF profileMode = 13 THEN
wK = tS
ELSIF profileMode = 14 THEN
wK = 1 - abs(tK - 0.5) * 2
ELSIF profileMode = 15 THEN
wK = pow(1.3, tK * (spanR - 1))
ELSIF profileMode = 16 THEN
// cos() works in degrees: 2*pi radians = 360
wK = 0.5 - 0.5 * cos(360 * tK)
ELSIF profileMode = 17 THEN
wK = pow(tS, 1.5) * pow(1 - tS, 1.5)
ELSIF profileMode = 18 THEN
zG = (tK - 0.5) / 0.2
wK = exp(-0.5 * zG * zG)
ELSIF profileMode = 19 THEN
zL = (log(tS) + 0.5) / 0.4
wK = exp(-0.5 * zL * zL) / tS
ELSIF profileMode = 20 THEN
xC = (tK - 0.5) / 0.18
wK = 1 / (1 + xC * xC)
ELSIF profileMode = 21 THEN
wK = exp(0 - abs(tK - 0.5) / 0.18)
ELSIF profileMode = 22 THEN
wK = 1 / pow(1 - tS + 0.001, 2)
ELSIF profileMode = 23 THEN
wK = 2 * tS * exp(0 - tS * tS)
ELSIF profileMode = 24 THEN
wK = 1 / (1 + exp(0 - (tK - 0.5) / 0.12))
ELSIF profileMode = 25 THEN
zU = (tK - 0.5) / 0.2
wK = exp(0 - (zU + exp(0 - zU)))
ELSIF profileMode = 26 THEN
wK = tS * exp(0 - tS / 0.5)
ELSIF profileMode = 27 THEN
wK = pow(tS, -0.5) * pow(1 - tS, -0.5)
ELSIF profileMode = 28 THEN
wK = pow(tS, 0.5) * exp(0 - tS / 2)
ELSIF profileMode = 29 THEN
xT = (tK - 0.5) / 0.22
wK = pow(1 + xT * xT / 3, -2)
ELSIF profileMode = 30 THEN
wK = pow(tS, 0.5) / pow(1 + 0.6 * tS, 4)
ENDIF
$wK[k] = wK
IF wK > 0 THEN
sumW = sumW + wK
ENDIF
NEXT
ENDIF
FOR rw = startRow TO endRow DO
rowW = 0
isBodyRow = rw >= bodyStart AND bodyEnd >= rw AND bodySpan > 0
isWickRow = wickSpan > 0 AND NOT isBodyRow
IF profileMode = 1 OR profileMode = 9 OR profileMode = 10 OR profileMode = 11 OR profileMode = 12 THEN
rowW = 1 / spanR
ELSIF profileMode = 2 THEN
IF isBodyRow THEN
rowW = 1 / bodySpan
ENDIF
ELSIF profileMode = 3 THEN
IF isWickRow THEN
rowW = 1 / wickSpan
ENDIF
ELSIF profileMode = 4 THEN
IF rw = midRow THEN
rowW = 1
ENDIF
ELSIF profileMode = 5 THEN
IF rw = closeRow THEN
rowW = 1
ENDIF
ELSIF profileMode = 6 THEN
IF rw = openRow THEN
rowW = 1
ENDIF
ELSIF profileMode = 7 THEN
IF spanR > 1 THEN
distN = min(1, abs(rw - midRow) / (spanR - 1))
ELSE
distN = 0
ENDIF
IF 1 - distN > 0 THEN
rowW = (1 - distN) / spanR
ENDIF
ELSIF profileMode = 8 THEN
IF isBodyRow THEN
bodyMid = (bodyStart + bodyEnd) * 0.5
IF bodySpan > 1 THEN
bNorm = bodySpan - 1
ELSE
bNorm = 1
ENDIF
distB = min(1, abs(rw - bodyMid) / bNorm)
IF 1 - distB > 0 THEN
rowW = (1 - distB) / bodySpan
ENDIF
ENDIF
ELSE
wRow = $wK[rw - startRow]
IF wRow > 0 AND sumW > 0 THEN
rowW = wRow / sumW
ENDIF
ENDIF
IF rowW > 0 THEN
vC = effVol * rowW
$vT[rw] = $vT[rw] + vC
IF isUp THEN
$vU[rw] = $vU[rw] + vC
ELSE
$vD[rw] = $vD[rw] + vC
ENDIF
$hit[rw] = $hit[rw] + 1
IF isRev THEN
$rev[rw] = $rev[rw] + 1
ENDIF
$vlt[rw] = $vlt[rw] + bRange / spanR
$dwl[rw] = $dwl[rw] + 1 / spanR
$rcy[rw] = $rcy[rw] + wRec
IF bRange > 0 THEN
compF = pStep / bRange
ELSE
compF = 0
ENDIF
$cmp[rw] = $cmp[rw] + compF / spanR
ENDIF
NEXT
ENDIF
NEXT
//------------------------------------------------------------
// central band (cumulative volume from the bottom)
//------------------------------------------------------------
maxVol = 0
totalVol = 0
FOR rw = 0 TO nRows - 1 DO
totalVol = totalVol + $vT[rw]
IF $vT[rw] > maxVol THEN
maxVol = $vT[rw]
ENDIF
NEXT
IF totalVol > 0 THEN
lowTgt = totalVol * (0.5 - bandPct * 0.5)
upTgt = totalVol * (0.5 + bandPct * 0.5)
cum = 0
bandLo = 0
bandHi = nRows - 1
upFound = 0
maxHits = 0
maxRec = 0
maxVlt = 0
maxDwl = 0
maxCmp = 0
maxRev = 0
FOR rw = 0 TO nRows - 1 DO
cum = cum + $vT[rw]
IF lowTgt >= cum THEN
bandLo = rw
ENDIF
IF upFound = 0 AND cum >= upTgt THEN
bandHi = rw
upFound = 1
ENDIF
maxHits = max(maxHits, $hit[rw])
maxRec = max(maxRec, $rcy[rw])
maxVlt = max(maxVlt, $vlt[rw])
maxDwl = max(maxDwl, $dwl[rw])
maxCmp = max(maxCmp, $cmp[rw])
maxRev = max(maxRev, $rev[rw])
NEXT
//---------------------------------------------------------
// geometry
//---------------------------------------------------------
IF lookbackBars > 360 THEN
plotLen = 360
ELSE
plotLen = lookbackBars
ENDIF
profWidth = plotLen * thick
isVert = sideChoice >= 3
histHeight = priceSpan * 0.4
IF isVert THEN
effOff = 0
ELSE
effOff = edgeOffsetBars
ENDIF
histLeft = barindex + effOff - nRows
rightEdge = barindex + effOff
leftEdge = rightEdge - floor(profWidth)
IF sideChoice = 1 THEN
baseLeft = leftEdge
baseRight = rightEdge
ELSE
baseLeft = profStartIdx
baseRight = profStartIdx + floor(profWidth)
ENDIF
//---------------------------------------------------------
// row by row drawing
//---------------------------------------------------------
FOR rw = 0 TO nRows - 1 DO
volRel = $vT[rw] / maxVol
hitRel = 0
IF maxHits > 0 THEN
hitRel = $hit[rw] / maxHits
ENDIF
IF fadeMode = 1 THEN
fadeRel = volRel
ELSIF fadeMode = 2 THEN
fadeRel = hitRel
ELSIF fadeMode = 3 THEN
fadeRel = (volRel + hitRel) * 0.5
ELSIF fadeMode = 4 THEN
fadeRel = 0
IF maxRec > 0 THEN
fadeRel = $rcy[rw] / maxRec
ENDIF
ELSIF fadeMode = 5 THEN
fadeRel = 0
IF maxVlt > 0 THEN
fadeRel = $vlt[rw] / maxVlt
ENDIF
ELSIF fadeMode = 6 THEN
fadeRel = 0
IF maxDwl > 0 THEN
fadeRel = $dwl[rw] / maxDwl
ENDIF
ELSIF fadeMode = 7 THEN
fadeRel = 0
IF maxRev > 0 THEN
fadeRel = $rev[rw] / maxRev
ENDIF
ELSIF fadeMode = 8 THEN
fadeRel = 0
IF maxCmp > 0 THEN
fadeRel = $cmp[rw] / maxCmp
ENDIF
ELSIF fadeMode = 9 THEN
fadeRel = 1 - volRel
ELSE
fadeRel = volRel
ENDIF
inBand = rw >= bandLo AND bandHi >= rw
// colour of the bullish and bearish part of the row
IF inBand THEN
uR = bandUpR
uG = bandUpG
uB = bandUpB
uA = bandUpA
dR = bandDnR
dG = bandDnG
dB = bandDnB
dA = bandDnA
ELSE
uR = bodyUpR
uG = bodyUpG
uB = bodyUpB
uA = bodyUpA
dR = bodyDnR
dG = bodyDnG
dB = bodyDnB
dA = bodyDnA
ENDIF
// gradient: from 5% opacity (metric 0) to fully opaque (metric 1)
IF useGradient THEN
uA = round(255 * (0.05 + 0.95 * fadeRel))
dA = uA
ENDIF
upFrac = $vU[rw] / maxVol
dnFrac = $vD[rw] / maxVol
IF NOT isVert THEN
upBars = upFrac * profWidth
dnBars = dnFrac * profWidth
rowLo = profLow + (rw + 0.05) * pStep
rowHi = profLow + (rw + 0.95) * pStep
IF upBars > 0 THEN
IF sideChoice = 1 THEN
bx1 = baseRight - floor(upBars)
bx2 = baseRight
ELSE
bx1 = baseLeft
bx2 = baseLeft + floor(upBars)
ENDIF
DRAWRECTANGLE(bx1, rowLo, bx2, rowHi) COLOURED(uR, uG, uB, 0) FILLCOLOR(uR, uG, uB, uA)
ENDIF
IF dnBars > 0 THEN
IF sideChoice = 1 THEN
bx1 = baseRight - floor(upBars) - floor(dnBars)
bx2 = baseRight - floor(upBars)
ELSE
bx1 = baseLeft + floor(upBars)
bx2 = baseLeft + floor(upBars) + floor(dnBars)
ENDIF
DRAWRECTANGLE(bx1, rowLo, bx2, rowHi) COLOURED(dR, dG, dB, 0) FILLCOLOR(dR, dG, dB, dA)
ENDIF
ELSE
// vertical map: one column per price row, under (Bottom) or over (Top) the price
xStart = histLeft + rw
xEnd = xStart + 1
IF sideChoice = 3 THEN
baseY = profLow - histHeight
sgY = 1
ELSE
baseY = profHigh + histHeight
sgY = -1
ENDIF
IF upFrac > 0 THEN
DRAWRECTANGLE(xStart, baseY, xEnd, baseY + sgY * upFrac * histHeight) COLOURED(uR, uG, uB, 0) FILLCOLOR(uR, uG, uB, uA)
ENDIF
IF dnFrac > 0 THEN
DRAWRECTANGLE(xStart, baseY + sgY * upFrac * histHeight, xEnd, baseY + sgY * (upFrac + dnFrac) * histHeight) COLOURED(dR, dG, dB, 0) FILLCOLOR(dR, dG, dB, dA)
ENDIF
ENDIF
NEXT
ENDIF
ENDIF
ENDIF
RETURN