







Clusters Volume Profile
Introduction
A standard volume profile answers one question: across the whole range, where did most of the volume trade? It gives you a single POC and a single value area, and if the market has spent the lookback period rotating between two or three distinct areas, that single POC often lands in the middle — in a price zone where comparatively little business was actually done.
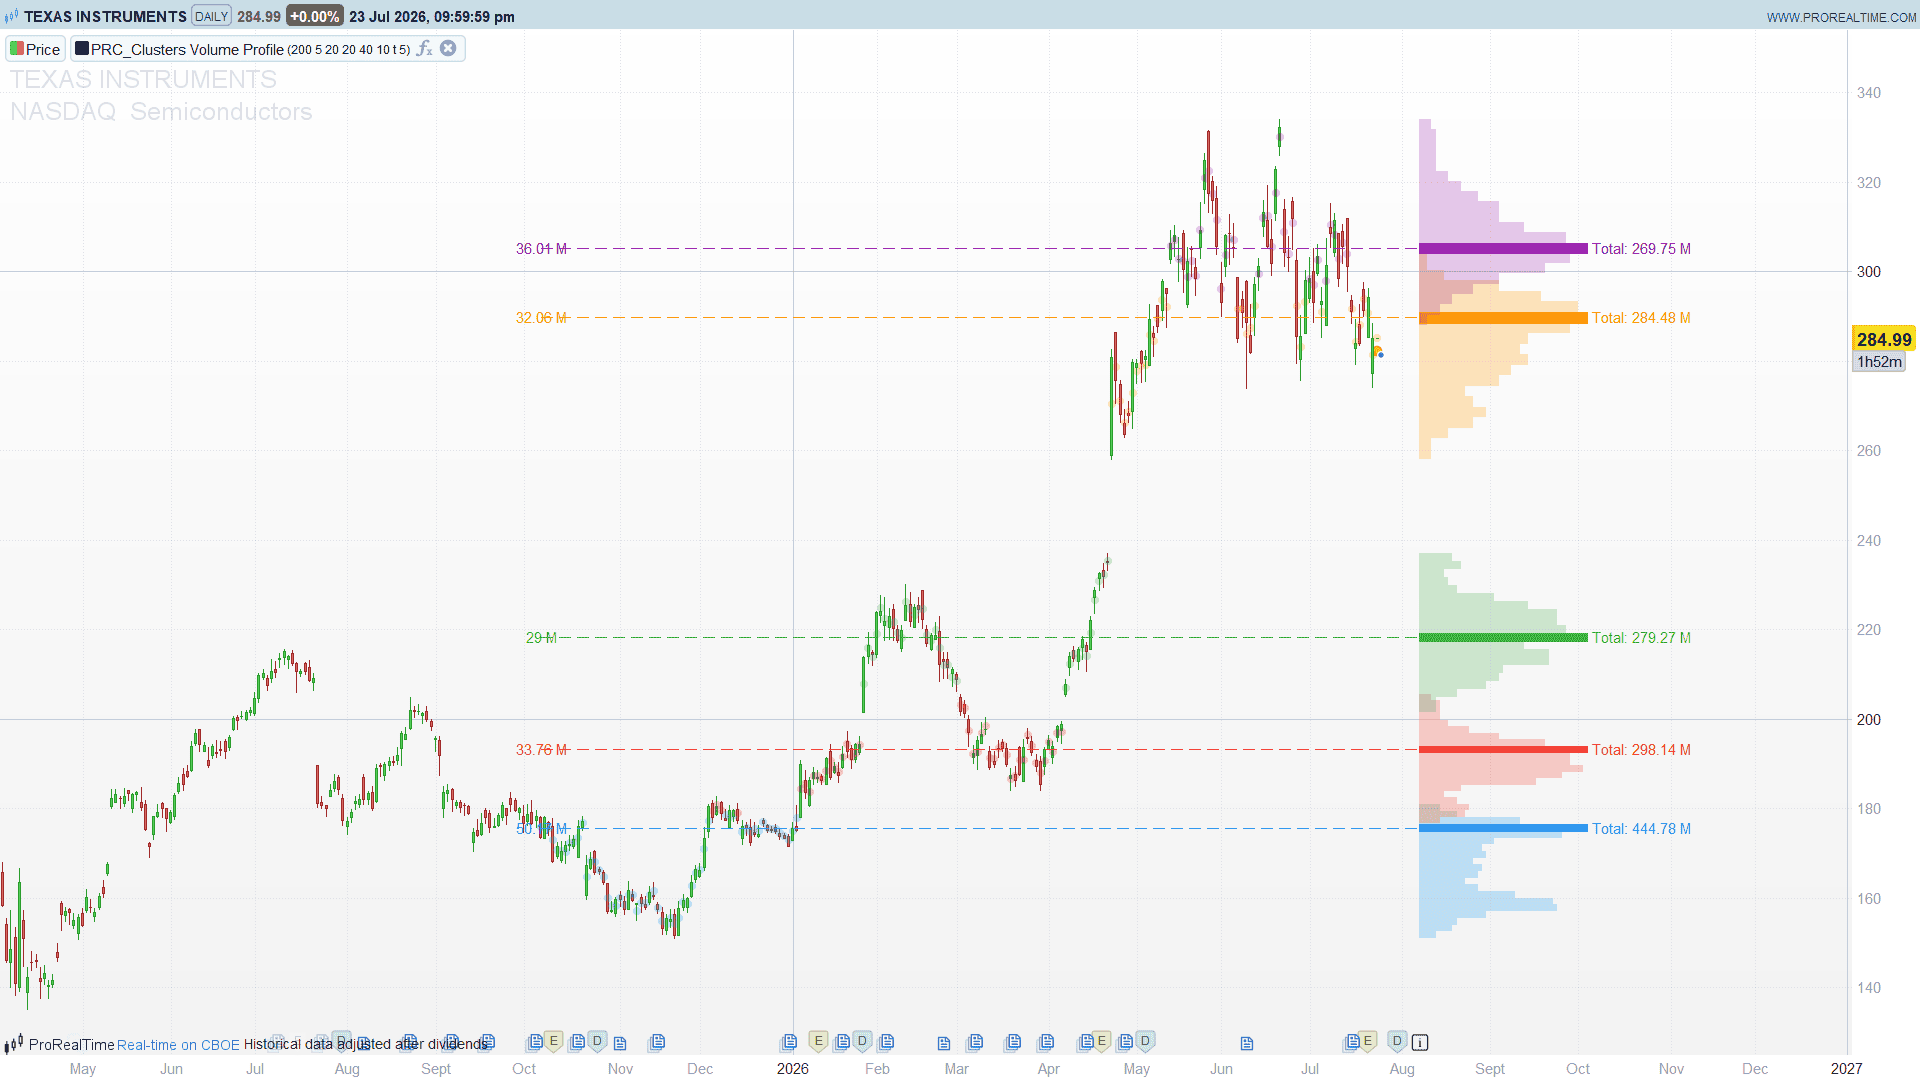
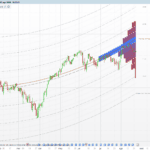
LuxAlgo’s Clusters Volume Profile takes a different route. It first segments the recent price action into K groups using volume-weighted 1-D K-means clustering, and then builds a separate volume profile for each group, each one with its own range, its own bins, its own POC and its own total volume. Instead of one profile over the whole range, you get a stack of profiles, one per pocket of activity.
Theory Behind the Indicator
1. Volume-weighted K-means in one dimension
K-means is the classic unsupervised clustering algorithm: pick K centres, assign every point to its nearest centre, move each centre to the mean of the points assigned to it, repeat. Here the “points” are the mid-prices hl2 of the last lookback bars, and the space is one-dimensional, so “nearest” is simply the smallest absolute price distance.
The one twist LuxAlgo adds is that the centroid update is weighted by volume:
centroid[j] = Σ (price[i] × volume[i]) / Σ volume[i] for all i assigned to j
This matters. An unweighted centroid drifts towards where price spent the most time; a volume-weighted centroid drifts towards where price traded the most size. A cluster containing forty quiet bars and five very heavy ones will centre on the heavy ones. The clustering is therefore already a volume-aware operation before a single profile bin has been computed.
Initialisation is deterministic — no random seeding, which ProRealTime could not reproduce anyway. The K centroids start evenly spaced inside the price range:
step = (maxPrice – minPrice) / (K + 1)
centroid[j] = minPrice + (j + 1) × step
Using K + 1 rather than K keeps the outermost centroids off the extremes of the range, which gives the boundary clusters room to breathe.
2. Cluster ranges are wick-based, not centroid-based
Once the algorithm has converged, each cluster’s drawing range is not derived from its centroid. It is the true envelope of the bars that belong to it:
clusterLow = min(low[i]) for all i assigned to the cluster
clusterHigh = max(high[i]) for all i assigned to the cluster
Because the assignment is done on hl2 but the range is taken from high/low, adjacent cluster ranges can overlap by up to the height of a candle. That is intentional and it is not a bug — each profile covers the ground its bars actually traded on.
3. Per-cluster profile with proportional volume splitting
Each cluster’s range is divided into rows bins. Every bar assigned to the cluster then distributes its volume across the bins it intersects, in proportion to how much of the bar’s range falls inside each bin:
binVolume[b] += barVolume × overlap(barRange, binRange) / barRange
This is the correct way to bin a volume profile from OHLC data: a bar that spans four bins contributes a quarter of its volume to each, not all of it to the bin containing its close. The bin with the largest accumulated volume becomes that cluster’s POC.
Each profile is then normalised to its own maximum, not to a global maximum. So the widest bar of the blue cluster and the widest bar of the red cluster are drawn at the same length even if the blue cluster carries ten times the volume. This is a deliberate design choice and it is worth understanding: the histogram shape tells you about the internal distribution of each cluster; the Total: label next to each profile is what tells you how the clusters compare to each other. Reading relative importance off the bar lengths is a misreading of the chart.
Code
//PRC_Clusters Volume Profile
//version = 0
//24.07.2026
//Traduccion de "Clusters Volume Profile [LuxAlgo]"
//Ivan Gonzalez @ www.prorealcode.com
//Sharing ProRealTime knowledge

DEFPARAM drawonlastbaronly = true

//--------------------------------------------------------------------
// Parametros
//--------------------------------------------------------------------
lookback  = 200   // barras analizadas
kClusters = 5     // numero de clusters (2..10)
maxIter   = 20    // iteraciones maximas de K-means
rowsPerVP = 20    // filas del perfil de volumen de cada cluster
vpWidth   = 40    // ancho maximo del perfil, en barras
vpOffset  = 10    // separacion entre la ultima barra y el perfil
showDots  = 1     // 1 = marcar cada barra con el color de su cluster
txoffset  = 5

IF islastbarupdate THEN

   //-----------------------------------------------------------------
   // 0. Clamps y paleta LuxAlgo (10 colores)
   //-----------------------------------------------------------------
   IF kClusters < 2 THEN
      kClusters = 2
   ENDIF
   IF kClusters > 10 THEN
      kClusters = 10
   ENDIF
   IF rowsPerVP < 2 THEN
      rowsPerVP = 2
   ENDIF

   $palR[0] = 33
   $palG[0] = 150
   $palB[0] = 243
   $palR[1] = 244
   $palG[1] = 67
   $palB[1] = 54
   $palR[2] = 76
   $palG[2] = 175
   $palB[2] = 80
   $palR[3] = 255
   $palG[3] = 152
   $palB[3] = 0
   $palR[4] = 156
   $palG[4] = 39
   $palB[4] = 176
   $palR[5] = 0
   $palG[5] = 188
   $palB[5] = 212
   $palR[6] = 255
   $palG[6] = 235
   $palB[6] = 59
   $palR[7] = 233
   $palG[7] = 30
   $palB[7] = 99
   $palR[8] = 121
   $palG[8] = 85
   $palB[8] = 72
   $palR[9] = 96
   $palG[9] = 125
   $palB[9] = 139

   //-----------------------------------------------------------------
   // 1. Cache de los datos de la ventana (una sola lectura historica)
   //-----------------------------------------------------------------
   lb = lookback
   IF lb > barindex THEN
      lb = barindex + 1
   ENDIF

   minP = 0
   maxP = 0
   totV = 0
   FOR i = 0 TO lb - 1 DO
      hh = high[i]
      ll = low[i]
      $cH[i] = hh
      $cL[i] = ll
      pm = (hh + ll) / 2
      $cP[i] = pm
      vv = volume[i]
      IF vv <> undefined THEN
         $cV[i] = vv
         totV = totV + vv
      ELSE
         $cV[i] = 0
      ENDIF
      IF i = 0 THEN
         minP = pm
         maxP = pm
      ELSE
         IF pm < minP THEN
            minP = pm
         ENDIF
         IF pm > maxP THEN
            maxP = pm
         ENDIF
      ENDIF
   NEXT

   // Instrumento sin volumen (indices, algunos CFD): se degrada a
   // perfil de PERMANENCIA (cada barra pesa 1) en vez de quedar en blanco
   noVol = 0
   IF totV <= 0 THEN
      noVol = 1
      FOR i = 0 TO lb - 1 DO
         $cV[i] = 1
      NEXT
      totV = lb
   ENDIF

   //-----------------------------------------------------------------
   // 2. K-means 1-D ponderado por volumen
   //-----------------------------------------------------------------
   IF lb >= 10 AND maxP > minP THEN

      stepC = (maxP - minP) / (kClusters + 1)
      FOR j = 0 TO kClusters - 1 DO
         $cent[j] = minP + (j + 1) * stepC
      NEXT

      tolAbs = (maxP - minP) * 0.00001
      converged = 0
      iterK = 0

      WHILE iterK < maxIter AND converged = 0 DO

         // 2a. Asignar cada barra al centroide mas cercano
         FOR i = 0 TO lb - 1 DO
            pm = $cP[i]
            bestK = 0
            bestD = abs(pm - $cent[0])
            FOR j = 1 TO kClusters - 1 DO
               dd = abs(pm - $cent[j])
               IF dd < bestD THEN
                  bestD = dd
                  bestK = j
               ENDIF
            NEXT
            $asg[i] = bestK
         NEXT

         // 2b. Acumuladores (reset-then-fill en la misma pasada: idempotente por tick)
         FOR j = 0 TO kClusters - 1 DO
            $sPV[j] = 0
            $sV[j] = 0
         NEXT
         FOR i = 0 TO lb - 1 DO
            kk = $asg[i]
            $sPV[kk] = $sPV[kk] + $cP[i] * $cV[i]
            $sV[kk] = $sV[kk] + $cV[i]
         NEXT

         // 2c. Nuevo centroide = media de precios ponderada por volumen
         maxShift = 0
         FOR j = 0 TO kClusters - 1 DO
            IF $sV[j] > 0 THEN
               nc = $sPV[j] / $sV[j]
               sh = abs(nc - $cent[j])
               IF sh > maxShift THEN
                  maxShift = sh
               ENDIF
               $cent[j] = nc
            ENDIF
         NEXT

         IF maxShift <= tolAbs THEN
            converged = 1
         ENDIF
         iterK = iterK + 1
      WEND

      //--------------------------------------------------------------
      // 3. Perfil de volumen por cluster + dibujo
      //--------------------------------------------------------------
      vpX0 = barindex + vpOffset
      calcStart = barindex - lb + 1
      totalX = vpX0 + vpWidth + 8

      FOR j = 0 TO kClusters - 1 DO

         rr = $palR[j]
         gg = $palG[j]
         bb = $palB[j]

         // 3a. Rango real del cluster (min low / max high) y volumen total
         cnt = 0
         cLo = 0
         cHi = 0
         cVol = 0
         FOR i = 0 TO lb - 1 DO
            IF $asg[i] = j THEN
               IF cnt = 0 THEN
                  cLo = $cL[i]
                  cHi = $cH[i]
               ELSE
                  IF $cL[i] < cLo THEN
                     cLo = $cL[i]
                  ENDIF
                  IF $cH[i] > cHi THEN
                     cHi = $cH[i]
                  ENDIF
               ENDIF
               cVol = cVol + $cV[i]
               cnt = cnt + 1
               IF showDots = 1 THEN
                  drawpoint(barindex - i, $cP[i],2) coloured(rr, gg, bb, 80)
               ENDIF
            ENDIF
         NEXT

         IF cnt > 0 AND cHi > cLo THEN

            binSize = (cHi - cLo) / rowsPerVP

            FOR b = 0 TO rowsPerVP - 1 DO
               $bv[b] = 0
            NEXT

            // 3b. Reparto del volumen de cada barra por solape con cada fila
            FOR i = 0 TO lb - 1 DO
               IF $asg[i] = j THEN
                  bh = $cH[i]
                  bl = $cL[i]
                  rngB = bh - bl
                  IF rngB > 0 THEN
                     // solo las filas que la vela atraviesa (learning 159)
                     xLo = round((bl - cLo) / binSize) - 1
                     xHi = round((bh - cLo) / binSize) + 1
                     IF xLo < 0 THEN
                        xLo = 0
                     ENDIF
                     IF xHi > rowsPerVP - 1 THEN
                        xHi = rowsPerVP - 1
                     ENDIF
                     IF xLo <= xHi THEN
                        FOR b = xLo TO xHi DO
                           binB = cLo + b * binSize
                           binT = binB + binSize
                           iL = max(bl, binB)
                           iH = min(bh, binT)
                           IF iH > iL THEN
                              $bv[b] = $bv[b] + $cV[i] * (iH - iL) / rngB
                           ENDIF
                        NEXT
                     ENDIF
                  ELSE
                     // doji exacto: el volumen entero cae en su fila
                     bIdx = floor((bl - cLo) / binSize)
                     IF bIdx < 0 THEN
                        bIdx = 0
                     ENDIF
                     IF bIdx > rowsPerVP - 1 THEN
                        bIdx = rowsPerVP - 1
                     ENDIF
                     $bv[bIdx] = $bv[bIdx] + $cV[i]
                  ENDIF
               ENDIF
            NEXT

            // 3c. POC del cluster
            maxBV = 0
            pocIdx = 0
            FOR b = 0 TO rowsPerVP - 1 DO
               IF $bv[b] > maxBV THEN
                  maxBV = $bv[b]
                  pocIdx = b
               ENDIF
            NEXT

            // 3d. Histograma
            IF maxBV > 0 THEN
               FOR b = 0 TO rowsPerVP - 1 DO
                  vb = $bv[b]
                  IF vb > 0 THEN
                     bBot = cLo + b * binSize
                     bTop = bBot + binSize
                     wdt = round((vb / maxBV) * vpWidth)
                     IF wdt < 1 THEN
                        wdt = 1
                     ENDIF
                     xEnd = vpX0 + wdt
                     IF b = pocIdx THEN
                        drawrectangle(vpX0, bBot, xEnd, bTop) coloured(rr, gg, bb, 255) fillcolor(rr, gg, bb, 255)
                     ELSE
                        drawrectangle(vpX0, bBot, xEnd, bTop) coloured(rr, gg, bb, 0) fillcolor(rr, gg, bb, 64)
                     ENDIF
                  ENDIF
               NEXT

               // 3e. Linea del POC hacia el pasado + etiquetas
               pocY = cLo + (pocIdx + 0.5) * binSize
               pocV = $bv[pocIdx]
               drawsegment(calcStart, pocY, vpX0, pocY) coloured(rr, gg, bb, 255) style(dottedline2, 1)

               IF pocV >= 1000000 THEN
                  pv = round(pocV / 10000) / 100
                  drawtext("#pv#M", calcStart, pocY) coloured(rr, gg, bb, 255)
               ELSIF pocV >= 1000 THEN
                  pv = round(pocV / 10) / 100
                  drawtext("#pv#K", calcStart, pocY) coloured(rr, gg, bb, 255)
               ELSE
                  pv = round(pocV * 100) / 100
                  drawtext("#pv#", calcStart, pocY) coloured(rr, gg, bb, 255)
               ENDIF

               IF cVol >= 1000000 THEN
                  tv = round(cVol / 10000) / 100
                  drawtext("Total: #tv#M", totalX+txoffset, pocY) coloured(rr, gg, bb, 255)
               ELSIF cVol >= 1000 THEN
                  tv = round(cVol / 10) / 100
                  drawtext("Total: #tv#K", totalX+txoffset, pocY) coloured(rr, gg, bb, 255)
               ELSE
                  tv = round(cVol * 100) / 100
                  drawtext("Total: #tv#", totalX+txoffset, pocY) coloured(rr, gg, bb, 255)
               ENDIF
            ENDIF
         ENDIF
      NEXT

      IF noVol = 1 THEN
         drawtext("Sin volumen: perfil de permanencia", vpX0 + 20, maxP) coloured(150, 150, 150, 255)
      ENDIF

   ENDIF
ENDIF

RETURN
like this. Gonna have a look more in deep. Tks!