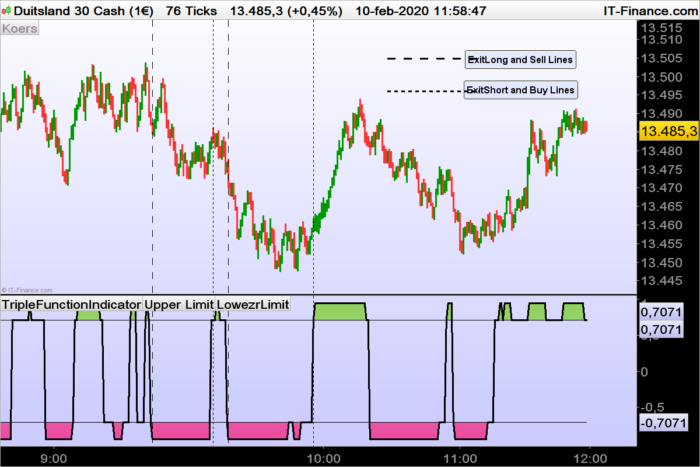
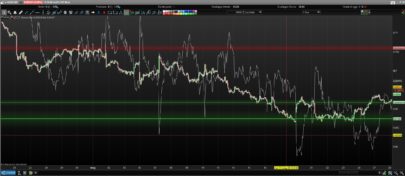
TripleFunctionIndicator (TFI) is meant to be a daytrading system that give good results on a 10 minutes graphic. Especially its a combination of three 3 Indicators namely the SMI The CCI and the RSI indicator. As you can see on the graphic,, even on an overbought situation, given by DemarkIndicator it do work. The classic limits for each indicator are repected.
For SMI +40 and -40
For CCI +100 and -100
For RSI 70 and 30.
Finally each Indicator give 3 results if there is a condition fullfilled or not and none of the two.
The total result is calculated and as only 3 possibilities namely +3 ;+1 ; -1 and -3.
|
1 2 3 4 5 6 7 8 9 10 11 12 13 14 15 16 17 18 19 20 21 22 23 24 25 26 27 28 29 30 31 32 33 34 35 36 37 38 39 40 41 |
// Parameters for the StochasticMomentumIndicator n=17 m=5 c1=SMI[14,3,5](close)>40 c11=SMI[14,3,5](close)>-40 // Parameters for the CommodityChannelIndex c2= CCI[n](typicalPrice)>100 c21=CCI[n](typicalPrice)<-100 //Parameters for the Relative StrenghtIndex c3=RSI[m](close)>70 c31=RSI[m](close)<30 //Test for each Indicator if c1 then ZLS1= 1 elsif c11 then ZLS1=-1 endif if c2 then ZLS2=1 elsif c21 then ZLS2=-1 endif If c3 then ZLS3=1 elsif c31 then ZLS3=-1 endif //Summary of the results TFI = sin(atan(ZLS1+ZLS2+ZLS3)) return TFI as"TripleFunctionIndicator", sin(atan(1)) as"Upper Limit", sin(atan(-1)) as"LowezrLimit" |
Share this
No information on this site is investment advice or a solicitation to buy or sell any financial instrument. Past performance is not indicative of future results. Trading may expose you to risk of loss greater than your deposits and is only suitable for experienced investors who have sufficient financial means to bear such risk.
ProRealTime ITF files and other attachments :PRC is also on YouTube, subscribe to our channel for exclusive content and tutorials

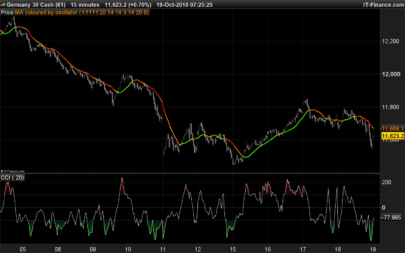
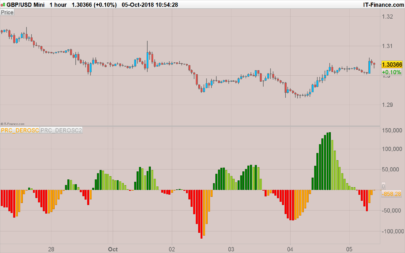
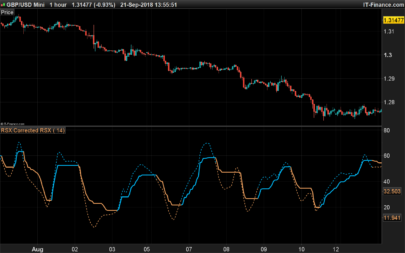
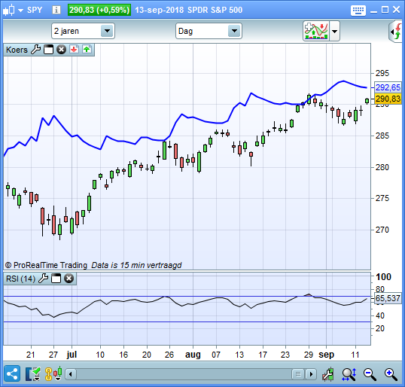
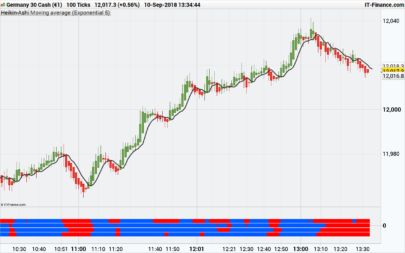
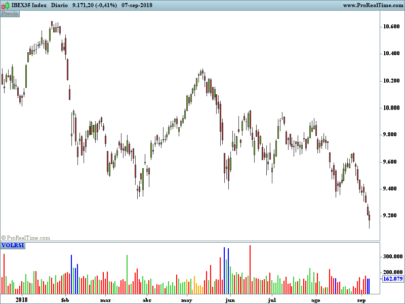


I need help to understand this.
When to buy ? When to sell ?
How this indicator must look like ?
Once I make your code with the indicators i only have lines that i can’t understand.
Thank you for Sharing and for help
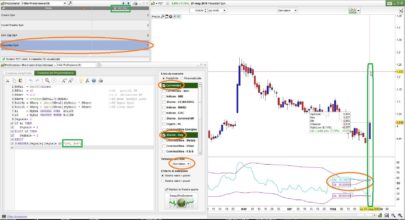
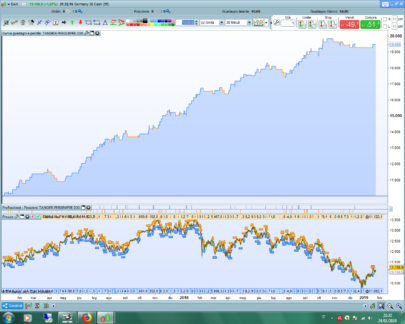
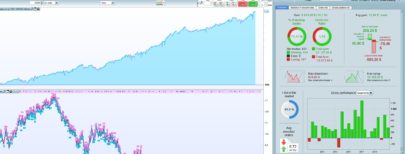
I can understand that it is a little bit confused. Therefore some more explanation: The Indicator is correct (for values 17 for n and 5 for m ) but I have posted the backtest results instead of the indicator vieuw.(sorry)
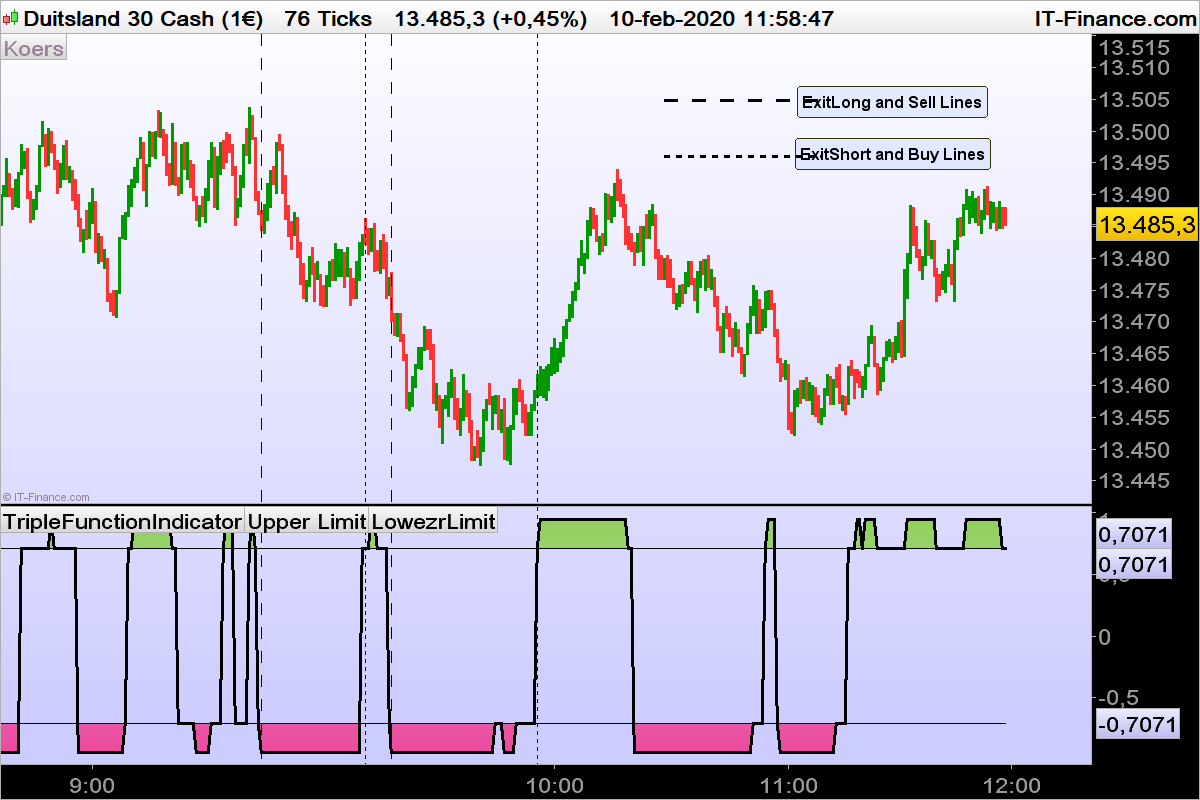
I shall try to post a graphic, that will explaine a lot.
In fact TFI is an indicator concist of tree classical indicators, who are testest all three. The result is “Yes” or “No” “Yes” equals (+1 ) No” equals (-1) If all three the indicators are “Yes” , we are in a bull fase and contrairely 3 times “No” is a bearish result.
If you take the sine of the arctangent of the result, then the results are:
Yes,Yes,Yes (+3)
Yes, No Yes (+1) also :(No, Yes, Yes (+1) and Yes, Yes, No(+1) )
No,No,No (-3)
Yes,No,No (-1) and so on
For the sin(atan( Value) there are only for results:
1) Strong Trend +3 (0.94868)
2)Strong Trend -3 (-0.94868)
3) Minor trend +1 and -1 (0.70711 and -0.70711 resp.)
Thats it. For the rest is watch and see.
thanks very interesting 🙂
Compilation by sinusoid concept is very interesting. Thanks
Hi Zigo can you make backtest from this indicator
Good evening I would like to understand why it doesn’t work for me.
Rosary
Hello,
I would like to comment that observing the logic of the variables of the three indicators, it is likely that in line 5 the result of the SMI variable should be <-40
Perhaps it would also be logical to give a value "0" to ZLS1, ZLS2, ZLS3, when the value of the three indicators is not in the margins defined for +1 or -1
Good morning,
there is no mistake about the shorts
c11=SMI[14,3,5](close)>-40
has to be c11=SMI[14,3,5] < -40
(indeed)
Thank you 😉 Zigo