1. Introduction
The Trend Speed Analyzer is a technical indicator designed by Zeiierman to provide a visual and quantitative reading of the speed at which a trend is moving, as well as abrupt changes in price direction. Unlike conventional indicators that only show trend direction, this indicator adds an extra layer of analysis through the use of a dynamic moving average and an accelerated price movement calculation.
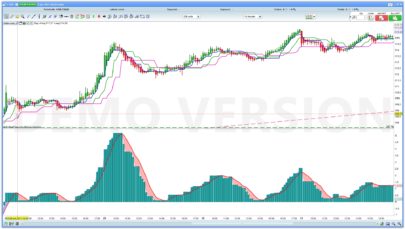
It is presented in two distinct parts:
- A visualization integrated directly into the price chart, where candlesticks change color based on the strength and direction of the trend.
- A lower panel that displays a histogram of trend speed, making it easier to interpret market movements.
This dual representation makes the Trend Speed Analyzer a very useful tool for both visual analysis and the development of strategies based on market momentum.
2. Concept of the Trend Speed Analyzer
The Trend Speed Analyzer is based on two fundamental pillars: dynamic trend detection and the measurement of its evolution speed.
Dynamic Moving Average
At the core of the indicator is a dynamic exponential moving average. Unlike a conventional fixed-length moving average, this one adjusts automatically based on volatility and recent price behavior. It uses a variable length (dynLength) that is recalculated with each candle based on the normalization of price changes.
This approach allows the average to react more quickly during high market activity phases and to smooth out during consolidation periods, providing a more accurate and adaptive trend reading.
Acceleration Factor
In addition to dynamic length, the indicator incorporates an acceleration factor. This is calculated by comparing the current price variation with past variations, amplifying the moving average’s response to abrupt changes and enhancing the indicator’s sensitivity to trend beginnings or endings.
Speed Calculation
Once the trend is established through the dynamic average, the trend speed is calculated by the difference between a smoothed average of closing prices (WilderAverage) and the corresponding opening. This accumulated value becomes a quantitative measure of momentum, which is then smoothed using a Hull average for a clearer reading.
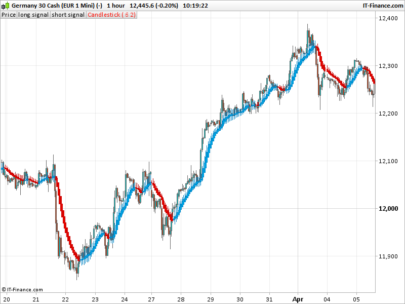
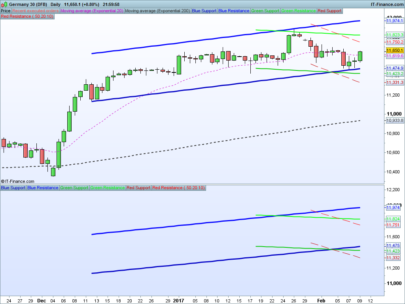
3. Visualization on the Price Chart
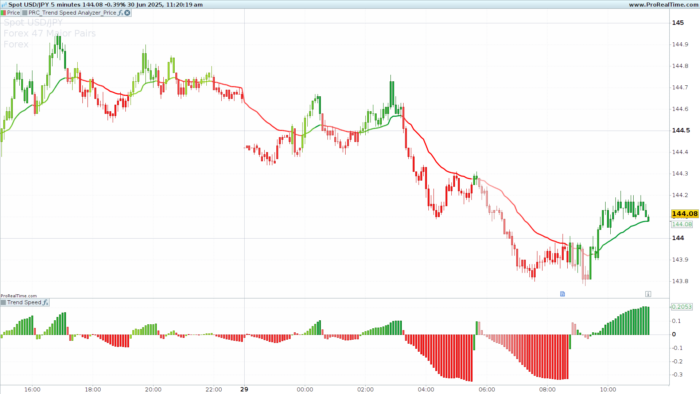
The first part of the Trend Speed Analyzer is represented directly on the price chart via a dynamic moving average and candlestick coloring based on trend strength.
Dynamic Moving Average
A continuous line is drawn over the price representing the calculated dynamic average. This line constantly adapts to price behavior and acts as a visual reference to identify the market’s directional bias.
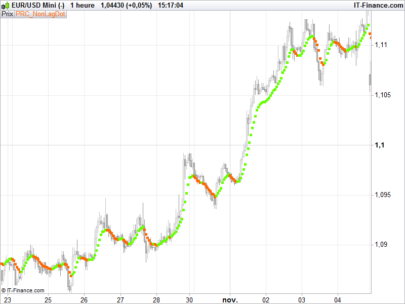
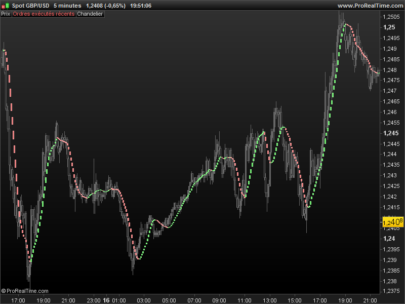
Candle Coloring
Chart candlesticks are progressively colored according to the intensity of price movement. Color gradients indicate whether momentum is bullish or bearish and how strong it is:
- Bullish trends: candles range from light yellow to deep green, indicating stronger bullish force as they approach green.
- Bearish trends: colors range from deep red to light pink, reflecting a bearish slowdown or transition.
This visual approach allows for quick detection of turning points or moments when the trend gains or loses strength, which is especially useful for traders seeking to confirm breakouts or avoid false signals.
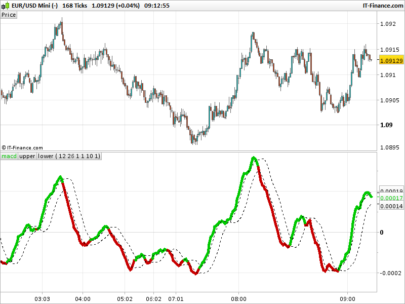
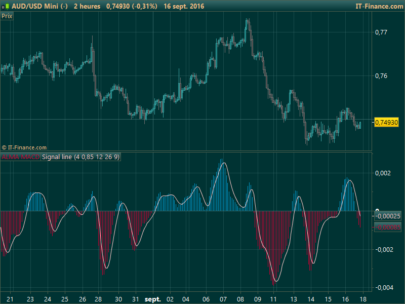
4. Visualization in the Lower Panel
The second part of the Trend Speed Analyzer is presented in a panel located just below the price chart. This is where the trend speed histogram is displayed, a visual tool for quickly assessing market momentum intensity and direction.
Speed Histogram
The histogram reflects the evolution of the speed variable, smoothed using a Hull average to produce a cleaner and easier-to-interpret curve. This value indicates whether trend momentum is increasing, decreasing, or reversing.
- Bars above zero indicate bullish momentum.
- Bars below zero indicate bearish momentum.
- The further from the zero line, the stronger the movement.
Progressive Coloring
Each histogram bar is colored based on the relative strength of the momentum, using a progressive gradient:
- Bullish impulses: range from yellow to green.
- Bearish impulses: range from deep red to light pink.
This visual treatment facilitates the detection of divergences, accelerations, and decelerations in price dynamics, providing a clear reference to anticipate possible trend changes.
5. Indicator Settings
The Trend Speed Analyzer includes three main parameters that allow customization based on trading style or the asset being analyzed. Adjusting these parameters enables the user to adapt the indicator’s sensitivity to different market conditions.
MaxPeriod
- Description: Defines the maximum period the dynamic moving average can reach.
- Default value: 50
- Use: A higher value makes the average smoother and slower to react, while lower values make it more reactive and price-sensitive.
AccelMultiplier
- Description: Multiplier that amplifies the effect of the acceleration factor on the moving average.
- Default value: 5.0
- Use: Increasing it boosts the indicator’s sensitivity to rapid price changes. Decreasing it makes the average respond more moderately.
CollectionPeriod
- Description: Number of candles used to calculate speed normalization, which is used to generate progressive colors.
- Default value: 100
- Use: A higher value smooths color changes and makes the indicator respond to longer trends. A lower value emphasizes recent movements more.
These three parameters work together to adjust the indicator’s responsiveness, fluidity, and visualization to market behavior. Their correct combination can make the difference between a clear signal and an ambiguous reading.
6. Practical Applications
The Trend Speed Analyzer is a versatile tool that can be used both independently and in combination with other indicators to improve decision-making. Its main uses in technical analysis include:
Breakout Confirmation
When the price crosses a key support or resistance zone, an acceleration in candle color or a spike in the histogram can confirm that the movement is strong and not a false breakout.
Trend Change Identification
Color transitions in candlesticks or a histogram crossing the zero line can anticipate changes in market direction, providing early reversal signals.
Signal Filtering
The indicator can be used as a filter for other systems. For example, entries against the dominant trend identified by the dynamic average or its associated speed can be avoided.
Divergence Detection
Comparing price action with histogram behavior can reveal divergences that warn of possible exhaustion or imminent reversals.
Quick Visual Analysis
Thanks to the progressive coloring in both the price chart and the lower panel, it’s possible to get an immediate reading of market strength and direction without additional calculations.
7. Code
|
1 2 3 4 5 6 7 8 9 10 11 12 13 14 15 16 17 18 19 20 21 22 23 24 25 26 27 28 29 30 31 32 33 34 35 36 37 38 39 40 41 42 43 44 45 46 47 48 49 50 51 52 53 54 55 56 57 58 59 60 61 62 63 64 65 66 67 68 69 70 71 72 73 74 75 76 77 78 79 80 81 82 83 84 85 86 87 88 89 90 91 92 93 94 95 96 97 98 99 100 101 102 103 104 105 106 107 108 109 110 111 112 113 114 115 116 117 118 119 120 |
//--------------------------------------------// // PRC_Trend Speed Analyzer_Price // Version = 0 // 18.06.2025 // Translated by Iván González @ www.prorealcode.com // Sharing ProRealTime knowledge //--------------------------------------------// // --- Inputs --- //--------------------------------------------// MaxPeriod = 50 AccelMultiplier = 5.0 CollectionPeriod = 100 // Histogram colours UpHistColR = 255 // R UpHistColG = 255 // G UpHistColB = 50 // B UpHistCol2R = 0 // R UpHistCol2G = 153 // G UpHistCol2B = 50// B DnHistColR = 255 // R DnHistColG = 0 // G DnHistColB = 0 // B DnHistCol2R = 247 // R DnHistCol2G = 225 // G DnHistCol2B = 225 // B //--------------------------------------------// // --- Calculations --- //--------------------------------------------// ONCE lastTrendDirection = 0 ONCE lastTrendSpeed = 0 // Dynamic Average calculation IF BarIndex <= 200 THEN dynEma = close speed = 0 ELSE // Dynamic Average calculation countsDiff = close maxAbsCountsDiff = HIGHEST[200](ABS(countsDiff)) IF maxAbsCountsDiff = 0 THEN maxAbsCountsDiff = 1 ENDIF countsDiffNorm = (countsDiff + maxAbsCountsDiff) / (2 * maxAbsCountsDiff) dynLength = 5 + countsDiffNorm * (MaxPeriod - 5) // Accelerator factor calculation deltaCountsDiff = ABS(countsDiff - countsDiff[1]) maxDeltaCountsDiff = HIGHEST[200](deltaCountsDiff) IF maxDeltaCountsDiff = 0 THEN maxDeltaCountsDiff = 1 ENDIF accelFactor = deltaCountsDiff / maxDeltaCountsDiff // Alpha Calculation alphaBase = 2 / (dynLength + 1) alpha = alphaBase * (1 + accelFactor * AccelMultiplier) alpha = min(1,alpha) // Dynamic EMA calculation dynEma = alpha * close + (1 - alpha) * dynEma[1] // Trend Speed Calculation c = WilderAverage[10](close) o = WilderAverage[10](open) trend = dynEma IF close > trend AND close[1] <= trend THEN speed = c - o lastTrendDirection = 1 ELSIF close < trend AND close[1] >= trend THEN speed = c - o lastTrendDirection = -1 ELSE speed = speed[1] + (c - o) ENDIF // Trend Speed (Histogram) trendspeed = HullAverage[5](speed) // Speed Gradient (colours) minSpeed = LOWEST[CollectionPeriod](speed) maxSpeed = HIGHEST[CollectionPeriod](speed) IF maxSpeed - minSpeed = 0 THEN normalizedSpeed = 0 ELSE normalizedSpeed = (speed - minSpeed) / (maxSpeed - minSpeed) ENDIF IF dynema>average[2,2](close) THEN // Bearish trend r = ROUND(DnHistColR + (DnHistCol2R - DnHistColR) * normalizedSpeed) g = ROUND(DnHistColG + (DnHistCol2G - DnHistColG) * normalizedSpeed) b = ROUND(DnHistColB + (DnHistCol2B - DnHistColB) * normalizedSpeed) ELSE // Bullish trend r = ROUND(UpHistColR + (UpHistCol2R - UpHistColR) * normalizedSpeed) g = ROUND(UpHistColG + (UpHistCol2G - UpHistColG) * normalizedSpeed) b = ROUND(UpHistColB + (UpHistCol2B - UpHistColB) * normalizedSpeed) ENDIF IF speed < 0 THEN // Bearish trend CurrentR = ROUND(DnHistColR + (DnHistCol2R - DnHistColR) * normalizedSpeed) CurrentG = ROUND(DnHistColG + (DnHistCol2G - DnHistColG) * normalizedSpeed) CurrentB = ROUND(DnHistColB + (DnHistCol2B - DnHistColB) * normalizedSpeed) ELSE // Bullish trend CurrentR = ROUND(UpHistColR + (UpHistCol2R - UpHistColR) * normalizedSpeed) CurrentG = ROUND(UpHistColG + (UpHistCol2G - UpHistColG) * normalizedSpeed) CurrentB = ROUND(UpHistColB + (UpHistCol2B - UpHistColB) * normalizedSpeed) ENDIF drawcandle(open,high,low,close)coloured(CurrentR,CurrentG,CurrentB) ENDIF RETURN dynEma AS "Dynamic EMA" STYLE(line,3) COLOURED(r, g, b) |
|
1 2 3 4 5 6 7 8 9 10 11 12 13 14 15 16 17 18 19 20 21 22 23 24 25 26 27 28 29 30 31 32 33 34 35 36 37 38 39 40 41 42 43 44 45 46 47 48 49 50 51 52 53 54 55 56 57 58 59 60 61 62 63 64 65 66 67 68 69 70 71 72 73 74 75 76 77 78 79 80 81 82 83 84 85 86 87 88 89 90 91 92 93 94 95 96 97 98 99 100 101 102 103 104 105 106 107 108 109 110 |
//--------------------------------------------// // PRC_Trend Speed Analyzer_Histogram // Version = 0 // 18.06.2025 // Translated by Iván González @ www.prorealcode.com // Sharing ProRealTime knowledge //--------------------------------------------// // --- Inputs --- //--------------------------------------------// MaxPeriod = 50 AccelMultiplier = 5.0 CollectionPeriod = 100 // Histogram colours UpHistColR = 255 // R UpHistColG = 255 // G UpHistColB = 50 // B UpHistCol2R = 0 // R UpHistCol2G = 153 // G UpHistCol2B = 50// B DnHistColR = 255 // R DnHistColG = 0 // G DnHistColB = 0 // B DnHistCol2R = 247 // R DnHistCol2G = 225 // G DnHistCol2B = 225 // B //--------------------------------------------// // --- Calculations --- //--------------------------------------------// ONCE lastTrendDirection = 0 ONCE lastTrendSpeed = 0 // Dynamic Average calculation IF BarIndex <= 200 THEN dynEma = close speed = 0 ELSE // Dynamic Average calculation countsDiff = close maxAbsCountsDiff = HIGHEST[200](ABS(countsDiff)) IF maxAbsCountsDiff = 0 THEN maxAbsCountsDiff = 1 ENDIF countsDiffNorm = (countsDiff + maxAbsCountsDiff) / (2 * maxAbsCountsDiff) dynLength = 5 + countsDiffNorm * (MaxPeriod - 5) // Accelerator factor calculation deltaCountsDiff = ABS(countsDiff - countsDiff[1]) maxDeltaCountsDiff = HIGHEST[200](deltaCountsDiff) IF maxDeltaCountsDiff = 0 THEN maxDeltaCountsDiff = 1 ENDIF accelFactor = deltaCountsDiff / maxDeltaCountsDiff // Alpha Calculation alphaBase = 2 / (dynLength + 1) alpha = alphaBase * (1 + accelFactor * AccelMultiplier) alpha = min(1,alpha) // Dynamic EMA calculation dynEma = alpha * close + (1 - alpha) * dynEma[1] // Trend Speed Calculation c = WilderAverage[10](close) o = WilderAverage[10](open) trend = dynEma IF close > trend AND close[1] <= trend THEN speed = c - o lastTrendDirection = 1 ELSIF close < trend AND close[1] >= trend THEN speed = c - o lastTrendDirection = -1 ELSE speed = speed[1] + (c - o) ENDIF // Trend Speed (Histogram) trendspeed = HullAverage[5](speed) // Speed Gradient (colours) minSpeed = LOWEST[CollectionPeriod](speed) maxSpeed = HIGHEST[CollectionPeriod](speed) IF maxSpeed - minSpeed = 0 THEN normalizedSpeed = 0 ELSE normalizedSpeed = (speed - minSpeed) / (maxSpeed - minSpeed) ENDIF IF speed < 0 THEN // Bearish trend CurrentR = ROUND(DnHistColR + (DnHistCol2R - DnHistColR) * normalizedSpeed) CurrentG = ROUND(DnHistColG + (DnHistCol2G - DnHistColG) * normalizedSpeed) CurrentB = ROUND(DnHistColB + (DnHistCol2B - DnHistColB) * normalizedSpeed) ELSE // Bullish trend CurrentR = ROUND(UpHistColR + (UpHistCol2R - UpHistColR) * normalizedSpeed) CurrentG = ROUND(UpHistColG + (UpHistCol2G - UpHistColG) * normalizedSpeed) CurrentB = ROUND(UpHistColB + (UpHistCol2B - UpHistColB) * normalizedSpeed) ENDIF ENDIF RETURN trendspeed AS "Trend Speed" STYLE(HISTOGRAM) COLOURED(CurrentR, CurrentG, CurrentB) |
Share this
No information on this site is investment advice or a solicitation to buy or sell any financial instrument. Past performance is not indicative of future results. Trading may expose you to risk of loss greater than your deposits and is only suitable for experienced investors who have sufficient financial means to bear such risk.
ProRealTime ITF files and other attachments :
Find other exclusive trading pro-tools on ![]()
PRC is also on YouTube, subscribe to our channel for exclusive content and tutorials