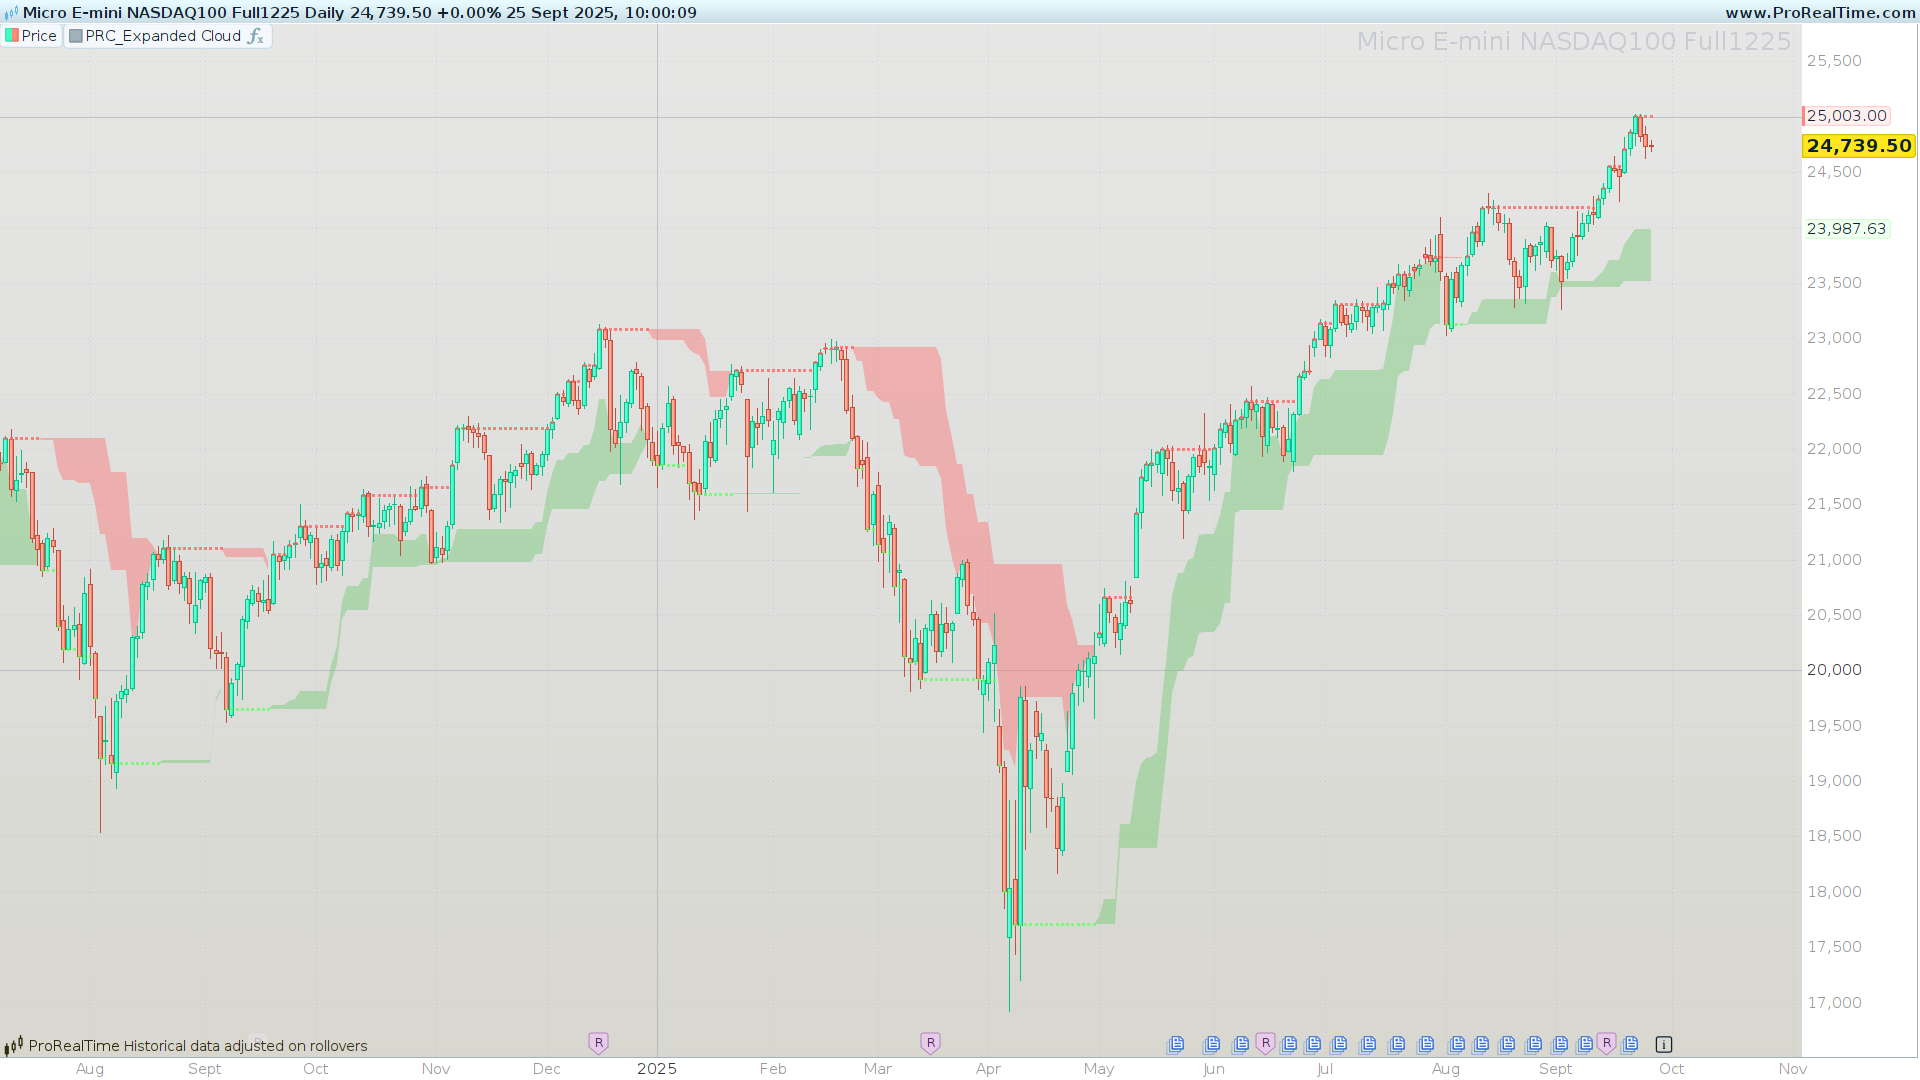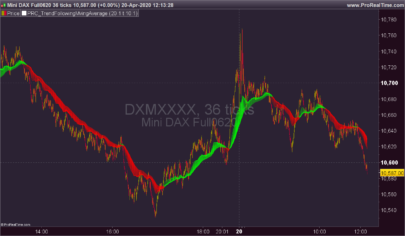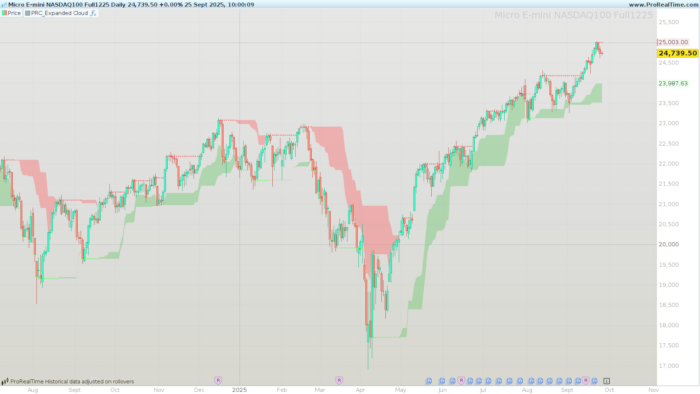
Expanded Cloud (by LuxAlgo) wraps a classic Highest/Lowest channel with two “adaptive” bounds that expand/contract based on recent range dynamics. It highlights the active trend regime (bullish/bearish), paints a context cloud, and plots the relevant expanded boundary so you can filter trades, trail stops, and time continuations or regime flips with less noise.
What is the Expanded Cloud?
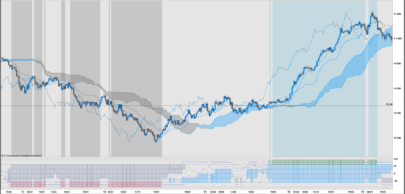
The Expanded Cloud is a dynamic envelope built on top of a rolling Highest/Lowest channel. Two internally computed lines — Expanded Upper (maxExp) and Expanded Lower (minExp) — react to changes in the channel with a configurable reactivity. The indicator shades the relevant side of price according to trend regime:
- Uptrend: the lower cloud (between
minExpandlower) is filled. - Downtrend: the upper cloud (between
upperandmaxExp) is filled.
This structure provides at-a-glance regime identification, adaptive support/resistance, and practical anchor levels for risk management.
How it works
- Rolling Channel
The base channel is computed overlengthInputperiods on a chosensource:upper = HIGHEST[length](source)lower = LOWEST[length](source)
- Expanded Bounds (adaptive lines)
Two stateful series evolve with the channel:maxExpreacts to rises inupperand is dampened by falls inlowerscaled byreactivity.minExpreacts to falls inlowerand is dampened by rises inupperscaled byreactivity.
Intuition: as the channel stretches in one direction, the corresponding expanded bound follows, while opposing moves are partially absorbed according to reactivity (0–100%).
- Trend Detection (regime flips)
- Flip to bullish (
trend = 1) whenminExpdetaches fromlowerafter having been aligned with it. - Flip to bearish (
trend = -1) whenmaxExpdetaches fromupperafter previous alignment. - Otherwise, the last regime persists.
- Flip to bullish (
- Visual Logic (cloud + lines)
- In uptrends: the lower cloud is shaded; the Expanded Upper line is emphasized.
- In downtrends: the upper cloud is shaded; the Expanded Lower line is emphasized.
Inputs & configuration
lengthInput(default: 20)
Lookback for the Highest/Lowest channel.- Shorter ⇒ more responsive channel, tighter clouds, more flips.
- Longer ⇒ smoother channel, wider clouds, fewer flips.
reactivityInput(default: 50, range 0–100)
Converts toreactivity = reactivityInput / 100. Controls how strongly the expanded bounds respond to opposing channel moves.- Higher ⇒ more sensitive/elastic expanded lines, closer to price.
- Lower ⇒ steadier/forgiving expanded lines, better for trends with noise.
source(default:close)
Reference price for the channel. Alternatives likemedianpriceortypicalpricecan smooth the channel if desired.alpha(default: 100, range 0–255)
Cloud transparency control.- Governs the fill opacity of the active cloud (0 transparent → 100 fully opaque within the indicator’s scale).
- The plotted expanded line uses a scaled opacity
min(255, alpha*2)to keep it readable against the cloud.
Tip: Start with
length = 20,reactivity = 40–60,alpha = 60–100. Increasereactivityif you want earlier cues; decrease it if you want sturdier levels.
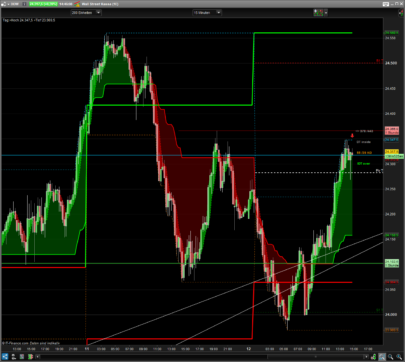
How to read the cloud
- Bullish regime (
trend = 1)
Price typically respects the lower cloud as dynamic support. Continuations often occur on rebounds within or above this zone. A decisive break below the lower cloud warns of weakening momentum or a potential regime change. - Bearish regime (
trend = -1)
Price often respects the upper cloud as dynamic resistance. Continuations often occur on pullbacks into/under this zone. A strong break above the upper cloud warns of bearish fatigue or a possible flip. - Transitions (flips)
The flip condition is designed to confirm that the expanded bound has stopped hugging the channel boundary and started to “lead” in the opposite direction — a robust signal that regime may have changed.
Trading playbook (practical use-cases)
The following are usage ideas, not trade advice. Always validate on your markets/timeframes.
- Trend Filter (directional bias)
- Take longs only when the regime is bullish and price is above or rebounding from the lower cloud.
- Take shorts only when the regime is bearish and price is below or rejecting the upper cloud.
- Continuation Entries (buy dips / sell rallies)
- Bullish: look for pullbacks that hold within or just above the lower cloud, then re-acceleration.
- Bearish: look for rallies that stall within or just below the upper cloud, then roll over.
- Breakout/Invalidation Logic
- Bullish: an impulsive close below the lower cloud = momentum deterioration; consider trims or protective actions.
- Bearish: an impulsive close above the upper cloud = bearish invalidation risk.
- Stops & Trailing
- In bullish regimes, a practical trailing stop can be set a few ticks below
minExp. - In bearish regimes, trail a few ticks above
maxExp. - Tighten/loosen distance by instrument volatility.
- In bullish regimes, a practical trailing stop can be set a few ticks below
Tips, limitations & good practices
- Sideways markets: Clouds may alternate frequently. Use a secondary filter (e.g., higher-timeframe regime agreement or a simple range filter) to avoid overtrading.
- Parameter sensitivity:
reactivityInputchanges character materially. Forward-test multiple presets; don’t assume one-size-fits-all. - Context over signals: Treat flips as context first, signals second. Add your entry trigger of choice (momentum kick, pattern break, etc.).
- Display hygiene: The indicator already uses fill + line emphasis. Keep overlapping tools minimal to maintain readability.
- Performance: Lightweight; scales well even on lower timeframes.
ProBuilder Code
|
1 2 3 4 5 6 7 8 9 10 11 12 13 14 15 16 17 18 19 20 21 22 23 24 25 26 27 28 29 30 31 32 33 34 35 36 37 38 39 40 41 42 43 44 45 46 47 48 49 50 51 52 53 54 55 56 57 58 59 60 61 62 63 64 65 66 |
//---------------------------------------------------// //PRC_Expanded Cloud by LuxAlgo //version = 0 //24.09.2025 //Iván González @ www.prorealcode.com //Sharing ProRealTime knowledge //---------------------------------------------------// // ----------- Parámetros configurables -------------// //---------------------------------------------------// lengthInput = 20 // Periodo de cálculo (Highest/Lowest) reactivityInput = 50 // Porcentaje de expansión (0-100) alpha = 100 // Transparencia de la nube source = customclose // Precio de referencia // Convertir reactividad a factor reactivity = reactivityInput / 100 //---------------------------------------------------// // ---------- Cálculo de máximos y mínimos ----------// //---------------------------------------------------// upper = HIGHEST[lengthInput](source) lower = LOWEST[lengthInput](source) //---------------------------------------------------// // ---------------- Cálculo de la nube --------------// //---------------------------------------------------// // ----- Inicialización de variables dinámicas ONCE maxExp = source ONCE minExp = source ONCE trend = 0 if barindex>lengthInput then // ----- Actualización de expansión maxExp = MAX(source, maxExp[1] + (upper - upper[1]) - (MAX(lower[1] - lower, 0) * reactivity)) minExp = MIN(source, minExp[1] + (lower - lower[1]) + (MAX(upper - upper[1], 0) * reactivity)) // ----- Detección de tendencia IF minExp <> lower AND minExp[1] = lower[1] THEN trend = 1 // alcista ELSIF maxExp <> upper AND maxExp[1] = upper[1] THEN trend = -1 // bajista ELSE trend = trend[1] ENDIF endif //---------------------------------------------------// // ------------------ Pintar nube -------------------// //---------------------------------------------------// IF trend = 1 THEN rup=100 gup=255 bup=100 rlw=100 glw=200 blw=100 alphaup=alpha alphalw=0 ELSIF trend = -1 THEN rup=255 gup=100 bup=100 rlw=200 glw=100 blw=100 alphaup=0 alphalw=alpha ENDIF COLORBETWEEN(upper, maxExp, rup,gup,bup,alphalw) COLORBETWEEN(minExp, lower, rlw,glw,blw,alphaup) //---------------------------------------------------// RETURN maxExp COLOURED(255,100,100,min(255,alphaup*2)) AS "Expanded Upper" style(point), minExp COLOURED(100,255,100,min(255,alphalw*2)) AS "Expanded Lower" style(point) |
Share this
No information on this site is investment advice or a solicitation to buy or sell any financial instrument. Past performance is not indicative of future results. Trading may expose you to risk of loss greater than your deposits and is only suitable for experienced investors who have sufficient financial means to bear such risk.
ProRealTime ITF files and other attachments :
Find other exclusive trading pro-tools on ![]()
PRC is also on YouTube, subscribe to our channel for exclusive content and tutorials