1. Introduction
The Three Step Future-Trend combines volume analysis, price action, and forward-looking visualization to anticipate potential market movements. By focusing on delta volume —the difference between volume in bullish and bearish candles— the indicator groups this information into sequential blocks, offering insight into the evolution of buying or selling pressure over time.
It is especially useful for traders seeking visual tools to assess market trends from a forward-thinking perspective. Whether for intraday trading or higher timeframe analysis, this indicator provides clear signals of trend continuity or potential reversals.
2. Indicator Logic
At its core, the Three Step Future-Trend relies on delta volume analysis, which distinguishes whether a candle’s volume is bullish or bearish. If a bar closes above its open, its volume is considered positive; otherwise, it is treated as negative. This simple logic helps evaluate whether volume is aligned with the market direction.
The indicator groups delta volume into three sequential blocks of equal size (default: 25 bars per block):
- Block 1 (most recent): Analyzes delta volume over the last 25 bars.
- Block 2 (previous): Covers the 25 bars prior to Block 1.
- Block 3 (oldest): Looks at the 25 bars preceding Block 2.
Each block also includes the total volume, allowing traders to compare buying/selling pressure across time. This layered analysis reveals momentum changes and the strength behind trends.
3. Visual Representation
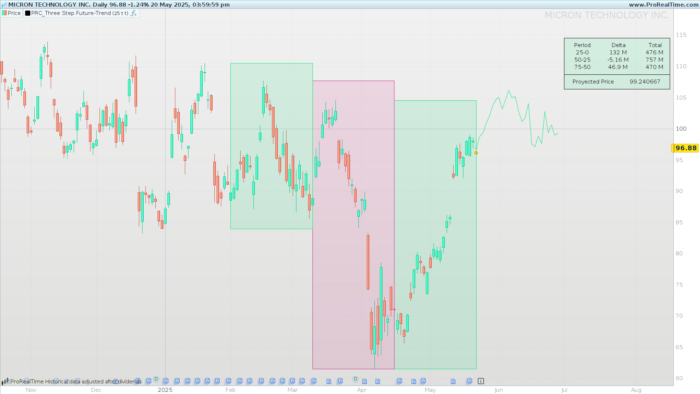
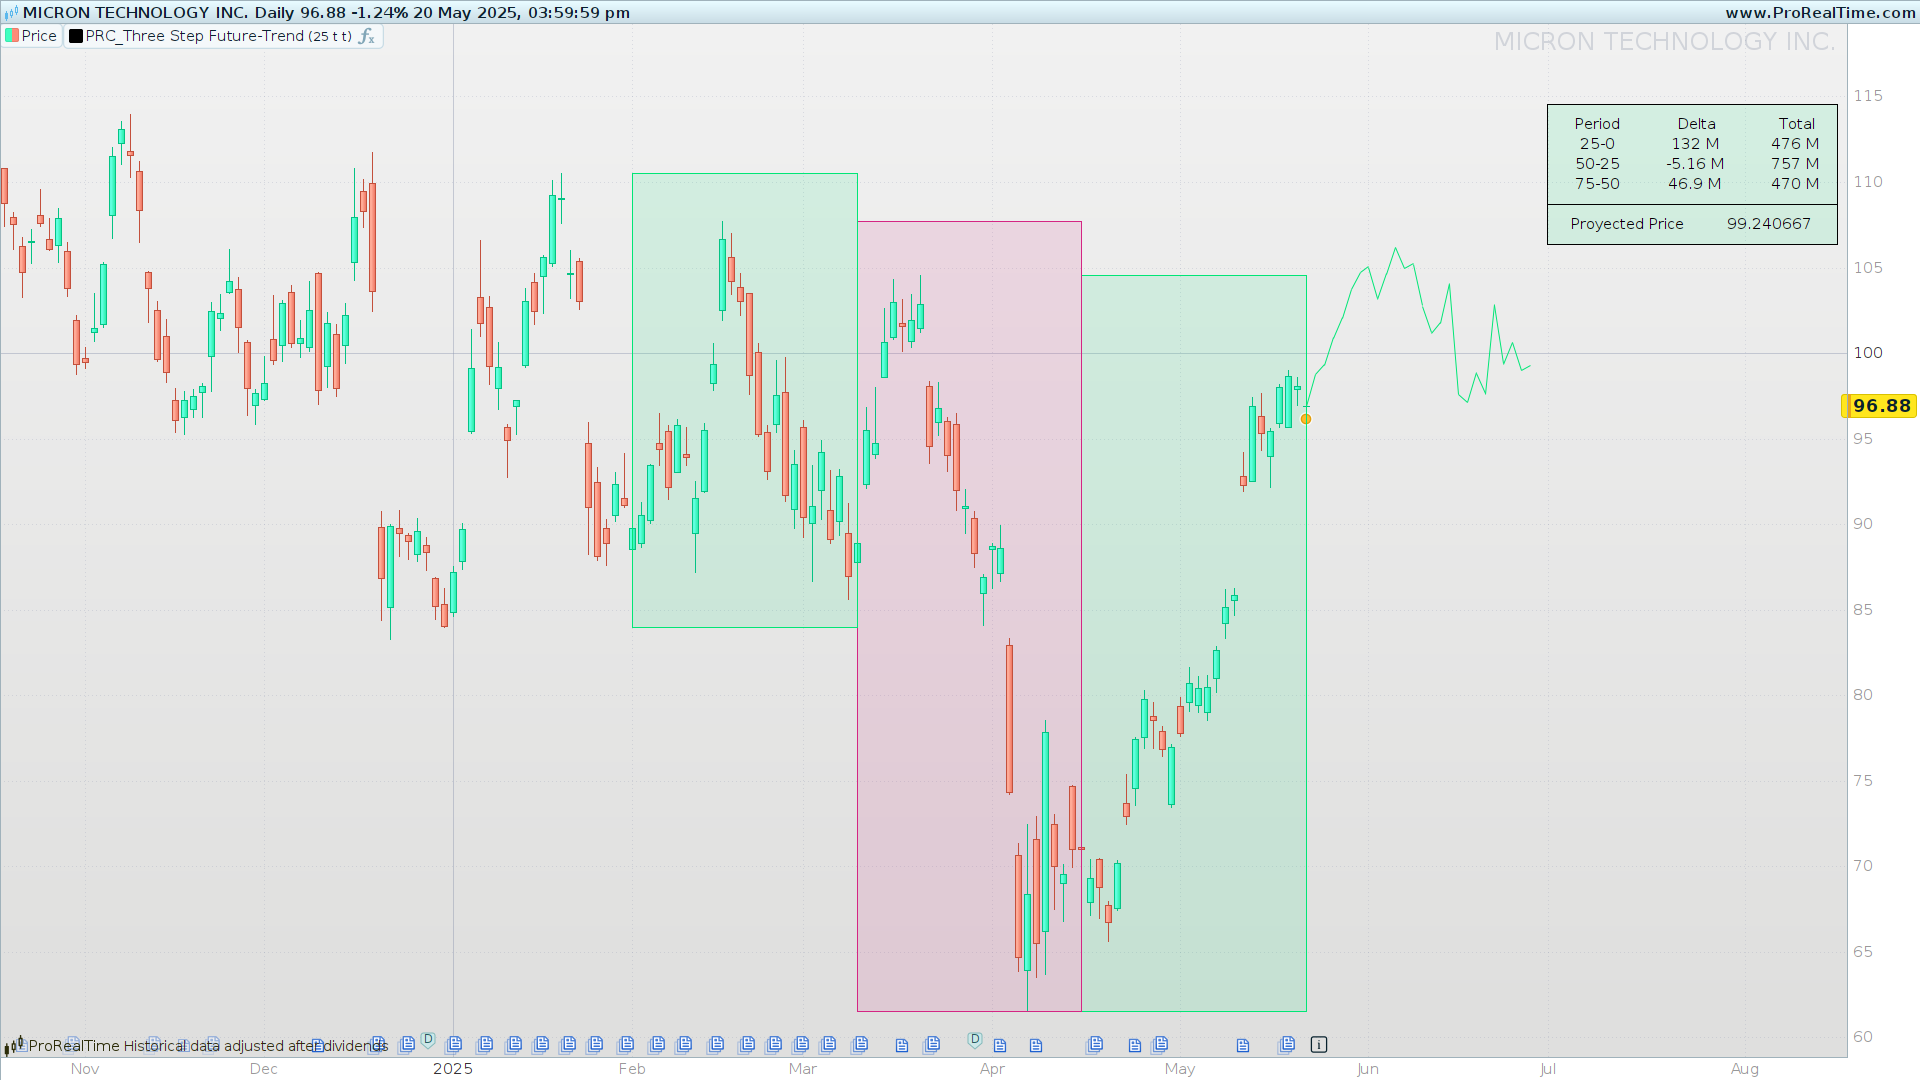
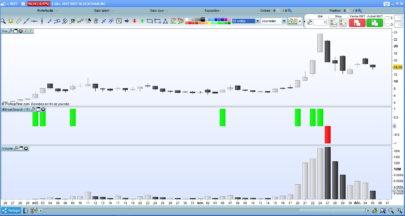
A key feature of the Three Step Future-Trend is its strong visual presentation. Each of the three volume blocks is drawn as a colored rectangle directly over the price chart, giving the user an immediate visual impression of the recent volume trend.
Each rectangle spans the high-low range of the last 50 bars within the corresponding period block, providing price context for the volume data.
Color coding enhances interpretation:
- Green (RGB: 0, 230, 118): Indicates positive delta volume (buying pressure).
- Pink (RGB: 212, 37, 131): Indicates negative delta volume (selling pressure).
This visual approach enables quick pattern recognition and identification of consistent or shifting market behavior.
4. Future Trend Projection
The most innovative element of the Three Step Future-Trend is its ability to project future price movement based solely on the closing behavior of candles within past blocks.
The indicator calculates average closing values over three 25-bar blocks and compares them to the current close. It then estimates a difference between the current price and the average, applying that offset forward using the same block logic to create a projected price curve.
This projection is drawn with line segments extending into the future, visually outlining a possible price path based on historical structure. While delta volume does not influence the price projection itself, it determines the color of the projection:
- Green (bullish) if recent delta volume is positive.
- Pink (bearish) if it is negative.
This overlay offers a forecast-like view of price structure while incorporating recent volume sentiment as visual context.
5. Informative Panel
The Three Step Future-Trend includes an informative data panel that offers a compact summary of the volume blocks and, optionally, the projected price.
Displayed directly on the chart, the panel includes:
- Delta volume and total volume for each block:
- 25–0: Latest block (most recent 25 bars)
- 50–25: Intermediate block
- 75–50: Oldest block
This information helps detect shifts in buying/selling dynamics over time.
- Projected price:
- Shows the value at the end of the projected curve.
- Useful for comparing against current market price to assess potential price zones.
Both elements are optional and can be enabled or hidden via the indicator settings.
6. Customizable Settings
The Three Step Future-Trend offers several configurable options to adapt it to various trading styles and timeframes:
- Period (
period):
Defines the size of each block in number of bars. Default is 25, resulting in three 25-bar blocks. This can be adjusted for shorter or longer-term analysis. - Show delta data (
showDelta):
Displays the data panel with delta and total volume for each block. Helps with volume-based analysis. - Show projected price (
showPrice):
Enables the display of the projected price at the end of the curve. Adds a reference value to the panel.
These settings allow the indicator to serve both visual traders and those who prefer a more analytical approach.
|
1 2 3 4 5 6 7 8 9 10 11 12 13 14 15 16 17 18 19 20 21 22 23 24 25 26 27 28 29 30 31 32 33 34 35 36 37 38 39 40 41 42 43 44 45 46 47 48 49 50 51 52 53 54 55 56 57 58 59 60 61 62 63 64 65 66 67 68 69 70 71 72 73 74 75 76 77 78 79 80 81 82 83 84 85 86 87 88 89 90 91 92 93 94 95 96 97 98 99 100 101 102 103 104 105 106 107 108 109 110 111 112 113 114 115 116 117 118 119 120 121 122 123 124 125 126 127 128 129 130 131 132 133 134 135 136 137 138 139 140 141 |
//---------------------------------------------------// //PRC_Three Step Future-Trend //version = 0 //20.05.2025 //Iván González @ www.prorealcode.com //Sharing ProRealTime knowledge //---------------------------------------------------// // INPUTS //---------------------------------------------------// defparam drawonlastbaronly = true period = 25 showDelta = 1 showPrice = 1 //---------------------------------------------------// //---------------------------------------------------// // === DELTA VOLUME CALCULATION === IF close > open THEN deltaVolume = volume ELSE deltaVolume = -volume ENDIF // === DELTA PER BLOCK === delta1 = summation[period](deltaVolume) delta2 = summation[period * 2](deltaVolume) - delta1 delta3 = summation[period * 3](deltaVolume) - delta1 - delta2 // === TOTAL VOLUME PER BLOCK === total1 = summation[period](volume) total2 = summation[period * 2](volume) - total1 total3 = summation[period * 3](volume) - total1 - total2 // === COLORS BASED ON TREND === IF delta1 > 0 THEN red1 = 0 green1 = 230 blue1 = 118 ELSE red1 = 212 green1 = 37 blue1 = 131 ENDIF IF delta2 > 0 THEN red2 = 0 green2 = 230 blue2 = 118 ELSE red2 = 212 green2 = 37 blue2 = 131 ENDIF IF delta3 > 0 THEN red3 = 0 green3 = 230 blue3 = 118 ELSE red3 = 212 green3 = 37 blue3 = 131 ENDIF // === VOLUME BLOCK VISUALIZATION === // Box 1 (most recent) left1 = barindex - period right1 = barindex top1 = highest[50](high) bot1 = lowest[50](low) drawrectangle(left1, top1, right1, bot1) coloured(red1, green1, blue1) fillcolor(red1, green1, blue1, 30) // Box 2 (previous) left2 = barindex - period * 2 right2 = barindex - period top2 = highest[50](high)[period] bot2 = lowest[50](low)[period] drawrectangle(left2, top2, right2, bot2) coloured(red2, green2, blue2) fillcolor(red2, green2, blue2, 30) // Box 3 (oldest) left3 = barindex - period * 3 right3 = barindex - period * 2 top3 = highest[50](high)[period * 2] bot3 = lowest[50](low)[period * 2] drawrectangle(left3, top3, right3, bot3) coloured(red3, green3, blue3) fillcolor(red3, green3, blue3, 30) // === FUTURE TREND PROJECTION === refValue = (close[0] + close[period] + close[period * 2]) / 3 IF islastbarupdate THEN cumDelta = 0 FOR i = 0 TO period DO $Value[i] = (close[i] + close[i + period] + close[i + period * 2]) / 3 $delta[i] = (deltaVolume[i] + deltaVolume[i + period] + deltaVolume[i + period * 2]) / 3 cumDelta = cumDelta + $delta[i] NEXT FOR j = 0 TO period DO $ValueRev[j] = $Value[period - j] NEXT diff = close - $ValueRev[0] voldelta = cumDelta / period IF voldelta > 0 THEN r = 0 g = 230 b = 118 ELSE r = 212 g = 37 b = 131 ENDIF FOR k = 0 TO period DO $futureIdx[k] = barindex + k $futurePrice[k] = diff + $ValueRev[k] drawsegment($futureIdx[k + 1], $futurePrice[k + 1], $futureIdx[k], $futurePrice[k]) coloured(r, g, b) NEXT // === DATA TABLE === // Delta Volume if showDelta then drawrectangle(-300, -80, -10, -180) anchor(topright, xshift, yshift)fillcolor(r,g,b,30) drawtext("Period", -250, -100) anchor(topright, xshift, yshift) drawtext("Delta", -150, -100) anchor(topright, xshift, yshift) drawtext("Total", -50, -100) anchor(topright, xshift, yshift) drawtext("25-0", -250, -120) anchor(topright, xshift, yshift) drawtext("#delta1#", -150, -120) anchor(topright, xshift, yshift) drawtext("#total1#", -50, -120) anchor(topright, xshift, yshift) drawtext("50-25", -250, -140) anchor(topright, xshift, yshift) drawtext("#delta2#", -150, -140) anchor(topright, xshift, yshift) drawtext("#total2#", -50, -140) anchor(topright, xshift, yshift) drawtext("75-50", -250, -160) anchor(topright, xshift, yshift) drawtext("#delta3#", -150, -160) anchor(topright, xshift, yshift) drawtext("#total3#", -50, -160) anchor(topright, xshift, yshift) endif // Proyected Price If showPrice then FuturePrice=$futurePrice[period] drawtext("Proyected Price",-220,-200)anchor(topright,xshift,yshift) drawtext("#FuturePrice#",-75,-200)anchor(topright,xshift,yshift) drawrectangle(-300,-220,-10,-180)anchor(topright,xshift,yshift)fillcolor(r,g,b,30) endif ENDIF //---------------------------------------------------// return |
Share this
No information on this site is investment advice or a solicitation to buy or sell any financial instrument. Past performance is not indicative of future results. Trading may expose you to risk of loss greater than your deposits and is only suitable for experienced investors who have sufficient financial means to bear such risk.
ProRealTime ITF files and other attachments :
Find other exclusive trading pro-tools on ![]()
PRC is also on YouTube, subscribe to our channel for exclusive content and tutorials


Another really interesting indicator. It works very well on periods below 25. Just a few cosmetic changes to make.
hello, it seems to be very good, but I’m doing intraday and I’m getting very different forecasted price if I change the time frame. Which is/are the best time frame to use it for intraday? or it’s well working or daily basis? thanks for yor reply !!
Hi! I use this indicator in daily basis. In intraday timeframes, volume changes a lot depending of time. Also you could find differences because of the open daily gap.