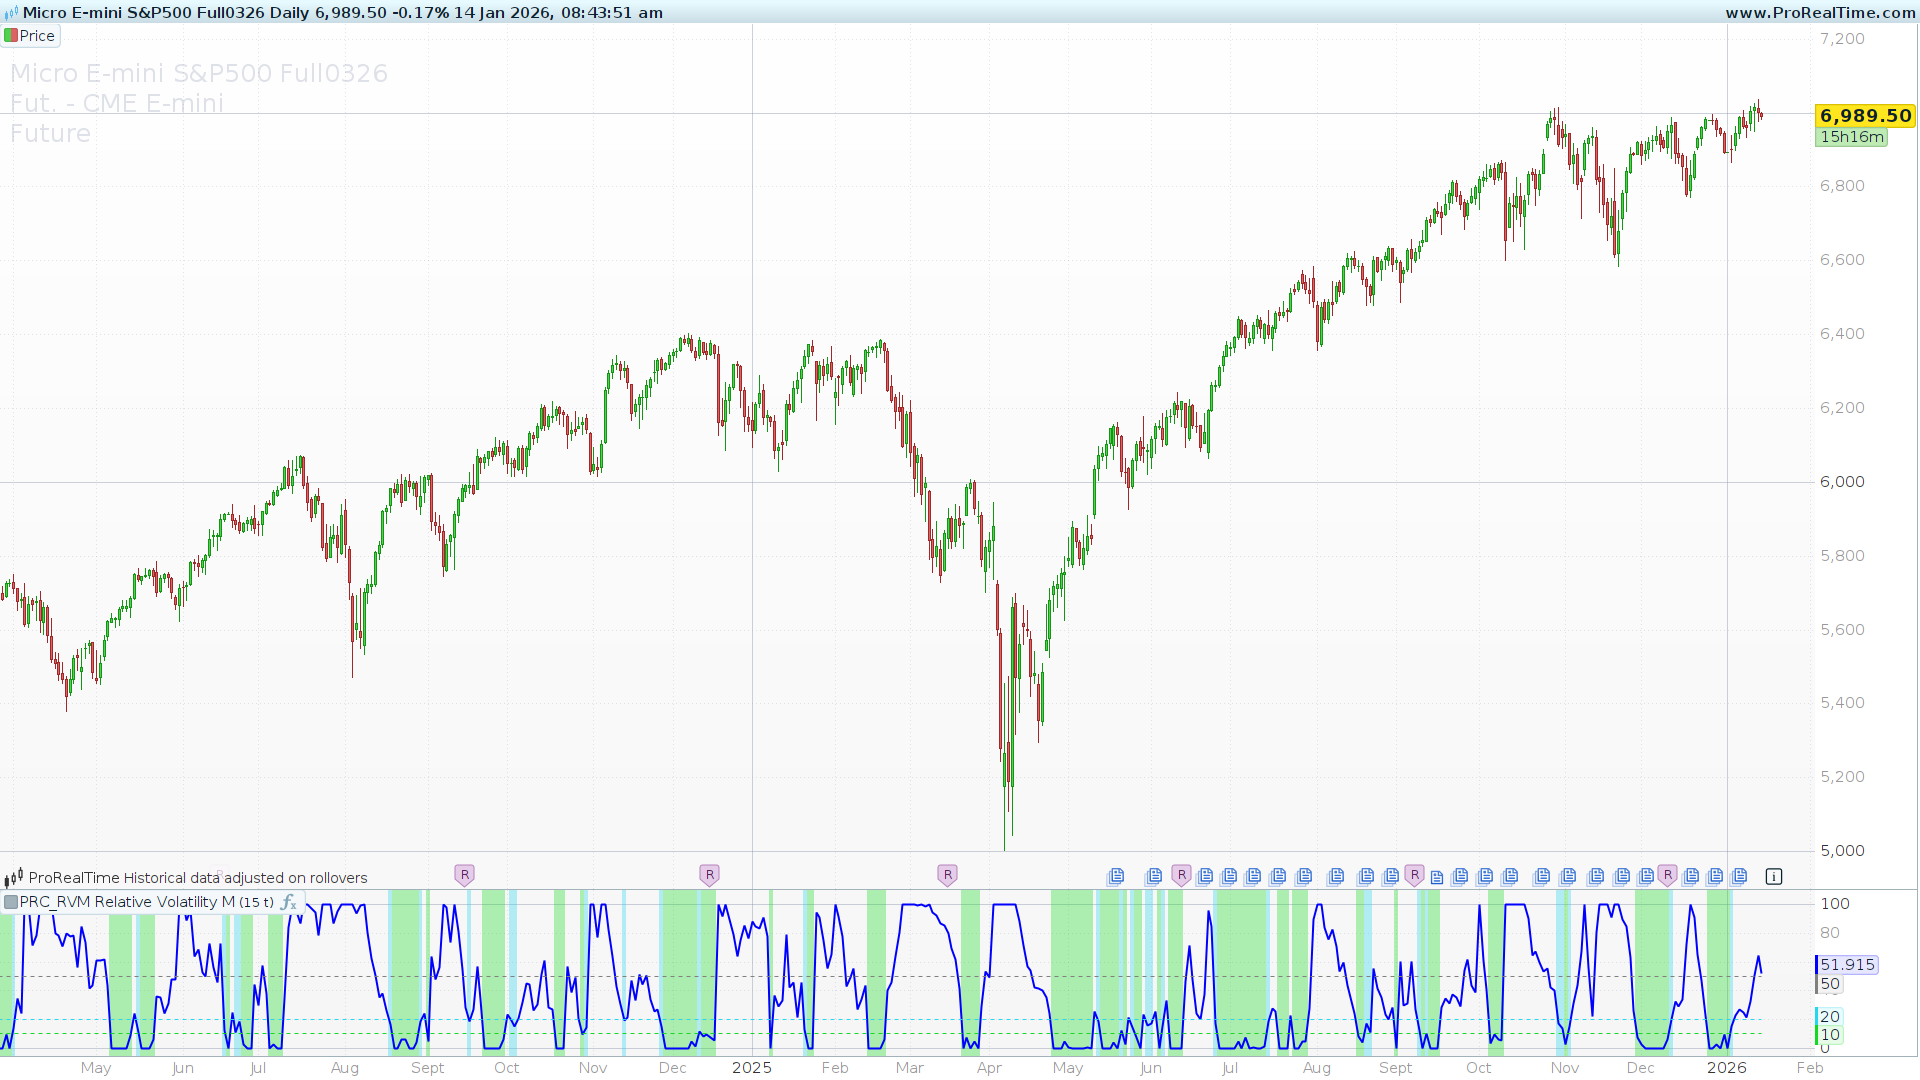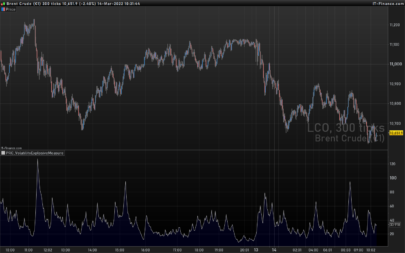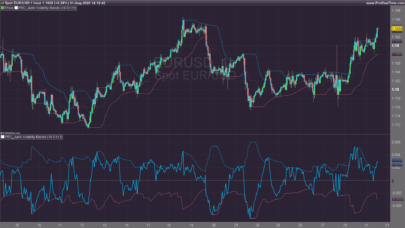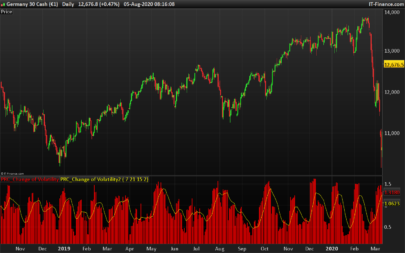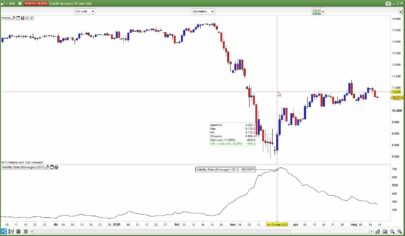
Volatility is the lifeblood of trading, yet its absolute value can often be misleading. A 50-point move on a stock might be extreme volatility one month and completely normal the next. To solve this, AlfinPlot has developed the RVM (Relative Volatility Measure), a specialized indicator for ProRealTime designed to normalize volatility into a clear, readable scale of 0 to 100.
By blending multiple time horizons and scaling the results, the RVM helps traders identify “volatility squeezes”—those quiet moments that often precede explosive market moves.
The Philosophy Behind RVM
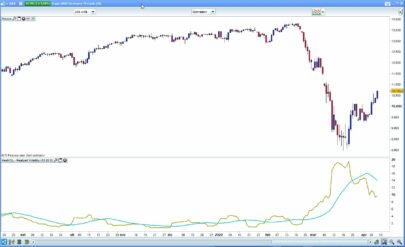
Most traders use the Average True Range (ATR) to measure volatility. However, the RVM takes this a step further by using a dual-layered approach:
-
Short-Term Velocity: It averages three fast ATR periods (3, 5, and 8) to capture immediate price action.
-
Long-Term Context: It averages three slow ATR periods (55, 89, and 144), based on the Fibonacci sequence, to establish the historical “noise” level.
By combining these two averages, the indicator provides a “Combined ATR” that reflects volatility across the entire spectrum of the market’s memory.
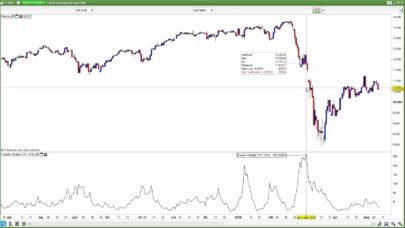
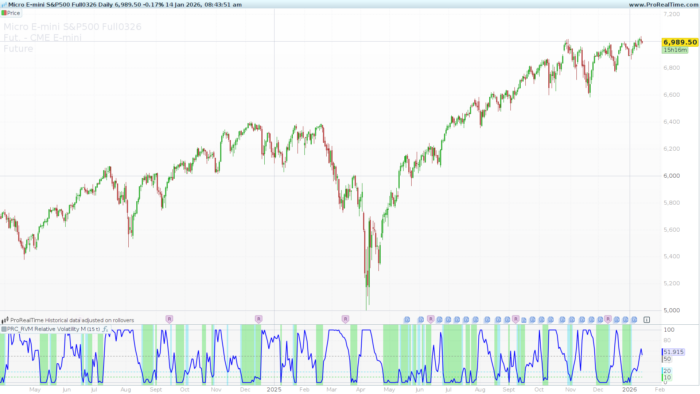
How to Interpret the RVM
The RVM uses an oscillator format (0-100) that makes identification of market regimes instantaneous:
-
The Launchpad (0 – 10): Highlighted in Green, this represents extreme consolidation. In this zone, volatility is at its lowest relative to the recent past. Markets rarely stay here for long; this is often where the most powerful trends begin.
-
The Preparation Zone (10 – 20): Highlighted in Cyan, this suggests the market is beginning to wake up from a squeeze or is entering a period of healthy, low-volatility trending.
-
The Midpoint (50): This serves as the equilibrium line. Values above 50 indicate that current volatility is higher than the average of the lookback period.
-
Volatility Peaks (80 – 100): When the RVM reaches these levels, volatility is “overbought.” While this doesn’t necessarily mean a price reversal, it often signals that the current move is reaching a climax and may soon transition into a range or a pullback.
Settings & Customization
The RVM is highly flexible and can be adapted to any timeframe, from scalping to long-term investing:
-
lookbackPeriod (Default: 25): This defines the window of time used to calculate the relative “Highs” and “Lows” of volatility. Increasing this value will make the indicator less sensitive, while decreasing it will make it more reactive to sudden spikes.
-
showBgColor (Binary 0 or 1): This setting toggles the background coloring for the “Launchpad” and “Preparation” zones, allowing for a cleaner chart if desired.
Tip: You should add
lookbackPeriodandshowBgColoras variables in the “Variable Definition” menu to modify them without touching the code.
ProBuilder Code
|
1 2 3 4 5 6 7 8 9 10 11 12 13 14 15 16 17 18 19 20 21 22 23 24 25 26 27 28 29 30 31 32 33 34 35 36 37 38 39 40 41 |
//------------------------------------------------------------// //PRC_RVM Relative Volatility Measure //version = 0 //12.04.24 //Iván González @ www.prorealcode.com //Sharing ProRealTime knowledge //------------------------------------------------------------// //-----Inputs--------------------------------------------------// lookbackPeriod=25//Lookback Period showBgColor = 1//Show Background Color //------------------------------------------------------------// //-----Short Term ATRs calculation----------------------------// short1=averagetruerange[3] short2=averagetruerange[5] short3=averagetruerange[8] shortAvg=(short1+short2+short3)/3 //------------------------------------------------------------// //-----Long Term ATRs calculation-----------------------------// Long1=averagetruerange[55] Long2=averagetruerange[89] Long3=averagetruerange[144] LongAvg=(Long1+Long2+Long3)/3 //------------------------------------------------------------// //-----Combined ATR value-------------------------------------// combinedATR = (shortAvg + longAvg) / 2 //------------------------------------------------------------// //-----Highest and lowest combined ATR over lookbackPeriod----// highestCombinedATR = highest[lookbackPeriod](combinedATR) lowestCombinedATR = lowest[lookbackPeriod](combinedATR) //------------------------------------------------------------// //-----RVM Calculation----------------------------------------// rvm = (combinedATR - lowestCombinedATR) / max(highestCombinedATR - lowestCombinedATR, 0.001) * 100 //------------------------------------------------------------// //-----Background color conditions----------------------------// if showBgColor and rvm>=0 and rvm <=10 then backgroundcolor(21,216,34,85) elsif showBgColor and rvm>10 and rvm<=20 then backgroundcolor(37,214,238,85) endif //------------------------------------------------------------// return rvm as "RVM"coloured("blue")style(line,2),50 as "Midpoint"coloured("grey")style(dottedline),20 as "Midpoint"coloured(37,214,238)style(dottedline),10 as "Midpoint"coloured(21,216,34)style(dottedline) |
Share this
No information on this site is investment advice or a solicitation to buy or sell any financial instrument. Past performance is not indicative of future results. Trading may expose you to risk of loss greater than your deposits and is only suitable for experienced investors who have sufficient financial means to bear such risk.
ProRealTime ITF files and other attachments :
Find other exclusive trading pro-tools on ![]()
PRC is also on YouTube, subscribe to our channel for exclusive content and tutorials