

Multi-Oscillator Adaptive Kernel
Every momentum oscillator tells a slightly different story. RSI reacts to the balance of up- and down-closes, the Stochastic to the position of price inside its recent range, the Money Flow Index to volume-weighted pressure, and the CCI to deviation from a typical-price average. Reading four panels at once is tiring, and any single oscillator can fire a false signal that the others would have vetoed.
The Multi-Oscillator Adaptive Kernel collapses up to four of these classic oscillators into a single, smoothed momentum line. Each component is normalised to a common ~[-100, +100] scale, the active ones are averaged, and the result is passed twice through a weighted smoothing kernel whose shape you can choose. What you get is one consensus oscillator plus a slower trend line — a compact read on whether momentum across several methods is genuinely aligned.
Theory Behind the Indicator
Normalising the components
Four oscillators are each rescaled to roughly the same bipolar range so they can be averaged fairly:
- RSI → (rsi – 50) * 2, mapping the 0–100 range onto -100…+100.
- Stochastic → a hand-computed %K on the chosen source, smoothed with a 3-period average, then rescaled the same way. When the range is flat the value falls back to the neutral midpoint.
- MFI → (mfi – 50) * 2, identical treatment to RSI but volume-weighted.
- CCI → divided by 4, since the CCI already oscillates around zero and only needs scaling.
Combining the active oscillators
Each component has an on/off switch. The indicator counts how many are active and averages only those, so turning a component off does not bias the result towards zero — it simply drops out of the mean. With the defaults (RSI, Stochastic and MFI on, CCI off) the raw value is the average of three aligned readings.
The adaptive kernel
The raw consensus is then smoothed by a weighted moving average whose weights decay with distance according to a selectable function:
| Kernel | Weight `w(i)` | Character |
|---|---|---|
| Exponential | `exp(-5·i/len)` | Fast, recent-biased |
| Linear | `1 − i/len` | Even decay |
| Gaussian | `exp(−0.5·(3·i/len)²)` | Smoothest, bell-shaped |
The smoothed series is Σ value[i]·w(i) / Σ w(i). The kernel is applied twice: once to the raw value over a window of kernelLen (producing the fast Signal line), and again to that result over a window of kernelLen·2 (producing the slower Trend line). The second pass is what gives the indicator its regime read — when both lines sit on the same side of zero, the multi-oscillator consensus and its own trend agree.
Key Features at a Glance
- One consensus oscillator built from up to four classic components (RSI, Stochastic, MFI, CCI).
- Each component independently switchable; the average self-adjusts to the active set.
- Three selectable smoothing kernels (exponential, linear, Gaussian).
- Two output lines: a fast Signal and a slower Trend, both centred on zero.
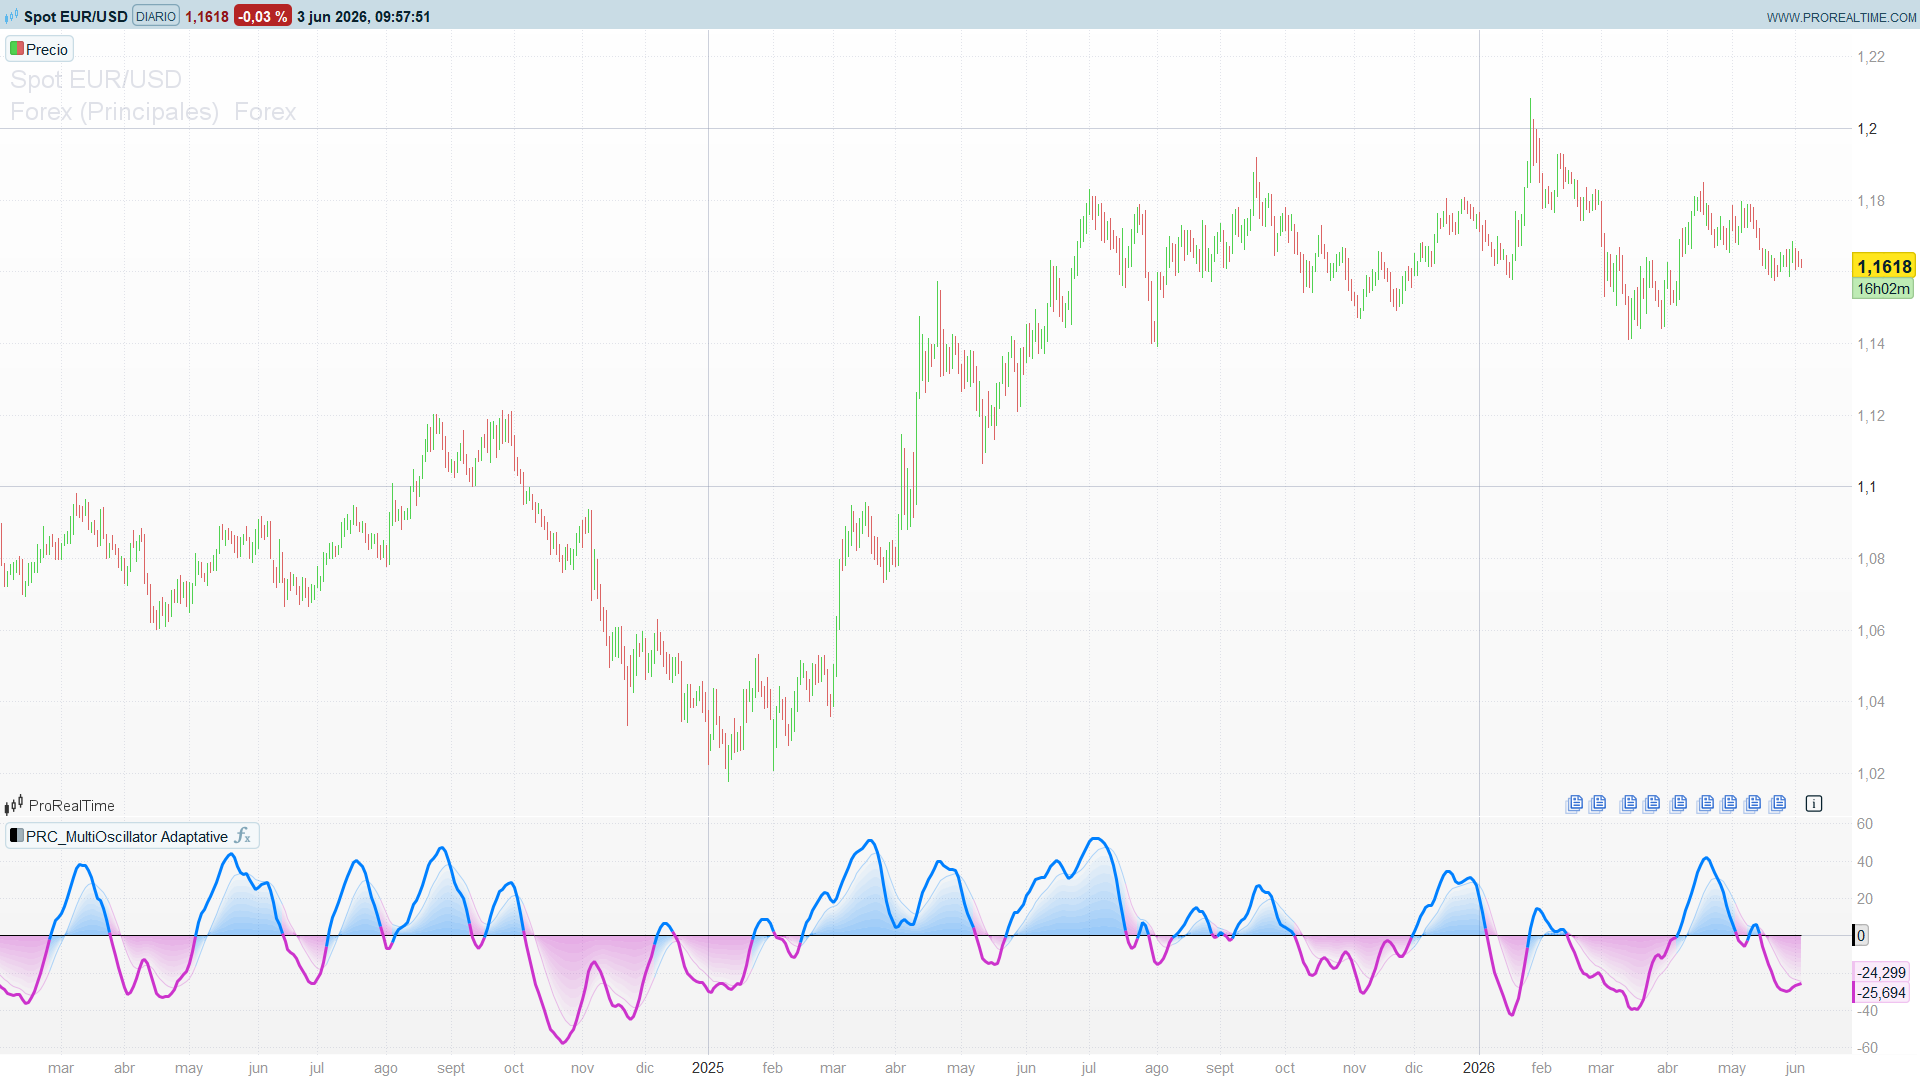
- The Signal line is coloured cyan above zero and magenta below; the panel background shades by the Trend regime.
How to Read the Indicator
- Signal above zero — combined momentum across the active oscillators is positive (cyan line).
- Signal below zero — combined momentum is negative (magenta line).
- Both lines above zero (cyan background) — momentum and its trend agree on the upside.
- Both lines below zero (magenta background) — bearish alignment.
- Signal crossing its Trend line — the faster consensus is turning relative to its own slower regime, an early momentum-shift cue.
Because the line is an average of several methods, isolated false signals from one oscillator are diluted: a reading only pushes hard to the extremes when most active components agree.
Practical Applications
- Consensus filter. Trade only in the direction of the Signal line — long while it is above zero, short below — to require multi-method agreement before acting.
- Regime confirmation. Use the background shading (driven by the Trend line) as a top-down bias and take entries that align with it.
- Momentum turns. Treat Signal crossing Trend as an early warning that the consensus is rolling over, ahead of a full zero-line cross.
- Component tuning. Switch components on or off to match the instrument — for example enable CCI for index futures, or run RSI-only to compare the smoothed kernel against a plain RSI.
Indicator Configuration
- useRSI / useSTOCH / useMFI / useCCI (default: 1 / 1 / 1 / 0) — enable (1) or disable (0) each oscillator component.
- lenRSI (default: 14) — RSI period.
- lenSTOCH (default: 14) — Stochastic %K period.
- lenMFI (default: 14) — Money Flow Index period.
- lenCCI (default: 20) — CCI period.
- kernelType (default: 0) — smoothing kernel: 0 exponential, 1 linear, 2 Gaussian.
- kernelLen (default: 25) — window of the fast kernel; the slow kernel uses twice this length.
- src (default: customclose) — price source feeding the oscillators.
Code
//------------------------------------------------//
//PRC_MultiOscillator Adaptative Kernel
//version = 0
//18.04.2025
//Iván González @ www.prorealcode.com
//Sharing ProRealTime knowledge
//------------------------------------------------//
// inputs
//------------------------------------------------//
src=close
// Oscillator Toggles
usersi=1
usestoch=1
usemfi=1
usecci=0
// Oscillator Lengths
lenrsi=14
lenstoch=14
lenmfi=14
lencci=20
// Kernel Settings
kerneltype = 1// options=[1"Exponential", 2"Linear", 3"Gaussian"]
kernellen = 25//"Kernel Length"
//------------------------------------------------//
// Oscillators
//------------------------------------------------//
myrsi=rsi[lenrsi](src)
k=Stochastic[lenSTOCH,3](src)
m=MoneyFlowIndex[lenMFI]
c=cci[lencci](src)
//------------------------------------------------//
// Calculate active oscillators and Normalize
//------------------------------------------------//
activecount=0
// RSI
if useRSI then
   rsival=(myrsi-50)*2
   activecount=activecount+1
endif
// Stochastic
if useSTOCH then
   stochval=(k-50)*2
   activecount=activecount+1
endif
// Money flow index
if useMFI then
   mfival=(m-50)*2
   activecount=activecount+1
endif
// CCI
if useCCI then
   ccival=c/4
   activecount=activecount+1
endif
//------------------------------------------------//
// Combine indicators
//------------------------------------------------//
rawvalue=(rsival+stochval+mfival+ccival)/max(activecount, 1)
//------------------------------------------------//
// Calculate smoothed values with Kernel function
//------------------------------------------------//
//signal
sum=0
weightsum=0
w=0
for i = 0 to min(kernellen-1,barindex)
   if kerneltype=1 then//"Exponential"
      w=exp(-5.0 * i / kernellen)
   elsif kerneltype=2 then//"Linear"
      w=1.0-(i / kernellen)
   elsif kerneltype=3 then// "Gaussian"
      w=exp(-0.5*pow(3.0*i/kernellen, 2))
   endif
   sum=sum+rawvalue[i]*w
   weightsum=weightsum+w
next
signal=sum/weightsum
//signal2
sum2=0
weightsum2=0
w2=0
for i = 0 to min(kernellen*2-1,barindex)
   if kerneltype=1 then//"Exponential"
      w2=exp(-5.0*i/kernellen)
   elsif kerneltype=2 then//"Linear"
      w2=1.0-(i/kernellen)
   elsif kerneltype=3 then// "Gaussian"
      w2=exp(-0.5*pow(3.0*i/kernellen,2))
   endif
   sum2=sum2+signal[i]*w2
   weightsum2=weightsum2+w2
next
signal2=sum2/weightsum2
//------------------------------------------------//
// Define Trend conditions
//------------------------------------------------//
trendup = signal2 > 0
trenddown = signal2 < 0
//------------------------------------------------//
// Plot and colors
//------------------------------------------------//
//Signal
if signal>0 then
   rs=0
   gs=128
   bs=255
else
   rs=204
   gs=51
   bs=204
endif
//Signal2
layer1=signal2
layer2=signal2*0.9
layer3=signal2*0.8
layer4=signal2*0.7
layer5=signal2*0.6
layer6=signal2*0.5
layer7=signal2*0.4
layer8=signal2*0.3
layer9=signal2*0.2
layer10=signal2*0.1

colorbetween(layer1,layer2,rs,gs,bs,5)
colorbetween(layer3,layer2,rs,gs,bs,15)
colorbetween(layer3,layer4,rs,gs,bs,25)
colorbetween(layer5,layer4,rs,gs,bs,35)
colorbetween(layer5,layer6,rs,gs,bs,45)
colorbetween(layer7,layer6,rs,gs,bs,55)
colorbetween(layer7,layer8,rs,gs,bs,65)
colorbetween(layer9,layer8,rs,gs,bs,75)
colorbetween(layer9,layer10,rs,gs,bs,85)
colorbetween(0,layer10,rs,gs,bs,95)
//------------------------------------------------//
return 0 as "Zero", signal as "Signal line" coloured(rs,gs,bs)style(line,3),signal2 coloured(rs,gs,bs,75)style(line,1)
