

Stochastic RSI + Heikin Ashi
1. Introduction
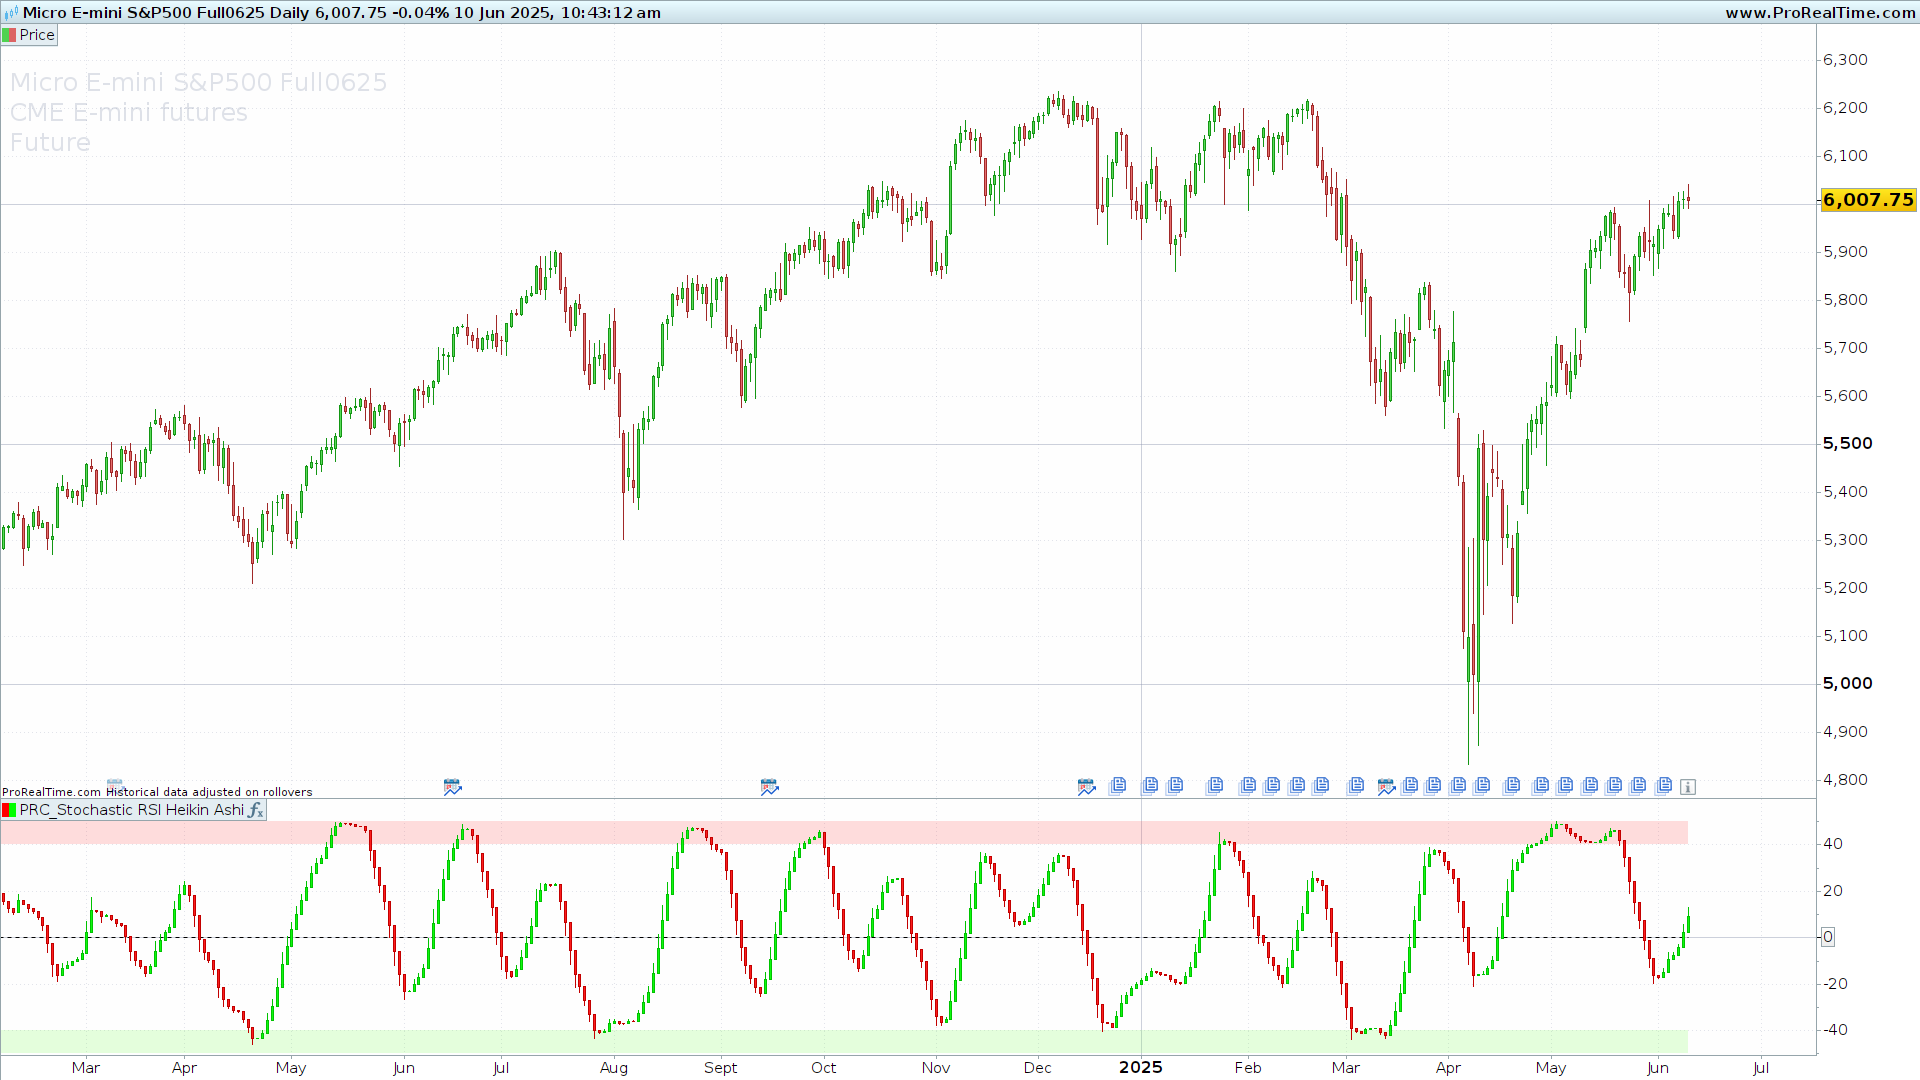
The technical indicator “Stochastic RSI + Heikin Ashi”, created by user CoffeeshopCrypto, is a hybrid tool that merges two complementary analytical approaches: the Stochastic RSI oscillator and Heikin Ashi candles. Its aim is to provide a clearer and smoother reading of market momentum, helping traders filter price noise and more accurately identify potential turning points.
2. Indicator Concept
This indicator is based on two core elements:
- Stochastic RSI (StochRSI): a second-derivative oscillator that applies the stochastic calculation to the RSI, making it highly sensitive to overbought and oversold levels and useful for detecting early trend reversals.
- Heikin Ashi Candles: a price smoothing technique that highlights market trends. In this case, the candles are built not from price, but from the smoothed StochRSI, making the indicator entirely momentum-based.
Combining both provides a clearer picture of market momentum while reducing the impact of false signals common with traditional oscillators.
3. How It Works
The indicator performs the following operations:
- RSI calculation using a customizable period (
lengthRSI). - Stochastic RSI computation:
- Calculates the current RSI value.
- Identifies the highest and lowest RSI values over a defined window (
lengthStoch). - Normalizes the RSI within that range to derive the stochastic oscillator.
- Smoothing:
- Applies moving averages to get smoothed %K (
smoothK) and %D (smoothD) lines. - Subtracts 50 to center the oscillation around zero.
- Applies moving averages to get smoothed %K (
- Heikin Ashi candle creation:
- Builds synthetic candles using smoothed %K and %D values.
- Colors candles green if close ≥ open, red otherwise.
- Visual zones:
- Adds shaded areas between +50/+40 and -40/-50 to highlight overbought and oversold zones.
4. Settings and Customizable Parameters
Key inputs include:
lengthRSI: RSI length (default: 14)lengthStoch: stochastic length applied to RSI (default: 14)smoothK: smoothing period for %K (default: 8)smoothD: smoothing period for %D (default: 3)
Reference levels:
- Overbought: +40 to +50
- Oversold: -40 to -50
These can be adjusted to suit your preferred signal sensitivity.
5. Practical Applications
This indicator is particularly useful for:
- Trend confirmation: Heikin Ashi candles help confirm ongoing momentum.
- Reversal signals: divergence and zero-crosses between %K and %D can indicate turning points.
- Noise reduction: visual representation makes it easier to ignore minor, non-actionable swings.
It serves as both a trend-following filter and a momentum reversal signal generator.
6. Source Code (ProRealTime – ProBuilder)
//------------------------------------------------//
//PRC_Stochastic RSI + Heikin Ashi
//version = 0
//02.05.25
//Iván González @ www.prorealcode.com
//Sharing ProRealTime knowledge
//------------------------------------------------//
//-----Inputs
//------------------------------------------------//
src=close
//---Stochastic RSI inputs
lengthRSI=14 //RSI length
lengthStoch=14 //Stochastic Length
smoothK=8 //K
smoothD=3 //D
//------------------------------------------------//
//-----Stochastic RSI Calculation
//------------------------------------------------//
rsi1=rsi[lengthRSI](src)
maxrsi=highest[lengthStoch](rsi1)
minrsi=lowest[lengthStoch](rsi1)
osc=(rsi1-minrsi)/(maxrsi-minrsi)*100
k=average[smoothK](osc)-50
d=average[smoothD](k)
//------------------------------------------------//
//-----Stochastic Heikin-ashi
//------------------------------------------------//
haopen=(k[1]+d[1])/2
haclose=(k+d+d+k)/4
hahigh=max(k,max(haopen,haclose))
halow=min(k,min(haopen,haclose))
//------------------------------------------------//
//-----Candles and Colors
//------------------------------------------------//
if haclose>=haopen then
r=0
g=255
b=0
else
r=255
g=0
b=0
endif

drawcandle(haopen,hahigh,halow,haclose)coloured(r,g,b)

ob1=50
ob2=40
os1=-50
os2=-40

colorbetween(ob1,ob2,255,82,82,50)
colorbetween(os1,os2,122,255,82,50)
//------------------------------------------------//
return 0 as "zero" style(dottedline)
