1. Introduction
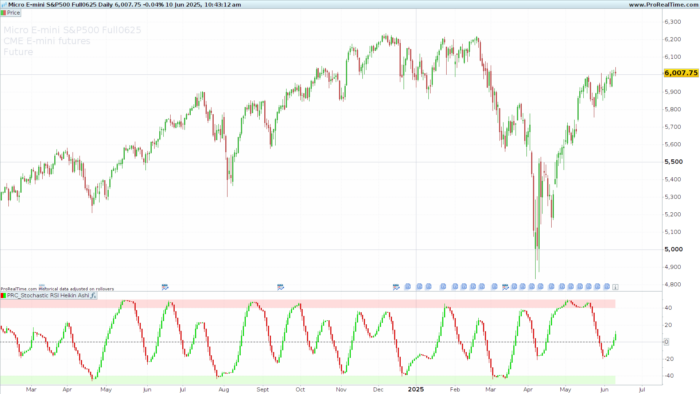
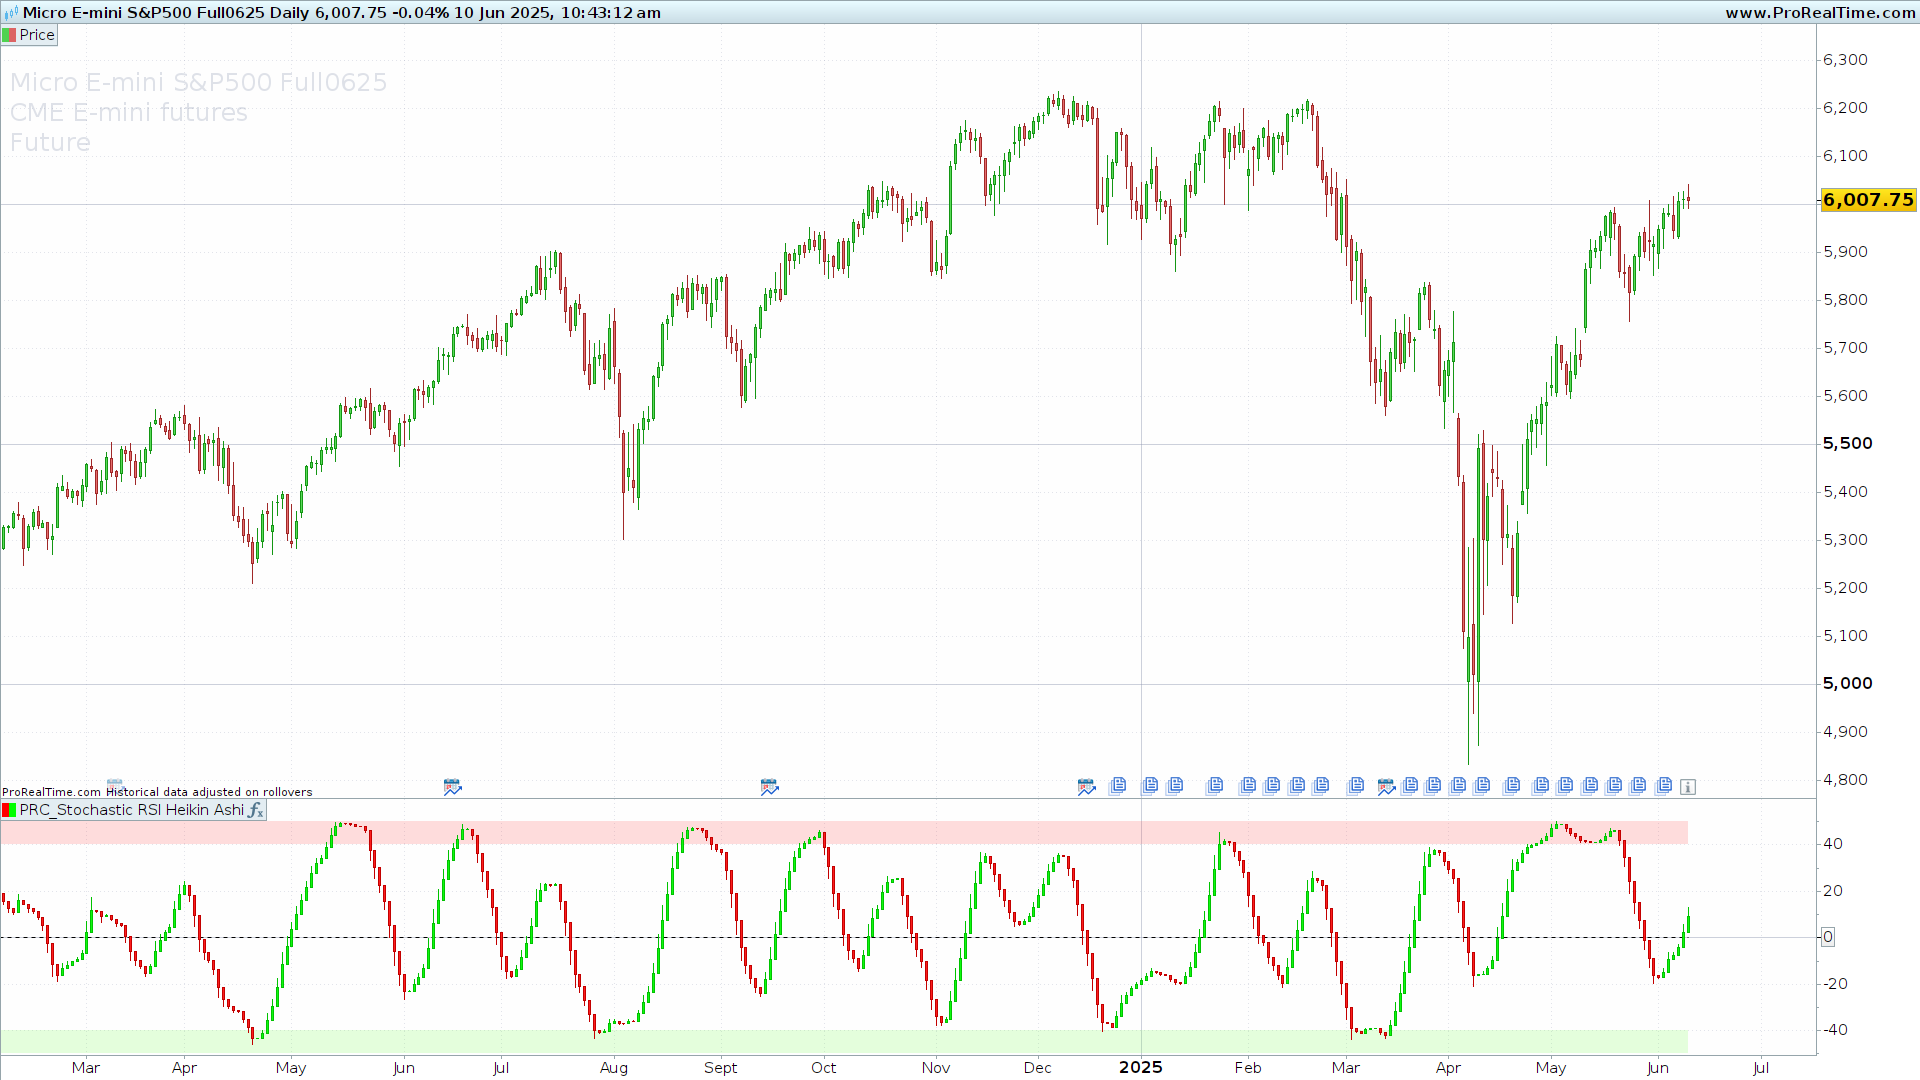
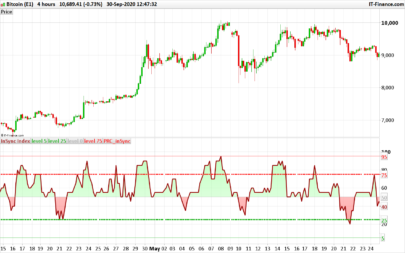
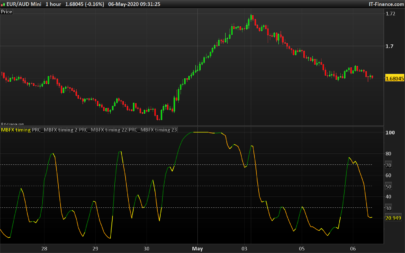
The technical indicator “Stochastic RSI + Heikin Ashi”, created by user CoffeeshopCrypto, is a hybrid tool that merges two complementary analytical approaches: the Stochastic RSI oscillator and Heikin Ashi candles. Its aim is to provide a clearer and smoother reading of market momentum, helping traders filter price noise and more accurately identify potential turning points.
2. Indicator Concept
This indicator is based on two core elements:
- Stochastic RSI (StochRSI): a second-derivative oscillator that applies the stochastic calculation to the RSI, making it highly sensitive to overbought and oversold levels and useful for detecting early trend reversals.
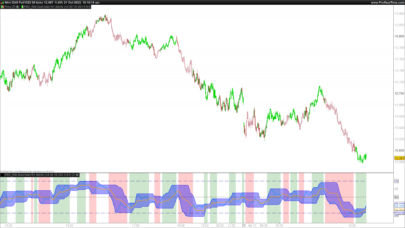
- Heikin Ashi Candles: a price smoothing technique that highlights market trends. In this case, the candles are built not from price, but from the smoothed StochRSI, making the indicator entirely momentum-based.
Combining both provides a clearer picture of market momentum while reducing the impact of false signals common with traditional oscillators.
3. How It Works
The indicator performs the following operations:
- RSI calculation using a customizable period (
lengthRSI). - Stochastic RSI computation:
- Calculates the current RSI value.
- Identifies the highest and lowest RSI values over a defined window (
lengthStoch). - Normalizes the RSI within that range to derive the stochastic oscillator.
- Smoothing:
- Applies moving averages to get smoothed %K (
smoothK) and %D (smoothD) lines. - Subtracts 50 to center the oscillation around zero.
- Applies moving averages to get smoothed %K (
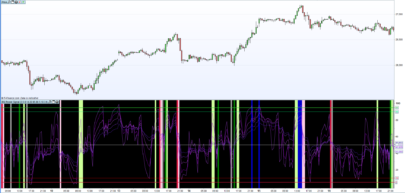
- Heikin Ashi candle creation:
- Builds synthetic candles using smoothed %K and %D values.
- Colors candles green if close ≥ open, red otherwise.
- Visual zones:
- Adds shaded areas between +50/+40 and -40/-50 to highlight overbought and oversold zones.
4. Settings and Customizable Parameters
Key inputs include:
lengthRSI: RSI length (default: 14)lengthStoch: stochastic length applied to RSI (default: 14)smoothK: smoothing period for %K (default: 8)smoothD: smoothing period for %D (default: 3)
Reference levels:
- Overbought: +40 to +50
- Oversold: -40 to -50
These can be adjusted to suit your preferred signal sensitivity.
5. Practical Applications
This indicator is particularly useful for:
- Trend confirmation: Heikin Ashi candles help confirm ongoing momentum.
- Reversal signals: divergence and zero-crosses between %K and %D can indicate turning points.
- Noise reduction: visual representation makes it easier to ignore minor, non-actionable swings.
It serves as both a trend-following filter and a momentum reversal signal generator.
6. Source Code (ProRealTime – ProBuilder)
|
1 2 3 4 5 6 7 8 9 10 11 12 13 14 15 16 17 18 19 20 21 22 23 24 25 26 27 28 29 30 31 32 33 34 35 36 37 38 39 40 41 42 43 44 45 46 47 48 49 50 51 52 53 54 55 |
//------------------------------------------------// //PRC_Stochastic RSI + Heikin Ashi //version = 0 //02.05.25 //Iván González @ www.prorealcode.com //Sharing ProRealTime knowledge //------------------------------------------------// //-----Inputs //------------------------------------------------// src=close //---Stochastic RSI inputs lengthRSI=14 //RSI length lengthStoch=14 //Stochastic Length smoothK=8 //K smoothD=3 //D //------------------------------------------------// //-----Stochastic RSI Calculation //------------------------------------------------// rsi1=rsi[lengthRSI](src) maxrsi=highest[lengthStoch](rsi1) minrsi=lowest[lengthStoch](rsi1) osc=(rsi1-minrsi)/(maxrsi-minrsi)*100 k=average[smoothK](osc)-50 d=average[smoothD](k) //------------------------------------------------// //-----Stochastic Heikin-ashi //------------------------------------------------// haopen=(k[1]+d[1])/2 haclose=(k+d+d+k)/4 hahigh=max(k,max(haopen,haclose)) halow=min(k,min(haopen,haclose)) //------------------------------------------------// //-----Candles and Colors //------------------------------------------------// if haclose>=haopen then r=0 g=255 b=0 else r=255 g=0 b=0 endif drawcandle(haopen,hahigh,halow,haclose)coloured(r,g,b) ob1=50 ob2=40 os1=-50 os2=-40 colorbetween(ob1,ob2,255,82,82,50) colorbetween(os1,os2,122,255,82,50) //------------------------------------------------// return 0 as "zero" style(dottedline) |
Share this
No information on this site is investment advice or a solicitation to buy or sell any financial instrument. Past performance is not indicative of future results. Trading may expose you to risk of loss greater than your deposits and is only suitable for experienced investors who have sufficient financial means to bear such risk.
ProRealTime ITF files and other attachments :
Find other exclusive trading pro-tools on ![]()
PRC is also on YouTube, subscribe to our channel for exclusive content and tutorials


thanks for the hard work and sharing