1. Introduction
In technical analysis, identifying trends and entry/exit points is crucial for improving decision-making in financial markets. Traders often rely on advanced tools to help them better visualize price behavior.
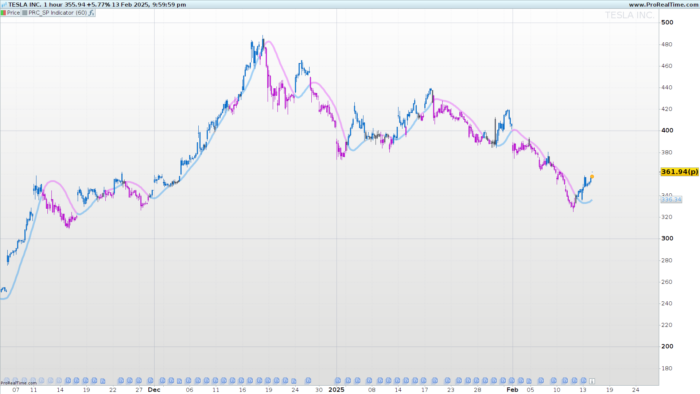
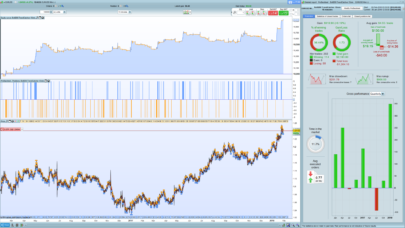
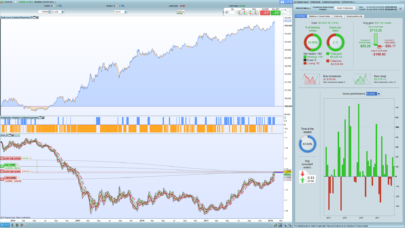
The SP Indicator is designed to facilitate trend detection and potential price reversals using smoothed moving averages and dynamic bands. This indicator combines weighted moving averages with volatility ranges to provide a clearer view of market movements.
In this article, we will explore how this indicator works, its key components, and how to interpret its signals to enhance trading strategies.
|
1 2 3 4 5 6 7 8 9 10 11 12 13 14 15 16 17 18 19 20 21 22 23 24 25 26 27 28 29 30 31 32 33 34 35 36 37 38 39 40 41 42 43 44 45 46 47 48 49 50 51 52 53 54 55 56 57 58 59 60 61 62 63 64 65 66 67 68 69 70 71 72 73 74 75 76 77 |
//---------------------------------------// //PRC_SP Indicator //version = 1 //11.02.2025 //Iván González @ www.prorealcode.com //Sharing ProRealTime knowledge //---------------------------------------// // inputs //---------------------------------------// src=close //once len=60 once sqrtlen = round(sqrt(len)) //showsignals=0 //---------------------------------------// // Moving Average and Bands //---------------------------------------// bbmc=average[sqrtlen,2](average[round(len/2),2](src)*2-average[len,2](src)) rangema=average[len,1](tr) upperk=bbmc+rangema*0.2 lowerk=bbmc-rangema*0.2 //---------------------------------------// // Colors Definition //---------------------------------------// if close>upperk then r=33 g=150 b=243 elsif close<lowerk then r=225 g=64 b=251 else r=120 g=123 b=134 endif drawcandle(open,high,low,close)coloured(r,g,b) //---------------------------------------// // Signals //---------------------------------------// if showsignals then //srcH=high once lenH = 15 once sqrtlenH = round(sqrt(lenH)) ExitHigh=average[sqrtlenH,2](average[round(lenH/2),2](high)*2-average[lenH,2](high)) //srcL=low once lenL = 15 once sqrtlenL = round(sqrt(lenL)) ExitLow=average[sqrtlenL,2](average[round(lenL/2),2](low)*2-average[lenL,2](low)) if close>ExitHigh then Hlv3=1 elsif close<ExitLow then Hlv3=-1 endif if Hlv3<0 then sslExit=ExitHigh else sslExit=ExitLow endif baseCrossLong=close crosses over sslExit baseCrossShort=close crosses under sslExit if baseCrossLong then codiff=1 drawarrowup(barindex,low-rangema*0.5)coloured(33,150,243) elsif baseCrossShort then codiff=-1 drawarrowdown(barindex,high+rangema*0.5)coloured(225,64,251) else codiff=1=undefined endif endif //---------------------------------------// return bbmc coloured(r,g,b,100)style(line,5) |
2. Indicator Components
The SP Indicator is built on several advanced calculations that smooth price data and generate more precise trading signals. Its main components include:
2.1. Moving Average and Bands
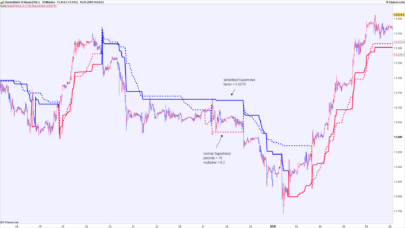
The indicator utilizes a special moving average based on the average of different time lengths. This moving average plays a key role in defining trend direction and establishing reference levels.
Additionally, dynamic bands are incorporated, functioning similarly to Bollinger Bands but with a different calculation method. These bands help identify overbought and oversold zones, allowing traders to anticipate potential pullbacks or trend continuations.
2.2. Candle Color Definition
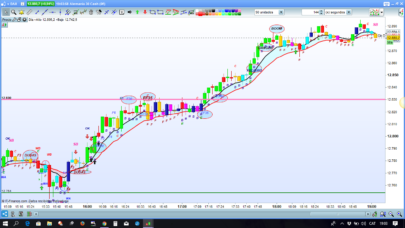
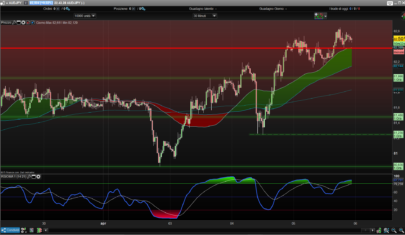
The SP Indicator colors candles based on their position relative to the dynamic bands, making market interpretation quicker:
- Blue: Indicates that the price is above the upper band, signaling strong bullish momentum.
- Purple: Indicates that the price is below the lower band, signaling strong bearish momentum.
- Gray: Represents a neutral zone where the price remains within the normal fluctuation range.
This color coding allows traders to quickly identify prevailing trends and potential reversal areas.
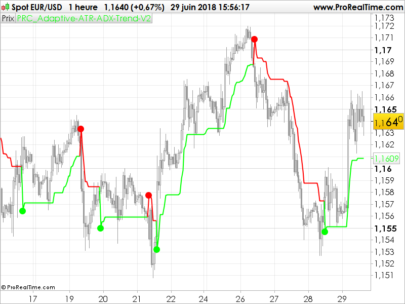
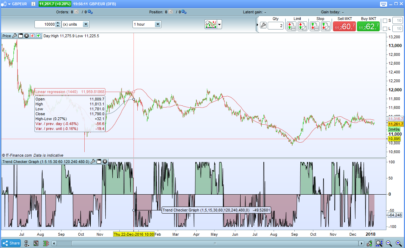
2.3. Entry and Exit Signals
The indicator also includes buy and sell signals based on crosses with a dynamic exit level. Exit levels are calculated for both long and short positions, and when the price crosses these levels, visual signals are generated:
- Upward blue arrow: Indicates a potential long entry.
- Downward purple arrow: Indicates a potential short entry.
These signals help traders identify trading opportunities without the need for additional calculations.
3. How to Interpret the Indicator
The SP Indicator provides a clear view of market trends and helps traders spot opportunities through its dynamic bands and visual signals. Below is how to interpret its components correctly:
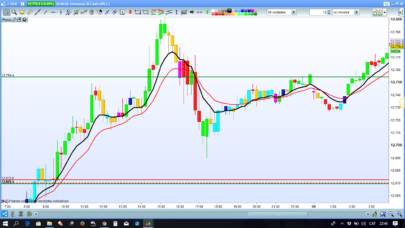
3.1. Using Dynamic Bands
The upper and lower bands act as key reference levels:
- When the price is above the upper band, it indicates a possible bullish continuation, suggesting strength in the trend. However, if the price weakens and moves back inside the band, it may signal exhaustion.
- When the price is below the lower band, it indicates bearish pressure. If the price moves back into the band after a strong decline, it may signal a potential reversal.
- If the price oscillates within the bands, the market is in a consolidation phase, suggesting lower chances of explosive moves.
3.2. Interpreting Candle Colors
The candle colors change depending on their relation to the bands, simplifying trend identification:
- Blue (strong bullish trend): When the price moves above the upper band, indicating a potential upward continuation.
- Purple (strong bearish trend): When the price falls below the lower band, suggesting a possible downward continuation.
- Gray (neutral zone): When the price stays within the bands, signaling market equilibrium without clear trading signals.
This color-coding allows traders to instantly recognize whether the market is trending or consolidating.
3.3. Using Cross Signals
The indicator generates entry signals when the price crosses the dynamic exit levels:
- Bullish cross (blue upward arrow): Occurs when the price crosses above the exit level, indicating a potential buy opportunity.
- Bearish cross (purple downward arrow): Happens when the price crosses below the exit level, suggesting a sell opportunity.
Traders can use these signals to confirm their analysis and refine their entry and exit strategies.
4. Configuration and Customization
The SP Indicator offers flexibility to adapt to different trading styles. Users can adjust key parameters to optimize its performance according to their needs.
4.1. Adjustable Parameters
Some of the values that can be modified in the indicator’s code include:
- Main moving average length: Determines the number of periods used for trend calculation. A higher value smooths the curve more, while lower values make it more responsive.
- Dynamic band factor: Defines the band width relative to market volatility. A higher value widens the bands, while a lower value keeps them closer to the price.
- Candle and signal colors: These can be customized to match the trader’s visual preferences.
4.2. Adjustments Based on Trading Style
Depending on the type of trading strategy, specific modifications can be made:
- Scalping and intraday trading: Use a shorter moving average period and tighter bands to detect quick price movements.
- Swing trading: Apply a longer period to capture extended trends and reduce false signals from minor fluctuations.
- High-volatility market trading: Widen the bands to reduce erroneous signals caused by sharp price movements.
By fine-tuning these parameters, traders can optimize the SP Indicator for their strategy and the asset they are analyzing.
5. Conclusion
The SP Indicator is a versatile tool designed to simplify trend identification and signal detection in the market. Its combination of smoothed moving averages, dynamic bands, and visual signals makes it a powerful indicator for various trading styles.
Share this
No information on this site is investment advice or a solicitation to buy or sell any financial instrument. Past performance is not indicative of future results. Trading may expose you to risk of loss greater than your deposits and is only suitable for experienced investors who have sufficient financial means to bear such risk.
ProRealTime ITF files and other attachments :
Find other exclusive trading pro-tools on ![]()
PRC is also on YouTube, subscribe to our channel for exclusive content and tutorials


Ivan I don’t see any arrow in your chart
Bonsoir , merci Ivan pour c’est indicateur qui est très intéressent , mais il manque les flèches , comme MaoRai54 . Salutations .
hi mate
we can not see arrows on the chart it will be nice if you can fix that please
Hi Ivan thanks a lot, very useful!!! I would like highlight also this post – https://www.prorealcode.com/topic/trend-reversal-probability/#post-243879 because I think it is an indicator very useful from TV that translated can give us a very good bias, what do you think?
Thank you in advance!! :):):)
ok. I will check
Bonjour à tous, il suffit au début du code, de mettre showsignals=1
Bonsoir , merci ARLEQUIN49 , et mille fois merci a Ivan pour tout ses partages .
soit ligne 13, il faut enlever les 2 slash “//” et mettre = 1 au lieu de 0. Soit mieux, rajouter showsignals dans les variables de l’indicateur en tant que boolean, pour pouvoir afficher les signaux (fleches) ou pas sans avoir à re-entrer dans le code à chaque fois…
Hi! just change line13 for this:
showsignals=1
Hi
Excellent indicator as usual. Just 2 questions:
Why LenH and LenL = 15 as Len could be 60 or other value ?
Why 0.2 in upperk=bbmc+rangema*0.2 and lowerk=bbmc-rangema*0.2 and not other value
Thank four your reply
Hi! good question. This is a code request traslation from other platform. I took same inputs as original code.
Feel free to modify and test other values.