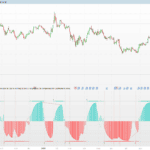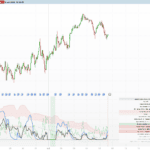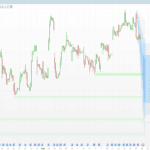






Sight of Market Structure: Swing and Internal BOS, CHoCH, Supply & Demand Zones
Introduction
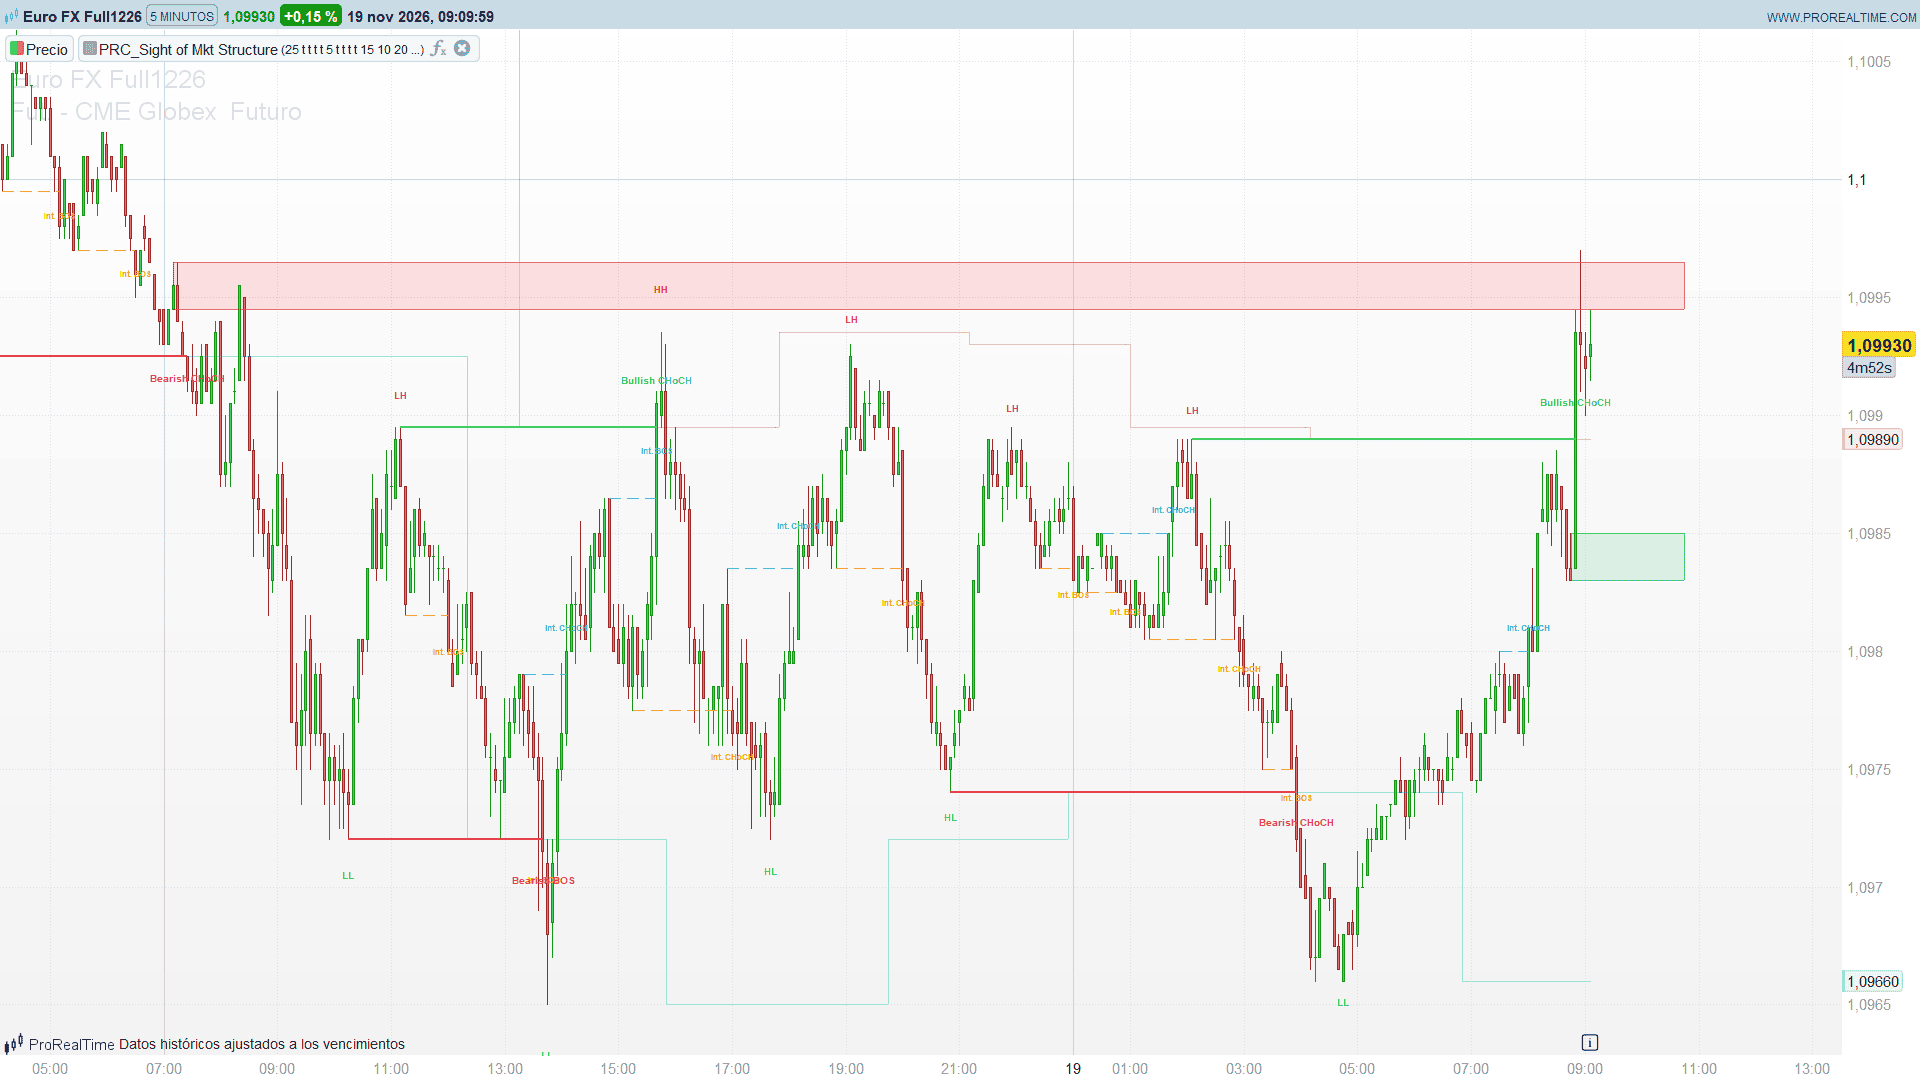
Reading market structure by hand means keeping track of two scales at once: the big swings that define the trend and the small internal swings that show what price is doing inside them. Sight of Market Structure by Jos-ProTrader does that bookkeeping on the chart. It labels every swing as a higher high, lower high, higher low or lower low, marks each Break of Structure (BOS) and Change of Character (CHoCH) on both scales, flags equal highs and equal lows, and builds supply and demand zones from the candle that started each swing break.
Theory Behind the Indicator
Swing structure. A swing high is a bar whose high is above the highs of the swingLength bars on each side (25 by default); a swing low is the mirror case. Each new swing is compared with the previous one on the same side: HH or LH for highs, HL or LL for lows. The last swing high and the last swing low are drawn as step lines, the levels that price has to break.
BOS and CHoCH. When a close crosses above the last swing high (or below the last swing low) for the first time, the level is broken. If the swing trend was already in that direction, the break is a BOS, a continuation. If the trend was the opposite one, it is a CHoCH, the first sign that the trend may be changing. Each level can only be broken once.
Internal structure. The same logic runs on short pivots of internalLength bars (5 by default). Internal breaks come much earlier and much more often; they show the micro structure inside the swing legs.
Equal highs and lows. When a new swing high lands within equalTolerance times the ATR(14) of the previous swing high, both are marked as EQH, a pool of resting liquidity. The same applies to swing lows (EQL).
Supply and demand zones. On every bullish swing break, the last bearish candle within the previous zoneLookback bars becomes a demand zone, from its low to its high. On every bearish swing break, the last bullish candle becomes a supply zone. Zones extend to the right until a close goes through their far side, and only the most recent maxZones zones per side stay on the chart.
Key Features at a Glance
- Swing structure labels: HH, LH, HL and LL.
- Swing BOS and CHoCH with thick lines from the swing to the break.
- Internal BOS and CHoCH with dashed lines and smaller labels.
- Step lines for the current swing high and swing low.
- EQH and EQL detection with an ATR based tolerance.
- Supply and demand zones built from the origin candle of each swing break, removed when mitigated.
- Every layer can be switched on or off.
How to Read the Indicator
- HH / HL sequence: bullish swing structure. LH / LL sequence: bearish swing structure.
- Bullish BOS (green, above the level): the uptrend continues. Bullish CHoCH: the first break of a swing high after a bearish phase.
- Bearish BOS / Bearish CHoCH (red, below the level): the same on the downside.
- Int. BOS / Int. CHoCH: aqua for bullish internal breaks, orange for bearish ones. An internal CHoCH against the swing trend is often the first warning before a swing CHoCH.
- Green boxes: demand zones still active. Red boxes: supply zones still active. A box disappears once a close goes through it.
- EQH / EQL with a yellow dotted line: two swing extremes at almost the same price, where stops are likely resting.
Practical Applications
- Trend bias. The last swing BOS or CHoCH tells you which side the swing structure is on; internal breaks in the same direction confirm it.
- Pullback entries. After a bullish swing break, the new demand zone is a natural area to look for longs on a pullback, with a close below the zone as invalidation. The mirror case applies to supply zones.
- Early warning. A sequence of internal CHoCHs against the swing trend while price approaches a swing level shows that momentum is fading before the swing structure turns.
- Liquidity targets. EQH and EQL mark obvious stop clusters that price often runs before reversing.
Indicator Configuration
- swingLength (default: 25): bars on each side for a swing pivot.
- showSwing (default: 1): shows the swing BOS and CHoCH.
- showSwingLabels (default: 1): shows the HH / HL / LH / LL labels.
- showSwingBOS (default: 1) and showSwingCHoCH (default: 1): each type of swing break.
- internalLength (default: 5): bars on each side for an internal pivot.
- showInternal (default: 1): shows the internal structure.
- showInternalBOS (default: 1) and showInternalCHoCH (default: 1): each type of internal break.
- showInternalLabels (default: 1): draws the internal lines and labels.
- showZones (default: 1): supply and demand zones.
- zoneLookback (default: 15): candles searched back for the origin candle of a zone, from 1 to 100.
- maxZones (default: 10): maximum active zones per side, from 1 to 50.
- zoneExtend (default: 20): bars the active zones are extended beyond the last bar.
- showLiquidity (default: 1): EQH and EQL.
- equalTolerance (default: 0.10): maximum distance between two swing extremes, in ATR(14) units.
- showLevels (default: 1): step lines of the last swing high and swing low.
- Colour variables at the top of the code: bull, bear, internal bull, internal bear and equal levels.
Code
//---------------------------------------------------------------
// PRC_Sight of Mkt Structure
// version = 0
// 19.11.2026
// Iván González @ www.prorealcode.com
// Author: Jos-ProTrader
// Sharing ProRealTime knowledge
//--------------------------------------------------------------------//
defparam drawonlastbaronly = true

// ===================== INPUTS
// --- Swing structure
swingLength = 25
showSwing = 1
showSwingLabels = 1      // HH / HL / LH / LL
showSwingBOS = 1
showSwingCHoCH = 1
// --- Internal structure
internalLength = 5
showInternal = 1
showInternalBOS = 1
showInternalCHoCH = 1
// --- Supply and demand zones
showZones = 1
zoneLookback = 15        // candles searched back for the origin candle (1 to 100)
maxZones = 10            // maximum zones per side (1 to 50)
zoneExtend = 20          // bars the active zones are extended past the last bar
// --- Equal highs and lows
showLiquidity = 1
equalTolerance = 0.10    // in ATR(14) units
// --- Display
showLevels = 1
showInternalLabels = 1

// ===================== COLORS
bullR = 0
bullG = 190
bullB = 120
bearR = 230
bearG = 65
bearB = 75
intBullR = 0
intBullG = 188
intBullB = 212
intBearR = 255
intBearG = 152
intBearB = 0
eqR = 253
eqG = 216
eqB = 53

// ===================== STATE
ONCE hasSH = 0
ONCE hasSL = 0
ONCE lastSH = 0
ONCE lastSL = 0
ONCE prevSH = 0
ONCE prevSL = 0
ONCE swHiBar = 0
ONCE swLoBar = 0
ONCE swHiBroken = 0
ONCE swLoBroken = 0
ONCE swTrend = 0
ONCE hasIH = 0
ONCE hasIL = 0
ONCE intHi = 0
ONCE intLo = 0
ONCE intHiBar = 0
ONCE intLoBar = 0
ONCE intHiBroken = 0
ONCE intLoBroken = 0
ONCE intTrend = 0
ONCE nLb = 0             // labels stored (append only)
ONCE nLn = 0             // lines stored (append only)
ONCE nJh = 0             // steps of the swing high level
ONCE nJl = 0             // steps of the swing low level
ONCE nDz = 0             // demand zones stored
ONCE nSz = 0             // supply zones stored
ONCE dzStart = 0
ONCE szStart = 0

sLen = max(2, round(swingLength))
iLen = max(1, round(internalLength))
myAtr = averagetruerange[14](close)

// ===================== 1. SWING PIVOTS (strict against the later bars, >= against the earlier ones)
swPH = 0
swPL = 0
IF barindex >= 2 * sLen THEN
   hhS = highest[sLen](high)
   IF high[sLen] > hhS AND high[sLen] >= hhS[sLen + 1] THEN
      swPH = 1
   ENDIF
   llS = lowest[sLen](low)
   IF low[sLen] < llS AND low[sLen] <= llS[sLen + 1] THEN
      swPL = 1
   ENDIF
ENDIF

// Swing high: HH / LH label against the previous swing high
IF swPH = 1 THEN
   pvVal = high[sLen]
   IF showSwingLabels = 1 AND hasSH = 1 THEN
      $lbX[nLb] = barindex - sLen
      $lbY[nLb] = pvVal
      $lbA[nLb] = myAtr
      IF pvVal > prevSH THEN
         $lbT[nLb] = 1
      ELSE
         $lbT[nLb] = 2
      ENDIF
      nLb = nLb + 1
   ENDIF
   IF hasSH = 1 THEN
      $jhX[nJh] = barindex
      $jhOld[nJh] = lastSH
      $jhNew[nJh] = pvVal
      nJh = nJh + 1
   ENDIF
   prevSH = pvVal
   lastSH = pvVal
   hasSH = 1
   swHiBar = barindex - sLen
   swHiBroken = 0
ENDIF

// Swing low: HL / LL label against the previous swing low
IF swPL = 1 THEN
   pvVal = low[sLen]
   IF showSwingLabels = 1 AND hasSL = 1 THEN
      $lbX[nLb] = barindex - sLen
      $lbY[nLb] = pvVal
      $lbA[nLb] = myAtr
      IF pvVal > prevSL THEN
         $lbT[nLb] = 3
      ELSE
         $lbT[nLb] = 4
      ENDIF
      nLb = nLb + 1
   ENDIF
   IF hasSL = 1 THEN
      $jlX[nJl] = barindex
      $jlOld[nJl] = lastSL
      $jlNew[nJl] = pvVal
      nJl = nJl + 1
   ENDIF
   prevSL = pvVal
   lastSL = pvVal
   hasSL = 1
   swLoBar = barindex - sLen
   swLoBroken = 0
ENDIF

// ===================== 2. SWING BOS AND CHoCH (close crossing the last swing level)
swBullBrk = 0
swBearBrk = 0
IF hasSH = 1 AND hasSH[1] = 1 AND swHiBroken = 0 THEN
   IF close > lastSH AND close[1] <= lastSH[1] THEN
      swBullBrk = 1
   ENDIF
ENDIF
IF hasSL = 1 AND hasSL[1] = 1 AND swLoBroken = 0 THEN
   IF close < lastSL AND close[1] >= lastSL[1] THEN
      swBearBrk = 1
   ENDIF
ENDIF

IF swBullBrk = 1 THEN
   swHiBroken = 1
   isChoch = 0
   IF swTrend = -1 THEN
      isChoch = 1
   ENDIF
   IF showSwing = 1 AND ((isChoch = 1 AND showSwingCHoCH = 1) OR (isChoch = 0 AND showSwingBOS = 1)) THEN
      $lnX1[nLn] = swHiBar
      $lnY1[nLn] = lastSH
      $lnX2[nLn] = barindex
      $lnY2[nLn] = lastSH
      $lnT[nLn] = 1
      nLn = nLn + 1
      $lbX[nLb] = barindex
      $lbY[nLb] = lastSH
      $lbA[nLb] = myAtr
      $lbT[nLb] = 6 - isChoch
      nLb = nLb + 1
   ENDIF
   swTrend = 1
ENDIF

IF swBearBrk = 1 THEN
   swLoBroken = 1
   isChoch = 0
   IF swTrend = 1 THEN
      isChoch = 1
   ENDIF
   IF showSwing = 1 AND ((isChoch = 1 AND showSwingCHoCH = 1) OR (isChoch = 0 AND showSwingBOS = 1)) THEN
      $lnX1[nLn] = swLoBar
      $lnY1[nLn] = lastSL
      $lnX2[nLn] = barindex
      $lnY2[nLn] = lastSL
      $lnT[nLn] = 2
      nLn = nLn + 1
      $lbX[nLb] = barindex
      $lbY[nLb] = lastSL
      $lbA[nLb] = myAtr
      $lbT[nLb] = 8 - isChoch
      nLb = nLb + 1
   ENDIF
   swTrend = -1
ENDIF

// ===================== 3. INTERNAL STRUCTURE
inPH = 0
inPL = 0
IF barindex >= 2 * iLen THEN
   hhI = highest[iLen](high)
   IF high[iLen] > hhI AND high[iLen] >= hhI[iLen + 1] THEN
      inPH = 1
   ENDIF
   llI = lowest[iLen](low)
   IF low[iLen] < llI AND low[iLen] <= llI[iLen + 1] THEN
      inPL = 1
   ENDIF
ENDIF
IF inPH = 1 THEN
   intHi = high[iLen]
   hasIH = 1
   intHiBar = barindex - iLen
   intHiBroken = 0
ENDIF
IF inPL = 1 THEN
   intLo = low[iLen]
   hasIL = 1
   intLoBar = barindex - iLen
   intLoBroken = 0
ENDIF

inBullBrk = 0
inBearBrk = 0
IF hasIH = 1 AND hasIH[1] = 1 AND intHiBroken = 0 THEN
   IF close > intHi AND close[1] <= intHi[1] THEN
      inBullBrk = 1
   ENDIF
ENDIF
IF hasIL = 1 AND hasIL[1] = 1 AND intLoBroken = 0 THEN
   IF close < intLo AND close[1] >= intLo[1] THEN
      inBearBrk = 1
   ENDIF
ENDIF

IF inBullBrk = 1 THEN
   intHiBroken = 1
   isChoch = 0
   IF intTrend = -1 THEN
      isChoch = 1
   ENDIF
   IF showInternal = 1 AND showInternalLabels = 1 AND ((isChoch = 1 AND showInternalCHoCH = 1) OR (isChoch = 0 AND showInternalBOS = 1)) THEN
      $lnX1[nLn] = intHiBar
      $lnY1[nLn] = intHi
      $lnX2[nLn] = barindex
      $lnY2[nLn] = intHi
      $lnT[nLn] = 3
      nLn = nLn + 1
      $lbX[nLb] = barindex
      $lbY[nLb] = intHi
      $lbA[nLb] = myAtr
      $lbT[nLb] = 10 - isChoch
      nLb = nLb + 1
   ENDIF
   intTrend = 1
ENDIF

IF inBearBrk = 1 THEN
   intLoBroken = 1
   isChoch = 0
   IF intTrend = 1 THEN
      isChoch = 1
   ENDIF
   IF showInternal = 1 AND showInternalLabels = 1 AND ((isChoch = 1 AND showInternalCHoCH = 1) OR (isChoch = 0 AND showInternalBOS = 1)) THEN
      $lnX1[nLn] = intLoBar
      $lnY1[nLn] = intLo
      $lnX2[nLn] = barindex
      $lnY2[nLn] = intLo
      $lnT[nLn] = 4
      nLn = nLn + 1
      $lbX[nLb] = barindex
      $lbY[nLb] = intLo
      $lbA[nLb] = myAtr
      $lbT[nLb] = 12 - isChoch
      nLb = nLb + 1
   ENDIF
   intTrend = -1
ENDIF

// ===================== 4. EQUAL HIGHS AND EQUAL LOWS (new swing within the ATR tolerance of the previous one)
// The line starts swingLength bars before the new pivot, as in the original layout
IF showLiquidity = 1 AND swPH = 1 AND hasSH[1] = 1 THEN
   IF abs(high[sLen] - prevSH[1]) <= myAtr * equalTolerance THEN
      $lnX1[nLn] = barindex - 2 * sLen
      $lnY1[nLn] = prevSH[1]
      $lnX2[nLn] = barindex - sLen
      $lnY2[nLn] = high[sLen]
      $lnT[nLn] = 5
      nLn = nLn + 1
      $lbX[nLb] = barindex - sLen
      $lbY[nLb] = high[sLen]
      $lbA[nLb] = myAtr
      $lbT[nLb] = 13
      nLb = nLb + 1
   ENDIF
ENDIF
IF showLiquidity = 1 AND swPL = 1 AND hasSL[1] = 1 THEN
   IF abs(low[sLen] - prevSL[1]) <= myAtr * equalTolerance THEN
      $lnX1[nLn] = barindex - 2 * sLen
      $lnY1[nLn] = prevSL[1]
      $lnX2[nLn] = barindex - sLen
      $lnY2[nLn] = low[sLen]
      $lnT[nLn] = 5
      nLn = nLn + 1
      $lbX[nLb] = barindex - sLen
      $lbY[nLb] = low[sLen]
      $lbA[nLb] = myAtr
      $lbT[nLb] = 14
      nLb = nLb + 1
   ENDIF
ENDIF

// ===================== 5. SUPPLY AND DEMAND ZONES
// Append-only lists: a zone dies (end bar stored) when it is mitigated or pushed out by the
// zone limit. Deaths recorded on this bar are undone first, so every tick recomputes them.
WHILE dzStart < nDz AND $dzEnd[dzStart] >= 0 AND $dzEnd[dzStart] < barindex DO
   dzStart = dzStart + 1
WEND
WHILE szStart < nSz AND $szEnd[szStart] >= 0 AND $szEnd[szStart] < barindex DO
   szStart = szStart + 1
WEND
IF nDz > dzStart THEN
   FOR i = dzStart TO nDz - 1 DO
      IF $dzEnd[i] >= barindex THEN
         $dzEnd[i] = -1
      ENDIF
   NEXT
ENDIF
IF nSz > szStart THEN
   FOR i = szStart TO nSz - 1 DO
      IF $szEnd[i] >= barindex THEN
         $szEnd[i] = -1
      ENDIF
   NEXT
ENDIF
zLook = max(1, min(100, round(zoneLookback)))
zMax = max(1, min(50, round(maxZones)))

// Demand: last bearish candle before the bullish swing break
IF showZones = 1 AND swBullBrk = 1 THEN
   cIdx = 0
   FOR i = 1 TO zLook DO
      IF cIdx = 0 AND close[i] < open[i] THEN
         cIdx = i
      ENDIF
   NEXT
   IF cIdx > 0 THEN
      $dzL[nDz] = barindex - cIdx
      $dzTop[nDz] = high[cIdx]
      $dzBot[nDz] = low[cIdx]
      $dzEnd[nDz] = -1
      nDz = nDz + 1
      aliveN = 0
      oldest = -1
      FOR i = dzStart TO nDz - 1 DO
         IF $dzEnd[i] = -1 THEN
            aliveN = aliveN + 1
            IF oldest = -1 THEN
               oldest = i
            ENDIF
         ENDIF
      NEXT
      IF aliveN > zMax THEN
         $dzEnd[oldest] = barindex
      ENDIF
   ENDIF
ENDIF

// Supply: last bullish candle before the bearish swing break
IF showZones = 1 AND swBearBrk = 1 THEN
   cIdx = 0
   FOR i = 1 TO zLook DO
      IF cIdx = 0 AND close[i] > open[i] THEN
         cIdx = i
      ENDIF
   NEXT
   IF cIdx > 0 THEN
      $szL[nSz] = barindex - cIdx
      $szTop[nSz] = high[cIdx]
      $szBot[nSz] = low[cIdx]
      $szEnd[nSz] = -1
      nSz = nSz + 1
      aliveN = 0
      oldest = -1
      FOR i = szStart TO nSz - 1 DO
         IF $szEnd[i] = -1 THEN
            aliveN = aliveN + 1
            IF oldest = -1 THEN
               oldest = i
            ENDIF
         ENDIF
      NEXT
      IF aliveN > zMax THEN
         $szEnd[oldest] = barindex
      ENDIF
   ENDIF
ENDIF

// Mitigation: a close beyond the far side of the zone removes it
IF nDz > dzStart THEN
   FOR i = dzStart TO nDz - 1 DO
      IF $dzEnd[i] = -1 AND close < $dzBot[i] THEN
         $dzEnd[i] = barindex
      ENDIF
   NEXT
ENDIF
IF nSz > szStart THEN
   FOR i = szStart TO nSz - 1 DO
      IF $szEnd[i] = -1 AND close > $szTop[i] THEN
         $szEnd[i] = barindex
      ENDIF
   NEXT
ENDIF

// ===================== 6. SWING LEVELS (step lines)
// The jump bar is hidden with alpha 0 and the step is drawn with two segments
aHi = 89
aLo = 89
IF showLevels = 0 OR hasSH = 0 THEN
   aHi = 0
ELSIF hasSH[1] = 1 AND lastSH <> lastSH[1] THEN
   aHi = 0
ENDIF
IF showLevels = 0 OR hasSL = 0 THEN
   aLo = 0
ELSIF hasSL[1] = 1 AND lastSL <> lastSL[1] THEN
   aLo = 0
ENDIF
IF hasSH = 1 THEN
   lvHi = lastSH
ELSE
   lvHi = close
ENDIF
IF hasSL = 1 THEN
   lvLo = lastSL
ELSE
   lvLo = close
ENDIF

// ===================== DRAWING
IF islastbarupdate THEN
   // --- Steps of the swing levels
   IF showLevels = 1 THEN
      IF nJh > 0 THEN
         FOR j = 0 TO nJh - 1 DO
            DRAWSEGMENT($jhX[j] - 1, $jhOld[j], $jhX[j], $jhOld[j]) COLOURED(bearR, bearG, bearB, 89) STYLE(line, 1)
            DRAWSEGMENT($jhX[j], $jhOld[j], $jhX[j], $jhNew[j]) COLOURED(bearR, bearG, bearB, 89) STYLE(line, 1)
         NEXT
      ENDIF
      IF nJl > 0 THEN
         FOR j = 0 TO nJl - 1 DO
            DRAWSEGMENT($jlX[j] - 1, $jlOld[j], $jlX[j], $jlOld[j]) COLOURED(bullR, bullG, bullB, 89) STYLE(line, 1)
            DRAWSEGMENT($jlX[j], $jlOld[j], $jlX[j], $jlNew[j]) COLOURED(bullR, bullG, bullB, 89) STYLE(line, 1)
         NEXT
      ENDIF
   ENDIF

   // --- Active supply and demand zones
   xRight = barindex + zoneExtend
   IF nDz > dzStart THEN
      FOR j = dzStart TO nDz - 1 DO
         IF $dzEnd[j] = -1 THEN
            DRAWRECTANGLE($dzL[j], $dzTop[j], xRight, $dzBot[j]) COLOURED(bullR, bullG, bullB, 166) FILLCOLOR(76, 175, 80, 38)
         ENDIF
      NEXT
   ENDIF
   IF nSz > szStart THEN
      FOR j = szStart TO nSz - 1 DO
         IF $szEnd[j] = -1 THEN
            DRAWRECTANGLE($szL[j], $szTop[j], xRight, $szBot[j]) COLOURED(bearR, bearG, bearB, 166) FILLCOLOR(242, 54, 69, 38)
         ENDIF
      NEXT
   ENDIF

   // --- Lines: the 500 most recent
   IF nLn > 0 THEN
      FOR j = nLn - 1 DOWNTO max(0, nLn - 500) DO
         IF $lnT[j] = 1 THEN
            DRAWSEGMENT($lnX1[j], $lnY1[j], $lnX2[j], $lnY2[j]) COLOURED(bullR, bullG, bullB, 255) STYLE(line, 2)
         ELSIF $lnT[j] = 2 THEN
            DRAWSEGMENT($lnX1[j], $lnY1[j], $lnX2[j], $lnY2[j]) COLOURED(bearR, bearG, bearB, 255) STYLE(line, 2)
         ELSIF $lnT[j] = 3 THEN
            DRAWSEGMENT($lnX1[j], $lnY1[j], $lnX2[j], $lnY2[j]) COLOURED(intBullR, intBullG, intBullB, 255) STYLE(dottedline2, 1)
         ELSIF $lnT[j] = 4 THEN
            DRAWSEGMENT($lnX1[j], $lnY1[j], $lnX2[j], $lnY2[j]) COLOURED(intBearR, intBearG, intBearB, 255) STYLE(dottedline2, 1)
         ELSE
            DRAWSEGMENT($lnX1[j], $lnY1[j], $lnX2[j], $lnY2[j]) COLOURED(eqR, eqG, eqB, 255) STYLE(dottedline, 2)
         ENDIF
      NEXT
   ENDIF

   // --- Labels: the 500 most recent. Above the price for highs, below for lows
   IF nLb > 0 THEN
      FOR j = nLb - 1 DOWNTO max(0, nLb - 500) DO
         lt = $lbT[j]
         lx = $lbX[j]
         IF lt = 1 OR lt = 2 OR lt = 5 OR lt = 6 OR lt = 9 OR lt = 10 OR lt = 13 THEN
            ly = $lbY[j] + 0.5 * $lbA[j]
         ELSE
            ly = $lbY[j] - 0.5 * $lbA[j]
         ENDIF
         IF lt = 1 THEN
            DRAWTEXT("HH", lx, ly, sansserif, bold, 10) COLOURED(bearR, bearG, bearB, 255)
         ELSIF lt = 2 THEN
            DRAWTEXT("LH", lx, ly, sansserif, bold, 10) COLOURED(bearR, bearG, bearB, 255)
         ELSIF lt = 3 THEN
            DRAWTEXT("HL", lx, ly, sansserif, bold, 10) COLOURED(bullR, bullG, bullB, 255)
         ELSIF lt = 4 THEN
            DRAWTEXT("LL", lx, ly, sansserif, bold, 10) COLOURED(bullR, bullG, bullB, 255)
         ELSIF lt = 5 THEN
            DRAWTEXT("Bullish CHoCH", lx, ly, sansserif, bold, 10) COLOURED(bullR, bullG, bullB, 255)
         ELSIF lt = 6 THEN
            DRAWTEXT("Bullish BOS", lx, ly, sansserif, bold, 10) COLOURED(bullR, bullG, bullB, 255)
         ELSIF lt = 7 THEN
            DRAWTEXT("Bearish CHoCH", lx, ly, sansserif, bold, 10) COLOURED(bearR, bearG, bearB, 255)
         ELSIF lt = 8 THEN
            DRAWTEXT("Bearish BOS", lx, ly, sansserif, bold, 10) COLOURED(bearR, bearG, bearB, 255)
         ELSIF lt = 9 THEN
            DRAWTEXT("Int. CHoCH", lx, ly, sansserif, bold, 8) COLOURED(intBullR, intBullG, intBullB, 255)
         ELSIF lt = 10 THEN
            DRAWTEXT("Int. BOS", lx, ly, sansserif, bold, 8) COLOURED(intBullR, intBullG, intBullB, 255)
         ELSIF lt = 11 THEN
            DRAWTEXT("Int. CHoCH", lx, ly, sansserif, bold, 8) COLOURED(intBearR, intBearG, intBearB, 255)
         ELSIF lt = 12 THEN
            DRAWTEXT("Int. BOS", lx, ly, sansserif, bold, 8) COLOURED(intBearR, intBearG, intBearB, 255)
         ELSIF lt = 13 THEN
            DRAWTEXT("EQH", lx, ly, sansserif, bold, 8) COLOURED(eqR, eqG, eqB, 255)
         ELSE
            DRAWTEXT("EQL", lx, ly, sansserif, bold, 8) COLOURED(eqR, eqG, eqB, 255)
         ENDIF
      NEXT
   ENDIF
ENDIF

RETURN lvHi COLOURED(bearR, bearG, bearB, aHi) AS "Swing High Level", lvLo COLOURED(bullR, bullG, bullB, aLo) AS "Swing Low Level"