







Market Microstructure Analytics
Introduction
The bid-ask spread and the depth of the market are two of the most useful pieces of information a trader can have, and two of the hardest to get: they live in the order book, and most charts only show open, high, low, close and volume. Academic finance has spent forty years solving exactly this problem, building estimators that recover the spread and the cost of trading from ordinary price bars.
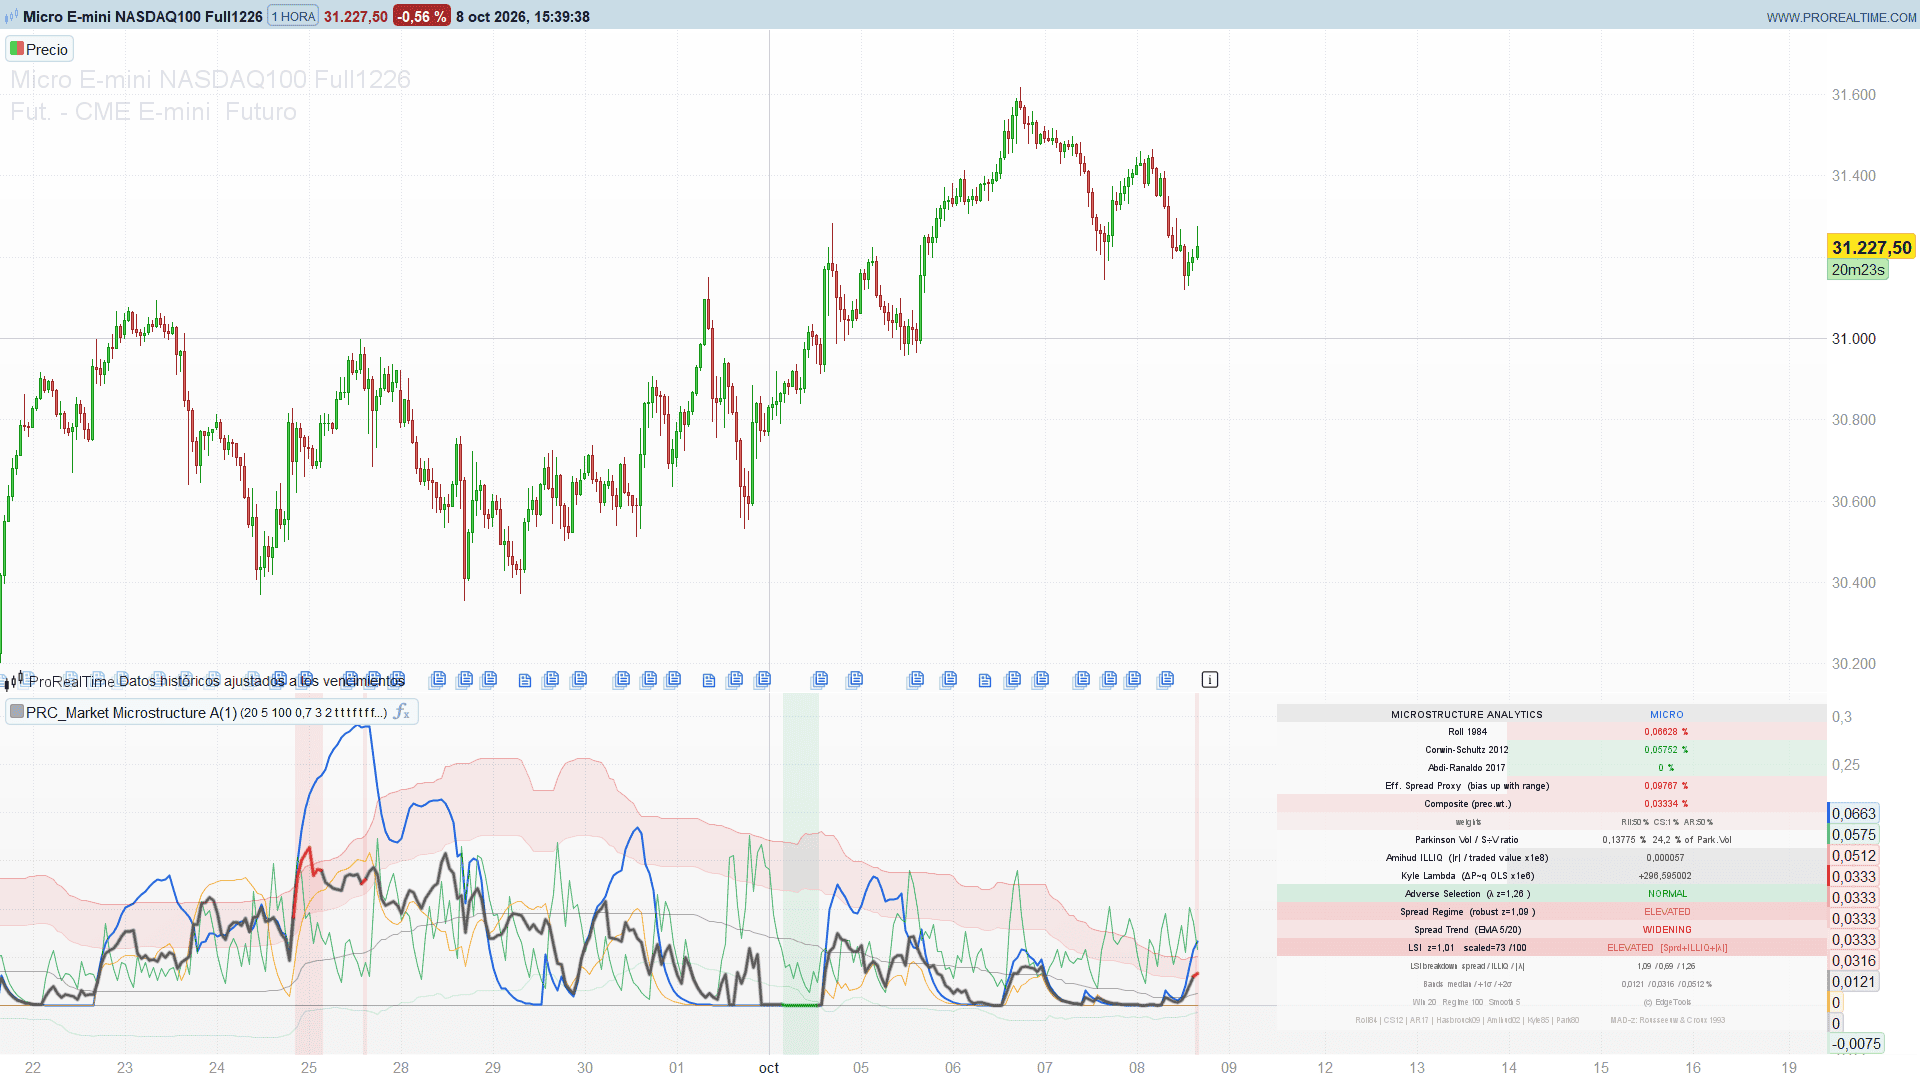
Market Microstructure Analytics, by EdgeTools, puts the best known of those models in a single panel. It estimates the spread with three independent methods, measures illiquidity and price impact, combines everything into a precision-weighted composite spread and a Liquidity Stress Index, and summarises the state of the market in a dashboard. All outputs are statistical approximations built from bar data: there is no order book behind them.
Theory Behind the Indicator
Layer 1: spread estimators
- Roll (1984). When trades bounce between the bid and the ask, consecutive price changes are negatively correlated. The spread is recovered from that negative covariance: S = 2 x sqrt(-Cov(dP, dP[1])).
- Corwin-Schultz (2012). The high of a bar is usually a buy at the ask and the low a sell at the bid, so the high-low range contains both volatility and spread. Comparing the range of one bar with the range of two bars separates the two components.
- Abdi-Ranaldo (2017). Compares the close of one bar with the geometric midpoint, (log high + log low) / 2, of that bar and of the next one: s² = 4 x E[(c(t) – eta(t)) x (c(t) – eta(t+1))]. The indicator evaluates it on the previous bar and the current one, so it never looks ahead. Pairs where either bar has high = low are left out. It follows the formula published in the paper, and in a simulation with a known spread it recovers the true value.
- Effective spread proxy. The textbook effective spread, 2 x d x (P – M) / P, with the bar midpoint (H + L) / 2 standing in for the quote midpoint and the tick rule for the trade direction (the author cites Hasbrouck 2009). Without real quotes it mostly reflects where the bar closes in the direction of the move, so it is off by default and only useful as a relative reading.
- High-low range, as a reference only: it mixes variance and spread and is not used in the composite.
Layer 2: liquidity metrics
- Amihud illiquidity (2002): absolute return per unit of traded value. A market where a small amount of money moves the price a lot is illiquid.
- Kyle’s lambda (1985): the slope of a regression of price changes on signed volume, where the sign comes from the tick rule. In the model it measures price impact. On bars, the tick rule gives each bar the sign of its own price change, so price change times signed volume is never negative: the estimate mostly tracks how the size of the moves and the volume rise together. Read it as a price-impact gauge, not as a direct measure of informed trading.
- Parkinson volatility (1980): a range-based volatility estimator, used to compare the size of the spread with the size of the moves.
Layer 3: derived signals
- Composite spread. The three spread estimators are combined with weights proportional to their precision (the inverse of a robust variance based on the median absolute deviation, MAD). A small regularisation and a maximum weight per estimator stop a single estimator from taking over.
- Robust z-scores. The composite spread, the Amihud measure and the absolute Kyle lambda are normalised as (x – median) / (1.4826 x MAD). Unlike a standard z-score, one extreme bar cannot distort the scale.
- Liquidity Stress Index (LSI). The average of the three robust z-scores, each capped at a configurable level. It is also shown on a 0-100 scale: 50 is neutral, 65-80 is elevated and above 80 is severe.
- Spread / volatility ratio, spread trend (EMA 5 against EMA 20 of the composite) and robust regime bands (median of the composite +1, +2 and -1 robust standard deviations).
Key Features at a Glance
- Three independent spread estimators plus an effective spread proxy and a high-low reference
- Amihud illiquidity, Kyle’s lambda and Parkinson volatility
- Precision-weighted composite spread with regularisation and a weight cap
- Robust (median and MAD) z-scores and a Liquidity Stress Index with four regimes: STRESS, ELEVATED, NORMAL and COMPRESSED
- Robust regime bands around the composite, with the 1 to 2 sigma stress zone filled
- Panel background and composite line coloured by a selectable signal: LSI, spread regime, adverse selection or spread trend
- Glow effect on the composite line and four colour themes, each for light and dark charts
- 18-row dashboard with every estimate, the composite weights, the LSI breakdown and the band levels
How to Read the Indicator
- The composite spread is the main line. When it rises, trading is getting more expensive; when it falls, the market is tightening.
- The regime bands put the composite in context. Above the +1 sigma line the spread is unusually wide for this instrument; inside the shaded zone between +1 and +2 sigma it is in stress territory.
- The background colour follows the selected signal source. With the default LSI source, red marks elevated or stressed liquidity and green a compressed, very liquid market; no colour means normal conditions.
- The dashboard tells you why. The LSI breakdown shows which of the three components (spread, illiquidity or price impact) is driving the stress, and the adverse selection row flags when Kyle’s lambda is unusually high for this instrument (robust z-score above 1.5).
- The spread / volatility ratio above 100% means the spread is larger than the typical move: a thin market where trading costs dominate.
Practical Applications
- Context for execution. A STRESS reading or a WIDENING spread trend says that conditions are rougher than usual for this instrument, which is a reason to prefer limit orders or to split a large order.
- Position sizing. When illiquidity and price impact are elevated, slippage is likely to be higher than usual, so a smaller size keeps the cost under control.
- Relative stress gauge. Because the estimators react strongly to the size of the moves, the LSI also works as a robust measure of how unusual current conditions are compared with the recent past. It says nothing about the direction of the next move.
- Instrument comparison. On daily bars, where these estimators were designed and tested, the composite spread and the Amihud measure help rank instruments by trading cost and liquidity.
Limitations
- The spread estimators were designed and validated on daily data of individual stocks. When the true spread is very small compared with the range of the bar (major indices, main currency pairs, large caps, intraday bars), they mostly pick up volatility rather than the spread (Jahan-Parvar and Zikes, 2023). Read the lines as relative levels, not as the spread you actually pay.
- Roll’s estimator is zero whenever consecutive price changes are positively correlated, which happens often.
- Amihud and Kyle’s lambda need real traded volume. On instruments without it (spot currencies, some CFDs) they have no meaning, and the LSI then mainly reflects the spread component.
- The regime thresholds (1 and 2 for the LSI, 1.5 for adverse selection) are conventions, not calibrated levels.
Indicator Configuration
lookback(default: 20, 5-200): estimation window for the covariances, averages, Amihud and Kyle.smoothN(default: 5, 1-50): EMA smoothing applied to each spread estimate.regimeWin(default: 100, 20-500): window of the robust z-scores and the regime bands.wCap(default: 0.70, 0.34-1): maximum weight of a single estimator in the composite.winsorCap(default: 3.0, 1-6): cap applied to each z-score before building the LSI.lsiThresh(default: 2.0, 0.5-4): LSI level that marks the STRESS regime.showRoll,showCS,showAR,showEff,showComp,showPark,showHL,showBands,showDash(1 = on, 0 = off): lines and dashboard to display. By default the three estimators, the composite, the bands and the dashboard are on.colorSrc(default: 0): signal for the colours. 0 = LSI, 1 = spread regime, 2 = adverse selection, 3 = spread trend.bgColoring(default: 1) andglowOn(default: 1): background colouring and glow effect.themeSel(default: 1): colour theme. 0 = Gold, 1 = EdgeTools, 2 = Quant, 3 = Ocean.darkMode(default: 0): set to 1 on a dark chart background.dashX,dashY,dashCol: position of the dashboard in pixels from the top-right corner and distance between its two columns.
Apply the indicator in its own panel below the price chart. The estimators need some history: with the default settings, allow a few hundred bars before reading the z-scores and the bands.
Code
//---------------------------------------------------------------
// PRC_Market Microstructure Analytics
// version = 0
// 29.09.2026
// Iván González @ www.prorealcode.com
// Author: EdgeTools
// Sharing ProRealTime knowledge
//--------------------------------------------------------------------//
// Apply it in its own panel (not on the price).
// Spread and liquidity estimates from OHLCV bars: statistical approximations,
// there is no order book behind them.
DEFPARAM DRAWONLASTBARONLY = true

//----- Parameters
lookback = 20          // estimation window (5-200): covariance, SMA, Amihud and Kyle
smoothN = 5            // EMA smoothing of each spread estimate (1-50)
regimeWin = 100        // window of the robust z-scores and regime bands (20-500)
wCap = 0.70            // max weight of a single estimator in the composite (0.34-1)
winsorCap = 3.0        // cap of each z-score before building the LSI (1-6)
lsiThresh = 2.0        // LSI threshold for the STRESS regime (0.5-4)

//----- Display
showRoll = 1           // Roll (1984)
showCS = 1             // Corwin-Schultz (2012)
showAR = 1             // Abdi-Ranaldo (2017)
showEff = 0            // effective spread proxy
showComp = 1           // composite spread
showPark = 0           // Parkinson volatility
showHL = 0             // HL range (reference)
showBands = 1          // robust regime bands
showDash = 1           // dashboard
colorSrc = 0           // 0 = LSI, 1 = Spread Regime, 2 = Adverse Selection, 3 = Spread Trend
bgColoring = 1         // background colouring of the panel
glowOn = 1             // glow effect on the composite line
themeSel = 1           // 0 = Gold, 1 = EdgeTools, 2 = Quant, 3 = Ocean
darkMode = 0           // 1 = dark chart background, 0 = light
dashX = -560           // dashboard: x of the label column, pixels from the right edge
dashCol = 310          // dashboard: distance to the value column
dashY = -20            // dashboard: y of the first row, pixels from the top

lookback = max(5, round(lookback))
smoothN = max(1, round(smoothN))
regimeWin = max(20, round(regimeWin))

//----- Colour theme
IF themeSel = 0 THEN
   IF darkMode = 1 THEN
      priR = 255
      priG = 215
      priB = 0
      bullR = 255
      bullG = 165
      bullB = 0
      bearR = 255
      bearG = 82
      bearB = 82
      neuR = 192
      neuG = 192
      neuB = 192
      txtR = 255
      txtG = 255
      txtB = 255
      tbgR = 26
      tbgG = 26
      tbgB = 0
      hbgR = 45
      hbgG = 38
      hbgB = 0
   ELSE
      priR = 218
      priG = 165
      priB = 32
      bullR = 255
      bullG = 140
      bullB = 0
      bearR = 211
      bearG = 47
      bearB = 47
      neuR = 128
      neuG = 128
      neuB = 128
      txtR = 0
      txtG = 0
      txtB = 0
      tbgR = 255
      tbgG = 254
      tbgB = 240
      hbgR = 245
      hbgG = 245
      hbgB = 220
   ENDIF
ELSIF themeSel = 2 THEN
   priR = 128
   priG = 128
   priB = 128
   bullR = 255
   bullG = 165
   bullB = 0
   bearR = 139
   bearG = 0
   bearB = 0
   neuR = 70
   neuG = 130
   neuB = 180
   IF darkMode = 1 THEN
      txtR = 255
      txtG = 255
      txtB = 255
      tbgR = 13
      tbgG = 13
      tbgB = 13
      hbgR = 26
      hbgG = 26
      hbgB = 26
   ELSE
      txtR = 0
      txtG = 0
      txtB = 0
      tbgR = 250
      tbgG = 250
      tbgB = 250
      hbgR = 240
      hbgG = 240
      hbgB = 240
   ENDIF
ELSIF themeSel = 3 THEN
   IF darkMode = 1 THEN
      priR = 32
      priG = 178
      priB = 170
      bullR = 0
      bullG = 206
      bullB = 209
      bearR = 255
      bearG = 69
      bearB = 0
      neuR = 135
      neuG = 206
      neuB = 235
      txtR = 240
      txtG = 248
      txtB = 255
      tbgR = 0
      tbgG = 26
      tbgB = 46
      hbgR = 0
      hbgG = 42
      hbgB = 71
   ELSE
      priR = 0
      priG = 139
      priB = 139
      bullR = 70
      bullG = 130
      bullB = 180
      bearR = 178
      bearG = 34
      bearB = 34
      neuR = 47
      neuG = 79
      neuB = 79
      txtR = 25
      txtG = 25
      txtB = 112
      tbgR = 230
      tbgG = 247
      tbgB = 255
      hbgR = 204
      hbgG = 242
      hbgB = 255
   ENDIF
ELSE
   IF darkMode = 1 THEN
      priR = 59
      priG = 130
      priB = 246
      bullR = 34
      bullG = 197
      bullB = 94
      bearR = 239
      bearG = 68
      bearB = 68
      neuR = 115
      neuG = 115
      neuB = 115
      txtR = 250
      txtG = 250
      txtB = 250
      tbgR = 23
      tbgG = 23
      tbgB = 23
      hbgR = 38
      hbgG = 38
      hbgB = 38
   ELSE
      priR = 37
      priG = 99
      priB = 235
      bullR = 22
      bullG = 163
      bullB = 74
      bearR = 220
      bearG = 38
      bearB = 38
      neuR = 82
      neuG = 82
      neuB = 82
      txtR = 10
      txtG = 10
      txtB = 10
      tbgR = 249
      tbgG = 249
      tbgB = 249
      hbgR = 229
      hbgG = 229
      hbgB = 229
   ENDIF
ENDIF
// dashboard background transparency: 80% on dark charts, 15% on light ones
IF darkMode = 1 THEN
   tbgA = 51
ELSE
   tbgA = 217
ENDIF

//----- Base series
// price change (not log-returns): Roll is specified in price-change units
dp = 0
IF barindex >= 1 THEN
   IF close[1] > 0 THEN
      dp = close - close[1]
   ENDIF
ENDIF
dpLag = 0
IF barindex >= 1 THEN
   dpLag = dp[1]
ENDIF
rLog = 0
IF barindex >= 1 THEN
   IF close > 0 AND close[1] > 0 THEN
      rLog = log(close / close[1])
   ENDIF
ENDIF
midPrice = (high + low) / 2
hlValid = 0
IF barindex >= 1 THEN
   IF high > 0 AND low > 0 AND high > low AND high[1] > 0 AND low[1] > 0 AND high[1] > low[1] THEN
      hlValid = 1
   ENDIF
ENDIF
// tick rule: +1 if the close rises, -1 if it falls, carried forward if unchanged
once tickDir = 1
IF barindex >= 1 THEN
   IF close > close[1] THEN
      tickDir = 1
   ELSIF close < close[1] THEN
      tickDir = -1
   ENDIF
ENDIF
// signed volume for Kyle lambda (not normalised)
qFlow = tickDir * volume

aSm = 2 / (smoothN + 1)
warmL = lookback - 1

//----- Layer 1: spread estimators
// Roll (1984): S = 2 * sqrt(max(0, -Cov(dP, dP[1])))
covRoll = average[lookback](dp * dpLag) - average[lookback](dp) * average[lookback](dpLag)
rollPct = 0
IF barindex >= warmL AND close > 0 THEN
   rollPct = 2 * sqrt(max(0, 0 - covRoll)) / close * 100
ENDIF
IF barindex = warmL THEN
   spreadRoll = rollPct
ELSIF barindex > warmL THEN
   spreadRoll = aSm * rollPct + (1 - aSm) * spreadRoll[1]
ENDIF

// Corwin-Schultz (2012): two-period high-low decomposition
csK = 3 - 2 * sqrt(2)
csInst = 0
csActive = 0
IF hlValid = 1 THEN
   lnHL0 = log(high / low)
   lnHL1 = log(high[1] / low[1])
   betaCS = lnHL0 * lnHL0 + lnHL1 * lnHL1
   lnHL2 = log(max(high, high[1]) / min(low, low[1]))
   gammaCS = lnHL2 * lnHL2
   alphaCS = max(0, (sqrt(2 * betaCS) - sqrt(betaCS)) / csK - sqrt(gammaCS / csK))
   csInst = 2 * (exp(alphaCS) - 1) / (1 + exp(alphaCS)) * 100
   csActive = 1
ENDIF
IF barindex = 0 THEN
   spreadCS = csInst
ELSE
   spreadCS = aSm * csInst + (1 - aSm) * spreadCS[1]
ENDIF

// Abdi-Ranaldo (2017), as published: s^2 = 4 * E[(c(t) - eta(t)) * (c(t) - eta(t+1))]
// c = log close, eta = (log high + log low) / 2. Computed on the previous bar and the
// current one, so nothing looks ahead.
// pairs with high = low in either bar are left out (validity-weighted mean)
arPair = 0
arProd = 0
IF hlValid = 1 THEN
   arPair = 1
   arEtaPrev = (log(high[1]) + log(low[1])) / 2
   arEtaNow = (log(high) + log(low)) / 2
   arProd = (log(close[1]) - arEtaPrev) * (log(close[1]) - arEtaNow)
ENDIF
arN = summation[lookback](arPair)
arProdSum = summation[lookback](arProd)
arMinValid = max(3, ceil(lookback * 0.5))
arSuff = 0
IF barindex >= warmL THEN
   IF arN >= arMinValid THEN
      arSuff = 1
   ENDIF
ENDIF
arRaw = 0
IF arSuff = 1 THEN
   arRaw = 2 * sqrt(max(0, arProdSum / arN)) * 100
ENDIF
IF barindex = 0 THEN
   spreadAR = arRaw
ELSE
   spreadAR = aSm * arRaw + (1 - aSm) * spreadAR[1]
ENDIF
arActive = 0
IF hlValid = 1 AND arSuff = 1 THEN
   arActive = 1
ENDIF

// Effective spread proxy (Hasbrouck 2009): 2*d*(P-M)/P, biased upwards
effBar = 0
IF close > 0 AND high > low THEN
   effBar = 2 * tickDir * (close - midPrice) / close * 100
ENDIF
effSpread = average[lookback](effBar)

// HL range, reference only (variance + spread together)
hlRaw = 0
IF midPrice > 0 AND high > low THEN
   hlRaw = (high - low) / midPrice * 100
ENDIF
IF barindex = 0 THEN
   spreadHL = hlRaw
ELSE
   spreadHL = aSm * hlRaw + (1 - aSm) * spreadHL[1]
ENDIF

//----- Layer 2: liquidity metrics
// Amihud (2002): |r| per unit of traded value, x1e8
dollarVol = close * volume
amihudInst = 0
IF dollarVol > 0 THEN
   amihudInst = abs(rLog) / dollarVol
ENDIF
amihudSma = average[lookback](amihudInst) * 100000000

// Kyle lambda (1985): OLS price impact on signed volume, x1e6
covKL = average[lookback](dp * qFlow) - average[lookback](dp) * average[lookback](qFlow)
varKL = average[lookback](qFlow * qFlow) - average[lookback](qFlow) * average[lookback](qFlow)
klRaw = 0
IF barindex >= warmL THEN
   IF varKL > 0.00000000000000000001 THEN
      klRaw = covKL / varKL
   ENDIF
ENDIF
IF barindex = 0 THEN
   kyleLambda = klRaw * 1000000
ELSE
   kyleLambda = aSm * klRaw * 1000000 + (1 - aSm) * kyleLambda[1]
ENDIF

// Parkinson (1980): range-based variance
parkK = 1 / (4 * log(2))
parkInst = 0
IF hlValid = 1 THEN
   parkInst = parkK * log(high / low) * log(high / low)
ENDIF
parkVar = average[lookback](parkInst)
parkVol = sqrt(max(0, parkVar)) * 100

//----- Rolling medians and MADs (nearest rank), window = lookback
// k-th smallest value by selection on a scratch array rebuilt on every tick
// tasks 1-3: medians of Roll, Corwin-Schultz, Abdi-Ranaldo; tasks 4-6: their MADs
kSel = ceil(lookback / 2) - 1
FOR kq = 1 TO 6 DO
   // first bar with a full window of valid values (the MADs need one window more)
   nWin = 1
   IF kq >= 4 THEN
      nWin = 2
   ENDIF
   IF kq = 1 OR kq = 4 THEN
      vFrom = warmL + (lookback - 1) * nWin
   ELSE
      vFrom = (lookback - 1) * nWin
   ENDIF
   IF barindex >= vFrom THEN
      FOR jq = 0 TO lookback - 1 DO
         IF kq = 1 THEN
            $wq[jq] = rollPct[jq]
         ELSIF kq = 2 THEN
            $wq[jq] = csInst[jq]
         ELSIF kq = 3 THEN
            $wq[jq] = arRaw[jq]
         ELSIF kq = 4 THEN
            IF jq = 0 THEN
               $wq[jq] = abs(rollPct - medRoll)
            ELSE
               $wq[jq] = devRoll[jq]
            ENDIF
         ELSIF kq = 5 THEN
            IF jq = 0 THEN
               $wq[jq] = abs(csInst - medCS)
            ELSE
               $wq[jq] = devCS[jq]
            ENDIF
         ELSE
            IF jq = 0 THEN
               $wq[jq] = abs(arRaw - medAR)
            ELSE
               $wq[jq] = devAR[jq]
            ENDIF
         ENDIF
      NEXT
      // Wirth's selection: leaves the k-th smallest at position kSel
      loQ = 0
      hiQ = lookback - 1
      WHILE loQ < hiQ DO
         pvQ = $wq[kSel]
         iQ = loQ
         jQ2 = hiQ
         WHILE iQ <= jQ2 DO
            WHILE $wq[iQ] < pvQ DO
               iQ = iQ + 1
            WEND
            WHILE pvQ < $wq[jQ2] DO
               jQ2 = jQ2 - 1
            WEND
            IF iQ <= jQ2 THEN
               tmpQ = $wq[iQ]
               $wq[iQ] = $wq[jQ2]
               $wq[jQ2] = tmpQ
               iQ = iQ + 1
               jQ2 = jQ2 - 1
            ENDIF
         WEND
         IF jQ2 < kSel THEN
            loQ = iQ
         ENDIF
         IF kSel < iQ THEN
            hiQ = jQ2
         ENDIF
      WEND
      resQ = $wq[kSel]
      IF kq = 1 THEN
         medRoll = resQ
      ELSIF kq = 2 THEN
         medCS = resQ
      ELSIF kq = 3 THEN
         medAR = resQ
      ELSIF kq = 4 THEN
         madRoll = resQ
      ELSIF kq = 5 THEN
         madCS = resQ
      ELSE
         madAR = resQ
      ENDIF
   ENDIF
NEXT
devRoll = abs(rollPct - medRoll)
devCS = abs(csInst - medCS)
devAR = abs(arRaw - medAR)
madOk = barindex >= warmL + 2 * (lookback - 1)

//----- Layer 3: composite spread, precision-weighted (inverse robust variance)
nComps = 1 + csActive + arActive
eqW = 1 / nComps
wRollU = eqW
wCSU = csActive * eqW
wARU = arActive * eqW
IF madOk THEN
   varRoll = (1.4826 * madRoll) * (1.4826 * madRoll)
   varCS = (1.4826 * madCS) * (1.4826 * madCS)
   varAR = (1.4826 * madAR) * (1.4826 * madAR)
   varSum = varRoll + csActive * varCS + arActive * varAR
   // ridge regularisation: 5% of the mean robust variance of the active estimators
   regEps = 0.0000000001
   IF varSum > 0 THEN
      regEps = 0.05 * varSum / nComps
   ENDIF
   ivR = 1 / (varRoll + regEps)
   ivC = 0
   IF csActive = 1 THEN
      ivC = 1 / (varCS + regEps)
   ENDIF
   ivA = 0
   IF arActive = 1 THEN
      ivA = 1 / (varAR + regEps)
   ENDIF
   ivSum = ivR + ivC + ivA
   IF ivSum > 0 THEN
      wRollU = ivR / ivSum
      wCSU = ivC / ivSum
      wARU = ivA / ivSum
   ENDIF
ENDIF
wRollC = min(wRollU, wCap)
wCSC = min(wCSU, wCap)
wARC = min(wARU, wCap)
wCapSum = wRollC + wCSC + wARC
IF wCapSum > 0 THEN
   wRollF = wRollC / wCapSum
   wCSF = wCSC / wCapSum
   wARF = wARC / wCapSum
ELSE
   wRollF = eqW
   wCSF = csActive * eqW
   wARF = arActive * eqW
ENDIF
compOk = barindex >= warmL
spreadComp = 0
IF compOk THEN
   spreadComp = wRollF * spreadRoll + wCSF * spreadCS + wARF * spreadAR
ENDIF
wRollP = round(wRollF * 100)
wCSP = round(wCSF * 100)
wARP = round(wARF * 100)

kyleAbs = abs(kyleLambda)

//----- Robust z-scores: (x - median) / (1.4826 * MAD), window = regimeWin
// tasks 1-3: medians of composite spread, Amihud, |Kyle lambda|; tasks 4-6: their MADs
kSelR = ceil(regimeWin / 2) - 1
FOR kr = 1 TO 6 DO
   nWinR = 1
   IF kr >= 4 THEN
      nWinR = 2
   ENDIF
   IF kr = 3 OR kr = 6 THEN
      vFromR = (regimeWin - 1) * nWinR
   ELSE
      vFromR = warmL + (regimeWin - 1) * nWinR
   ENDIF
   IF barindex >= vFromR THEN
      FOR jr = 0 TO regimeWin - 1 DO
         IF kr = 1 THEN
            $wr[jr] = spreadComp[jr]
         ELSIF kr = 2 THEN
            $wr[jr] = amihudSma[jr]
         ELSIF kr = 3 THEN
            $wr[jr] = kyleAbs[jr]
         ELSIF kr = 4 THEN
            IF jr = 0 THEN
               $wr[jr] = abs(spreadComp - medSp)
            ELSE
               $wr[jr] = devSp[jr]
            ENDIF
         ELSIF kr = 5 THEN
            IF jr = 0 THEN
               $wr[jr] = abs(amihudSma - medAh)
            ELSE
               $wr[jr] = devAh[jr]
            ENDIF
         ELSE
            IF jr = 0 THEN
               $wr[jr] = abs(kyleAbs - medKl)
            ELSE
               $wr[jr] = devKl[jr]
            ENDIF
         ENDIF
      NEXT
      loR = 0
      hiR = regimeWin - 1
      WHILE loR < hiR DO
         pvR = $wr[kSelR]
         iR = loR
         jR2 = hiR
         WHILE iR <= jR2 DO
            WHILE $wr[iR] < pvR DO
               iR = iR + 1
            WEND
            WHILE pvR < $wr[jR2] DO
               jR2 = jR2 - 1
            WEND
            IF iR <= jR2 THEN
               tmpR = $wr[iR]
               $wr[iR] = $wr[jR2]
               $wr[jR2] = tmpR
               iR = iR + 1
               jR2 = jR2 - 1
            ENDIF
         WEND
         IF jR2 < kSelR THEN
            loR = iR
         ENDIF
         IF kSelR < iR THEN
            hiR = jR2
         ENDIF
      WEND
      resR = $wr[kSelR]
      IF kr = 1 THEN
         medSp = resR
      ELSIF kr = 2 THEN
         medAh = resR
      ELSIF kr = 3 THEN
         medKl = resR
      ELSIF kr = 4 THEN
         madSp = resR
      ELSIF kr = 5 THEN
         madAh = resR
      ELSE
         madKl = resR
      ENDIF
   ENDIF
NEXT
devSp = abs(spreadComp - medSp)
devAh = abs(amihudSma - medAh)
devKl = abs(kyleAbs - medKl)
medSpOk = barindex >= warmL + regimeWin - 1
madSpOk = barindex >= warmL + 2 * (regimeWin - 1)
madKlOk = barindex >= 2 * (regimeWin - 1)

spreadRz = 0
IF madSpOk THEN
   IF madSp > 0.0000000001 THEN
      spreadRz = (spreadComp - medSp) / (1.4826 * madSp)
   ENDIF
ENDIF
amihudRz = 0
IF madSpOk THEN
   IF madAh > 0.0000000001 THEN
      amihudRz = (amihudSma - medAh) / (1.4826 * madAh)
   ENDIF
ENDIF
kyleRz = 0
IF madKlOk THEN
   IF madKl > 0.0000000001 THEN
      kyleRz = (kyleAbs - medKl) / (1.4826 * madKl)
   ENDIF
ENDIF

//----- Liquidity Stress Index: equal-weight mean of the winsorised z-scores
spreadRzW = max(0 - winsorCap, min(winsorCap, spreadRz))
amihudRzW = max(0 - winsorCap, min(winsorCap, amihudRz))
kyleRzW = max(0 - winsorCap, min(winsorCap, kyleRz))
lsi = (spreadRzW + amihudRzW + kyleRzW) / 3
// scaled to 0-100 with tanh(lsi/2): neutral 50, elevated 65-80, severe above 80
lsiE2x = exp(max(0 - 40, min(40, lsi)))
lsiScaled = 50 * (1 + (lsiE2x - 1) / (lsiE2x + 1))

// spread / volatility ratio: above 1 = spread-dominated, thin market
svOk = 0
IF barindex >= warmL THEN
   IF parkVol > 0.001 THEN
      svOk = 1
      svRatio = spreadComp / parkVol
   ENDIF
ENDIF

// spread trend: EMA 5 vs EMA 20 of the composite
IF barindex = warmL THEN
   sFast = spreadComp
   sSlow = spreadComp
ELSIF barindex > warmL THEN
   sFast = (2 / 6) * spreadComp + (1 - 2 / 6) * sFast[1]
   sSlow = (2 / 21) * spreadComp + (1 - 2 / 21) * sSlow[1]
ENDIF
spreadWide = 0
IF barindex >= warmL THEN
   IF sFast > sSlow THEN
      spreadWide = 1
   ENDIF
ENDIF

//----- Regime classification (LSI): 3 = stress, 2 = elevated, 1 = compressed, 0 = normal
IF lsi >= lsiThresh THEN
   regimeSt = 3
ELSIF lsi >= 1 THEN
   regimeSt = 2
ELSIF lsi <= -1 THEN
   regimeSt = 1
ELSE
   regimeSt = 0
ENDIF
IF regimeSt = 3 THEN
   rgR = bearR
   rgG = bearG
   rgB = bearB
   rgA = 255
ELSIF regimeSt = 2 THEN
   rgR = bearR
   rgG = bearG
   rgB = bearB
   rgA = 153
ELSIF regimeSt = 1 THEN
   rgR = bullR
   rgG = bullG
   rgB = bullB
   rgA = 255
ELSE
   rgR = neuR
   rgG = neuG
   rgB = neuB
   rgA = 255
ENDIF

// adverse selection: Kyle lambda z-score above 1.5
asElevated = kyleRz > 1.5

//----- Signal colour: drives the background and the composite line
sigNeut = 0
IF colorSrc = 1 THEN
   IF spreadRz >= 1 THEN
      sgR = bearR
      sgG = bearG
      sgB = bearB
   ELSIF spreadRz <= -1 THEN
      sgR = bullR
      sgG = bullG
      sgB = bullB
   ELSE
      sgR = neuR
      sgG = neuG
      sgB = neuB
      sigNeut = 1
   ENDIF
ELSIF colorSrc = 2 THEN
   IF kyleRz > 1.5 THEN
      sgR = bearR
      sgG = bearG
      sgB = bearB
   ELSE
      sgR = neuR
      sgG = neuG
      sgB = neuB
      sigNeut = 1
   ENDIF
ELSIF colorSrc = 3 THEN
   IF spreadWide = 1 THEN
      sgR = bearR
      sgG = bearG
      sgB = bearB
   ELSE
      sgR = bullR
      sgG = bullG
      sgB = bullB
   ENDIF
ELSE
   sgR = rgR
   sgG = rgG
   sgB = rgB
   IF regimeSt = 0 THEN
      sigNeut = 1
   ENDIF
ENDIF

IF bgColoring = 1 AND sigNeut = 0 THEN
   BACKGROUNDCOLOR(sgR, sgG, sgB, 23)
ENDIF

//----- Plotted series (hidden ones are undefined for the whole chart)
pRoll = undefined
IF showRoll = 1 AND barindex >= warmL THEN
   pRoll = spreadRoll
ENDIF
pCS = undefined
IF showCS = 1 THEN
   pCS = spreadCS
ENDIF
pAR = undefined
IF showAR = 1 THEN
   pAR = spreadAR
ENDIF
pEff = undefined
IF showEff = 1 AND barindex >= warmL THEN
   pEff = effSpread
ENDIF
pComp = undefined
IF showComp = 1 AND compOk THEN
   pComp = spreadComp
ENDIF
pGlow = undefined
IF glowOn = 1 AND showComp = 1 AND compOk THEN
   pGlow = spreadComp
ENDIF
pPark = undefined
IF showPark = 1 AND barindex >= warmL THEN
   pPark = parkVol
ENDIF
pHL = undefined
IF showHL = 1 THEN
   pHL = spreadHL
ENDIF
// robust regime bands: median +/- multiples of 1.4826 * MAD of the composite
pMed = undefined
pUp2 = undefined
pUp1 = undefined
pDn1 = undefined
fillA = 0
IF showBands = 1 AND madSpOk THEN
   bandSigma = 1.4826 * madSp
   pMed = medSp
   pUp2 = medSp + 2 * bandSigma
   pUp1 = medSp + bandSigma
   pDn1 = medSp - bandSigma
   fillA = 20
ENDIF
COLORBETWEEN(pUp2, pUp1, bearR, bearG, bearB, fillA)

//----- Dashboard
IF showDash = 1 AND islastbarupdate THEN
   vX = dashX + dashCol
   rowH = 18
   DRAWRECTANGLE(dashX - 190, dashY + 11, vX + 160, dashY - 17 * rowH - 11) ANCHOR(TOPRIGHT, XSHIFT, YSHIFT) COLOURED(tbgR, tbgG, tbgB, 0) FILLCOLOR(tbgR, tbgG, tbgB, tbgA)
   DRAWRECTANGLE(dashX - 190, dashY + 9, vX + 160, dashY - 9) ANCHOR(TOPRIGHT, XSHIFT, YSHIFT) COLOURED(hbgR, hbgG, hbgB, 0) FILLCOLOR(hbgR, hbgG, hbgB, 204)
   DRAWTEXT("MICROSTRUCTURE ANALYTICS", dashX, dashY, SansSerif, Bold, 10) ANCHOR(TOPRIGHT, XSHIFT, YSHIFT) COLOURED(txtR, txtG, txtB, 255)
   DRAWTEXT("MICRO", vX, dashY, SansSerif, Bold, 10) ANCHOR(TOPRIGHT, XSHIFT, YSHIFT) COLOURED(priR, priG, priB, 255)

   // row 1: Roll
   yRow = dashY - rowH
   IF spreadRz > 0 THEN
      cR = bearR
      cG = bearG
      cB = bearB
   ELSE
      cR = bullR
      cG = bullG
      cB = bullB
   ENDIF
   rollTxt = round(spreadRoll * 100000) / 100000
   DRAWRECTANGLE(vX - 160, yRow + 9, vX + 160, yRow - 9) ANCHOR(TOPRIGHT, XSHIFT, YSHIFT) COLOURED(cR, cG, cB, 0) FILLCOLOR(cR, cG, cB, 26)
   DRAWTEXT("Roll 1984", dashX, yRow, SansSerif, Standard, 9) ANCHOR(TOPRIGHT, XSHIFT, YSHIFT) COLOURED(txtR, txtG, txtB, 255)
   DRAWTEXT("#rollTxt#%", vX, yRow, SansSerif, Standard, 9) ANCHOR(TOPRIGHT, XSHIFT, YSHIFT) COLOURED(cR, cG, cB, 255)

   // row 2: Corwin-Schultz
   yRow = dashY - 2 * rowH
   IF csActive = 1 AND spreadCS > spreadRoll THEN
      cR = bearR
      cG = bearG
      cB = bearB
   ELSE
      cR = bullR
      cG = bullG
      cB = bullB
   ENDIF
   DRAWRECTANGLE(vX - 160, yRow + 9, vX + 160, yRow - 9) ANCHOR(TOPRIGHT, XSHIFT, YSHIFT) COLOURED(cR, cG, cB, 0) FILLCOLOR(cR, cG, cB, 26)
   DRAWTEXT("Corwin-Schultz 2012", dashX, yRow, SansSerif, Standard, 9) ANCHOR(TOPRIGHT, XSHIFT, YSHIFT) COLOURED(txtR, txtG, txtB, 255)
   IF csActive = 1 THEN
      csTxt = round(spreadCS * 100000) / 100000
      DRAWTEXT("#csTxt#%", vX, yRow, SansSerif, Standard, 9) ANCHOR(TOPRIGHT, XSHIFT, YSHIFT) COLOURED(cR, cG, cB, 255)
   ELSE
      DRAWTEXT("N/A  (H = L)", vX, yRow, SansSerif, Standard, 9) ANCHOR(TOPRIGHT, XSHIFT, YSHIFT) COLOURED(cR, cG, cB, 255)
   ENDIF

   // row 3: Abdi-Ranaldo
   yRow = dashY - 3 * rowH
   IF arActive = 1 AND spreadAR > spreadRoll THEN
      cR = bearR
      cG = bearG
      cB = bearB
   ELSE
      cR = bullR
      cG = bullG
      cB = bullB
   ENDIF
   DRAWRECTANGLE(vX - 160, yRow + 9, vX + 160, yRow - 9) ANCHOR(TOPRIGHT, XSHIFT, YSHIFT) COLOURED(cR, cG, cB, 0) FILLCOLOR(cR, cG, cB, 26)
   DRAWTEXT("Abdi-Ranaldo 2017", dashX, yRow, SansSerif, Standard, 9) ANCHOR(TOPRIGHT, XSHIFT, YSHIFT) COLOURED(txtR, txtG, txtB, 255)
   IF arActive = 1 THEN
      arTxt = round(spreadAR * 100000) / 100000
      DRAWTEXT("#arTxt#%", vX, yRow, SansSerif, Standard, 9) ANCHOR(TOPRIGHT, XSHIFT, YSHIFT) COLOURED(cR, cG, cB, 255)
   ELSE
      DRAWTEXT("N/A  (H = L)", vX, yRow, SansSerif, Standard, 9) ANCHOR(TOPRIGHT, XSHIFT, YSHIFT) COLOURED(cR, cG, cB, 255)
   ENDIF

   // row 4: effective spread proxy
   yRow = dashY - 4 * rowH
   IF medSpOk AND effSpread > medSp THEN
      cR = bearR
      cG = bearG
      cB = bearB
   ELSE
      cR = bullR
      cG = bullG
      cB = bullB
   ENDIF
   effTxt = round(effSpread * 100000) / 100000
   DRAWRECTANGLE(vX - 160, yRow + 9, vX + 160, yRow - 9) ANCHOR(TOPRIGHT, XSHIFT, YSHIFT) COLOURED(cR, cG, cB, 0) FILLCOLOR(cR, cG, cB, 26)
   DRAWTEXT("Eff. Spread Proxy  (bias up with range)", dashX, yRow, SansSerif, Standard, 9) ANCHOR(TOPRIGHT, XSHIFT, YSHIFT) COLOURED(txtR, txtG, txtB, 255)
   DRAWTEXT("#effTxt#%", vX, yRow, SansSerif, Standard, 9) ANCHOR(TOPRIGHT, XSHIFT, YSHIFT) COLOURED(cR, cG, cB, 255)

   // rows 5-6: composite and its weights
   yRow = dashY - 5 * rowH
   IF spreadRz > 1 THEN
      cR = bearR
      cG = bearG
      cB = bearB
   ELSIF spreadRz < -1 THEN
      cR = bullR
      cG = bullG
      cB = bullB
   ELSE
      cR = neuR
      cG = neuG
      cB = neuB
   ENDIF
   compTxt = round(spreadComp * 100000) / 100000
   DRAWRECTANGLE(dashX - 190, yRow + 9, vX + 160, yRow - 9) ANCHOR(TOPRIGHT, XSHIFT, YSHIFT) COLOURED(cR, cG, cB, 0) FILLCOLOR(cR, cG, cB, 26)
   DRAWTEXT("Composite (prec.wt.)", dashX, yRow, SansSerif, Standard, 9) ANCHOR(TOPRIGHT, XSHIFT, YSHIFT) COLOURED(txtR, txtG, txtB, 255)
   DRAWTEXT("#compTxt#%", vX, yRow, SansSerif, Standard, 9) ANCHOR(TOPRIGHT, XSHIFT, YSHIFT) COLOURED(cR, cG, cB, 255)
   yRow = dashY - 6 * rowH
   DRAWRECTANGLE(dashX - 190, yRow + 9, vX + 160, yRow - 9) ANCHOR(TOPRIGHT, XSHIFT, YSHIFT) COLOURED(cR, cG, cB, 0) FILLCOLOR(cR, cG, cB, 13)
   DRAWTEXT("  weights", dashX, yRow, SansSerif, Standard, 8) ANCHOR(TOPRIGHT, XSHIFT, YSHIFT) COLOURED(neuR, neuG, neuB, 204)
   DRAWTEXT("Rll:#wRollP#%  CS:#wCSP#%  AR:#wARP#%", vX, yRow, SansSerif, Standard, 8) ANCHOR(TOPRIGHT, XSHIFT, YSHIFT) COLOURED(neuR, neuG, neuB, 204)

   // row 7: Parkinson volatility and spread / volatility ratio
   yRow = dashY - 7 * rowH
   parkTxt = round(parkVol * 100000) / 100000
   DRAWTEXT("Parkinson Vol / S÷V ratio", dashX, yRow, SansSerif, Standard, 9) ANCHOR(TOPRIGHT, XSHIFT, YSHIFT) COLOURED(txtR, txtG, txtB, 255)
   IF svOk = 1 THEN
      svTxt = round(svRatio * 1000) / 10
      DRAWTEXT("#parkTxt#%  #svTxt#% of Park.Vol", vX, yRow, SansSerif, Standard, 9) ANCHOR(TOPRIGHT, XSHIFT, YSHIFT) COLOURED(neuR, neuG, neuB, 255)
   ELSE
      DRAWTEXT("#parkTxt#%  N/A", vX, yRow, SansSerif, Standard, 9) ANCHOR(TOPRIGHT, XSHIFT, YSHIFT) COLOURED(neuR, neuG, neuB, 255)
   ENDIF

   // row 8: Amihud
   yRow = dashY - 8 * rowH
   IF amihudRz > 1 THEN
      cR = bearR
      cG = bearG
      cB = bearB
   ELSE
      cR = neuR
      cG = neuG
      cB = neuB
   ENDIF
   amTxt = round(amihudSma * 1000000) / 1000000
   DRAWRECTANGLE(vX - 160, yRow + 9, vX + 160, yRow - 9) ANCHOR(TOPRIGHT, XSHIFT, YSHIFT) COLOURED(cR, cG, cB, 0) FILLCOLOR(cR, cG, cB, 26)
   DRAWTEXT("Amihud ILLIQ  (|r| / traded value x1e8)", dashX, yRow, SansSerif, Standard, 9) ANCHOR(TOPRIGHT, XSHIFT, YSHIFT) COLOURED(txtR, txtG, txtB, 255)
   DRAWTEXT("#amTxt#", vX, yRow, SansSerif, Standard, 9) ANCHOR(TOPRIGHT, XSHIFT, YSHIFT) COLOURED(cR, cG, cB, 255)

   // row 9: Kyle lambda
   yRow = dashY - 9 * rowH
   IF kyleRz > 1.5 THEN
      cR = bearR
      cG = bearG
      cB = bearB
   ELSE
      cR = neuR
      cG = neuG
      cB = neuB
   ENDIF
   klTxt = round(kyleLambda * 1000000) / 1000000
   DRAWRECTANGLE(vX - 160, yRow + 9, vX + 160, yRow - 9) ANCHOR(TOPRIGHT, XSHIFT, YSHIFT) COLOURED(cR, cG, cB, 0) FILLCOLOR(cR, cG, cB, 26)
   DRAWTEXT("Kyle Lambda  (ΔP~q OLS x1e6)", dashX, yRow, SansSerif, Standard, 9) ANCHOR(TOPRIGHT, XSHIFT, YSHIFT) COLOURED(txtR, txtG, txtB, 255)
   IF kyleLambda >= 0 THEN
      DRAWTEXT("+#klTxt#", vX, yRow, SansSerif, Standard, 9) ANCHOR(TOPRIGHT, XSHIFT, YSHIFT) COLOURED(cR, cG, cB, 255)
   ELSE
      DRAWTEXT("#klTxt#", vX, yRow, SansSerif, Standard, 9) ANCHOR(TOPRIGHT, XSHIFT, YSHIFT) COLOURED(cR, cG, cB, 255)
   ENDIF

   // row 10: adverse selection
   yRow = dashY - 10 * rowH
   IF asElevated THEN
      cR = bearR
      cG = bearG
      cB = bearB
   ELSE
      cR = bullR
      cG = bullG
      cB = bullB
   ENDIF
   klZ = round(kyleRz * 100) / 100
   DRAWRECTANGLE(dashX - 190, yRow + 9, vX + 160, yRow - 9) ANCHOR(TOPRIGHT, XSHIFT, YSHIFT) COLOURED(cR, cG, cB, 0) FILLCOLOR(cR, cG, cB, 38)
   DRAWTEXT("Adverse Selection  (λ z=#klZ#)", dashX, yRow, SansSerif, Standard, 9) ANCHOR(TOPRIGHT, XSHIFT, YSHIFT) COLOURED(txtR, txtG, txtB, 255)
   IF asElevated THEN
      DRAWTEXT("ELEVATED", vX, yRow, SansSerif, Standard, 9) ANCHOR(TOPRIGHT, XSHIFT, YSHIFT) COLOURED(cR, cG, cB, 255)
   ELSE
      DRAWTEXT("NORMAL", vX, yRow, SansSerif, Standard, 9) ANCHOR(TOPRIGHT, XSHIFT, YSHIFT) COLOURED(cR, cG, cB, 255)
   ENDIF

   // row 11: spread regime (classified by the LSI, as in the original)
   yRow = dashY - 11 * rowH
   spZ = round(spreadRz * 100) / 100
   DRAWRECTANGLE(dashX - 190, yRow + 9, vX + 160, yRow - 9) ANCHOR(TOPRIGHT, XSHIFT, YSHIFT) COLOURED(rgR, rgG, rgB, 0) FILLCOLOR(rgR, rgG, rgB, 46)
   DRAWTEXT("Spread Regime  (robust z=#spZ#)", dashX, yRow, SansSerif, Standard, 9) ANCHOR(TOPRIGHT, XSHIFT, YSHIFT) COLOURED(txtR, txtG, txtB, 255)
   IF regimeSt = 3 THEN
      DRAWTEXT("STRESS", vX, yRow, SansSerif, Standard, 9) ANCHOR(TOPRIGHT, XSHIFT, YSHIFT) COLOURED(rgR, rgG, rgB, rgA)
   ELSIF regimeSt = 2 THEN
      DRAWTEXT("ELEVATED", vX, yRow, SansSerif, Standard, 9) ANCHOR(TOPRIGHT, XSHIFT, YSHIFT) COLOURED(rgR, rgG, rgB, rgA)
   ELSIF regimeSt = 1 THEN
      DRAWTEXT("COMPRESSED", vX, yRow, SansSerif, Standard, 9) ANCHOR(TOPRIGHT, XSHIFT, YSHIFT) COLOURED(rgR, rgG, rgB, rgA)
   ELSE
      DRAWTEXT("NORMAL", vX, yRow, SansSerif, Standard, 9) ANCHOR(TOPRIGHT, XSHIFT, YSHIFT) COLOURED(rgR, rgG, rgB, rgA)
   ENDIF

   // row 12: spread trend
   yRow = dashY - 12 * rowH
   IF spreadWide = 1 THEN
      cR = bearR
      cG = bearG
      cB = bearB
   ELSE
      cR = bullR
      cG = bullG
      cB = bullB
   ENDIF
   DRAWRECTANGLE(dashX - 190, yRow + 9, vX + 160, yRow - 9) ANCHOR(TOPRIGHT, XSHIFT, YSHIFT) COLOURED(cR, cG, cB, 0) FILLCOLOR(cR, cG, cB, 26)
   DRAWTEXT("Spread Trend  (EMA 5/20)", dashX, yRow, SansSerif, Standard, 9) ANCHOR(TOPRIGHT, XSHIFT, YSHIFT) COLOURED(txtR, txtG, txtB, 255)
   IF spreadWide = 1 THEN
      DRAWTEXT("WIDENING", vX, yRow, SansSerif, Standard, 9) ANCHOR(TOPRIGHT, XSHIFT, YSHIFT) COLOURED(cR, cG, cB, 255)
   ELSE
      DRAWTEXT("TIGHTENING", vX, yRow, SansSerif, Standard, 9) ANCHOR(TOPRIGHT, XSHIFT, YSHIFT) COLOURED(cR, cG, cB, 255)
   ENDIF

   // row 13: LSI
   yRow = dashY - 13 * rowH
   lsiZ = round(lsi * 100) / 100
   lsiS = round(lsiScaled)
   DRAWRECTANGLE(dashX - 190, yRow + 9, vX + 160, yRow - 9) ANCHOR(TOPRIGHT, XSHIFT, YSHIFT) COLOURED(rgR, rgG, rgB, 0) FILLCOLOR(rgR, rgG, rgB, 51)
   DRAWTEXT("LSI  z=#lsiZ#  scaled=#lsiS#/100", dashX, yRow, SansSerif, Standard, 9) ANCHOR(TOPRIGHT, XSHIFT, YSHIFT) COLOURED(txtR, txtG, txtB, 255)
   IF regimeSt = 3 THEN
      DRAWTEXT("STRESS  [Sprd+ILLIQ+|λ|]", vX, yRow, SansSerif, Standard, 9) ANCHOR(TOPRIGHT, XSHIFT, YSHIFT) COLOURED(rgR, rgG, rgB, rgA)
   ELSIF regimeSt = 2 THEN
      DRAWTEXT("ELEVATED  [Sprd+ILLIQ+|λ|]", vX, yRow, SansSerif, Standard, 9) ANCHOR(TOPRIGHT, XSHIFT, YSHIFT) COLOURED(rgR, rgG, rgB, rgA)
   ELSIF regimeSt = 1 THEN
      DRAWTEXT("COMPRESSED  [Sprd+ILLIQ+|λ|]", vX, yRow, SansSerif, Standard, 9) ANCHOR(TOPRIGHT, XSHIFT, YSHIFT) COLOURED(rgR, rgG, rgB, rgA)
   ELSE
      DRAWTEXT("NORMAL  [Sprd+ILLIQ+|λ|]", vX, yRow, SansSerif, Standard, 9) ANCHOR(TOPRIGHT, XSHIFT, YSHIFT) COLOURED(rgR, rgG, rgB, rgA)
   ENDIF

   // row 14: LSI breakdown
   yRow = dashY - 14 * rowH
   ahZ = round(amihudRz * 100) / 100
   DRAWTEXT("LSI breakdown  spread / ILLIQ / |λ|", dashX, yRow, SansSerif, Standard, 8) ANCHOR(TOPRIGHT, XSHIFT, YSHIFT) COLOURED(neuR, neuG, neuB, 204)
   DRAWTEXT("#spZ# / #ahZ# / #klZ#", vX, yRow, SansSerif, Standard, 8) ANCHOR(TOPRIGHT, XSHIFT, YSHIFT) COLOURED(neuR, neuG, neuB, 204)

   // row 15: regime bands
   yRow = dashY - 15 * rowH
   DRAWTEXT("Bands  median / +1σ / +2σ", dashX, yRow, SansSerif, Standard, 8) ANCHOR(TOPRIGHT, XSHIFT, YSHIFT) COLOURED(neuR, neuG, neuB, 153)
   IF madSpOk THEN
      bMedTxt = round(medSp * 10000) / 10000
      bU1Txt = round((medSp + 1.4826 * madSp) * 10000) / 10000
      bU2Txt = round((medSp + 2 * 1.4826 * madSp) * 10000) / 10000
      DRAWTEXT("#bMedTxt# / #bU1Txt# / #bU2Txt#%", vX, yRow, SansSerif, Standard, 8) ANCHOR(TOPRIGHT, XSHIFT, YSHIFT) COLOURED(neuR, neuG, neuB, 153)
   ELSE
      DRAWTEXT("N/A", vX, yRow, SansSerif, Standard, 8) ANCHOR(TOPRIGHT, XSHIFT, YSHIFT) COLOURED(neuR, neuG, neuB, 153)
   ENDIF

   // rows 16-17: settings and references
   yRow = dashY - 16 * rowH
   DRAWTEXT("Win #lookback#  Regime #regimeWin#  Smooth #smoothN#", dashX, yRow, SansSerif, Standard, 8) ANCHOR(TOPRIGHT, XSHIFT, YSHIFT) COLOURED(neuR, neuG, neuB, 115)
   DRAWTEXT("(c) EdgeTools", vX, yRow, SansSerif, Standard, 8) ANCHOR(TOPRIGHT, XSHIFT, YSHIFT) COLOURED(neuR, neuG, neuB, 115)
   yRow = dashY - 17 * rowH
   DRAWTEXT("Roll84 | CS12 | AR17 | Hasbrouck09 | Amihud02 | Kyle85 | Park80", dashX, yRow, SansSerif, Standard, 8) ANCHOR(TOPRIGHT, XSHIFT, YSHIFT) COLOURED(neuR, neuG, neuB, 89)
   DRAWTEXT("MAD-z: Rousseeuw & Croux 1993", vX, yRow, SansSerif, Standard, 8) ANCHOR(TOPRIGHT, XSHIFT, YSHIFT) COLOURED(neuR, neuG, neuB, 89)
ENDIF

RETURN pRoll COLOURED(priR, priG, priB, 255) STYLE(line, 2) AS "Roll 1984 %", pCS COLOURED(bullR, bullG, bullB, 204) STYLE(line, 1) AS "Corwin-Schultz 2012 %", pAR COLOURED(245, 158, 11, 204) STYLE(line, 1) AS "Abdi-Ranaldo 2017 %", pEff COLOURED(168, 85, 247, 191) STYLE(line, 1) AS "Eff. Spread Proxy %", pGlow COLOURED(sgR, sgG, sgB, 31) STYLE(line, 5) AS "Composite Glow 3", pGlow COLOURED(sgR, sgG, sgB, 61) STYLE(line, 4) AS "Composite Glow 2", pGlow COLOURED(sgR, sgG, sgB, 107) STYLE(line, 3) AS "Composite Glow 1", pComp COLOURED(sgR, sgG, sgB, 217) STYLE(line, 2) AS "Composite Spread %", pPark COLOURED(neuR, neuG, neuB, 166) STYLE(point, 2) AS "Parkinson Vol %", pHL COLOURED(neuR, neuG, neuB, 89) STYLE(line, 1) AS "HL Range (ref) %", pMed COLOURED(neuR, neuG, neuB, 115) STYLE(line, 1) AS "Median", pUp2 COLOURED(bearR, bearG, bearB, 89) STYLE(line, 1) AS "Median +2 sigma", pUp1 COLOURED(bearR, bearG, bearB, 46) STYLE(line, 1) AS "Median +1 sigma", pDn1 COLOURED(bullR, bullG, bullB, 46) STYLE(line, 1) AS "Median -1 sigma", 0 COLOURED(neuR, neuG, neuB, 77) STYLE(line, 1) AS "Zero"
Conclusion
Spreads and liquidity are usually invisible on a bar chart. Market Microstructure Analytics approximates them with well established models, combines them in a robust way and reduces them to a single stress index with a clear regime. Used on daily bars and as a relative reading, it shows when trading conditions are unusually rough for an instrument; it is a context tool, not a timing signal.