Swing Structure Forecast
Introduction
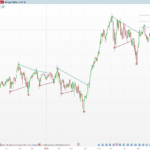
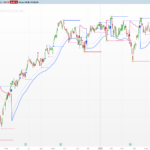
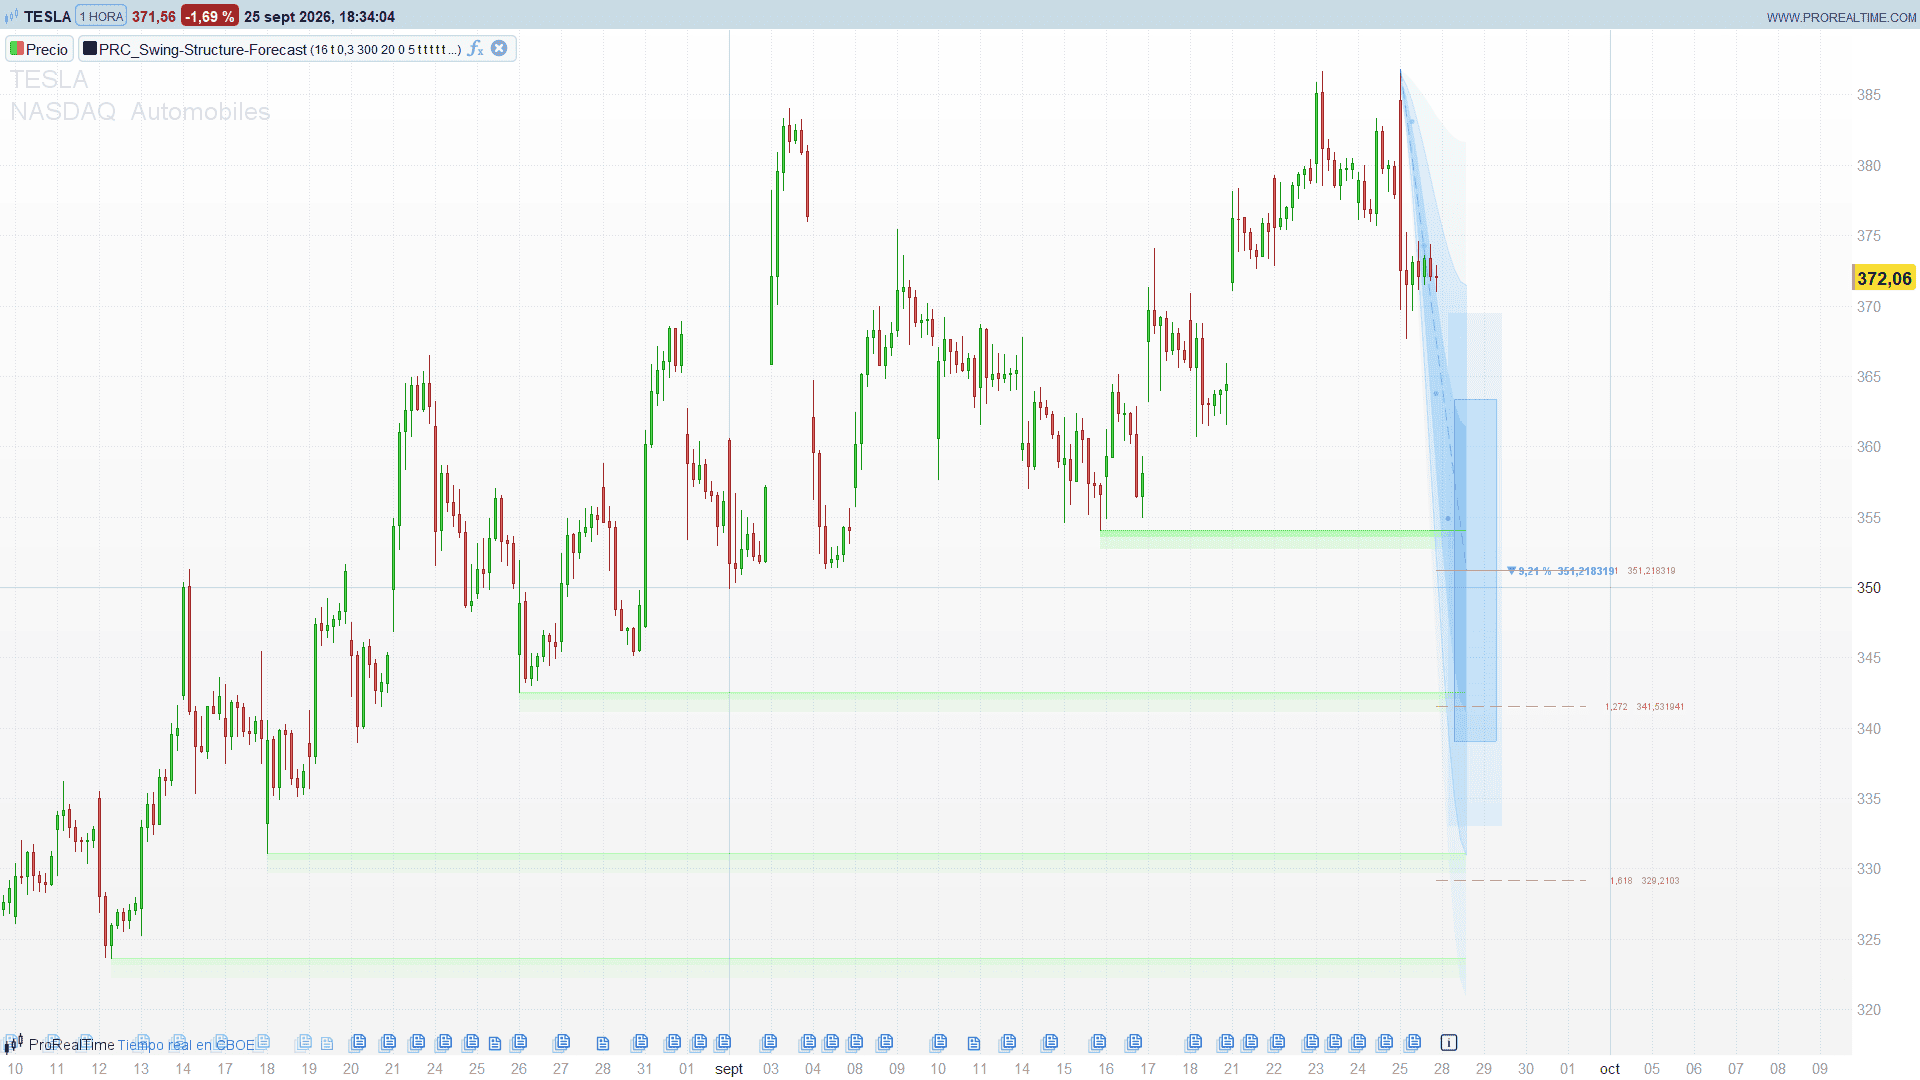
Every market has a rhythm. Some instruments swing 2% before reversing, others 6%; some legs last a dozen bars, others fifty. Most traders carry a rough feeling for that rhythm, but rarely a number. Swing Structure Forecast, by BOSWaves, measures it. It records the size and duration of the most recent completed swings, turns them into an expected size for the leg that is running now, and projects it on the chart as a target zone inside a cone that widens with the uncertainty of the history.
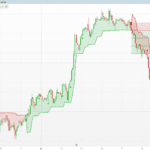
On top of the forecast, every completed swing leaves a support or resistance zone that fades with age and dims when price closes through it, so the chart shows both where price has been turning and where the current leg is statistically likely to end.
Theory Behind the Indicator
Swing detection
The swing direction turns up when a bar prints the highest high of the last swingLen bars (16 by default) and turns down when a bar prints the lowest low. A swing high is confirmed when the previous bar was the highest of its window and the current bar does not exceed it; swing lows mirror that rule.
Measuring the legs
Each time the direction flips, the leg that just ended is recorded: its size as the percentage move between the swing high and the swing low, and its duration as the number of bars between them. Only the most recent legs are kept (20 by default).
The forecast
From those legs the indicator computes the expected size of the next one with one of three methods:
- Weighted: recent legs count more (weights 1, 2, 3… from oldest to newest)
- Average: all legs count the same
- Median: the middle value, which ignores outliers
The standard deviation of the leg sizes measures how consistent the history is. The forecast starts at the last swing point, the swing high when the direction is down and the swing low when it is up, and projects the expected percentage move from there. The uncertainty band is that standard deviation expressed in price, with a floor of 10% of ATR(200).
The beam and the target
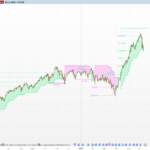
The path from the origin to the target follows a smooth S curve (slow start, fast middle, slow finish). Around it, a beam in three layers opens from zero width at the origin to 1.5, 1 and 0.5 times the uncertainty band at the target. A wide beam means the recent swings were irregular; a narrow one, that they were consistent. The target zone sits at the end of the beam, with the expected percentage and target price next to it.
Support and resistance zones
When the direction turns up, a resistance zone is created at the last swing high; when it turns down, a support zone at the last swing low. The zone height is a fraction of ATR(200). Unbroken zones extend to the right and fade as they age; after maxAge bars they are removed. A close beyond the level breaks the zone: it stops extending, its line becomes dotted and it almost disappears, and 30 bars after its swing it is removed.
Key Features at a Glance
- Swing high and low detection with a single length parameter
- Statistics of the last completed legs: size and duration
- Three forecast methods: weighted, average and median
- Layered projection beam whose width reflects the consistency of past swings
- Target zone with expected move in percent and target price
- Up to five Fibonacci extensions of the projected move
- Support and resistance zones from every swing, fading with age and dimmed when broken
How to Read the Indicator
- The target zone is where the current leg would end if it behaves like the recent ones. It is a statistical reference, not a prediction of direction: the direction is the one of the running swing.
- The beam width tells you how much to trust it. A narrow beam comes from swings of similar size; a wide beam warns that recent legs were very different from each other.
- Fibonacci extensions beyond the target (127.2% and 161.8% by default) are the levels to watch when the move extends further than usual.
- Fresh, unbroken zones are the strongest levels. Faded zones are old; dotted, nearly transparent zones have already been broken.
- Target near an unbroken zone: when the projected target lands on a fresh support or resistance zone, both readings point to the same area.
Practical Applications
- Profit targets: use the target zone as a first exit and the extensions for runners.
- Stretch filter: when price has already travelled beyond the target or the 127.2% extension, the leg is long compared with the recent ones, which is a poor place to join it.
- Level map: the swing zones give ready-made support and resistance levels with their age visible at a glance.
- Comparing regimes: the size of the beam and the forecast percentage show at a glance whether the market is swinging wide or narrow compared with its recent history.
Indicator Configuration
swingLen(default: 16, minimum 10): bars used to identify swing highs and lows. Larger values give fewer, more significant swings.showLevels(default: 1): show the support and resistance zones.zoneATR(default: 0.3): zone height as a multiple of ATR(200).maxAge(default: 300): bars an unbroken zone stays on the chart. Broken zones are removed 30 bars after their swing.samples(default: 20, 3 to 20): number of recent completed legs used for the forecast.method(default: 0): 0 = Weighted, 1 = Average, 2 = Median.fwdBars(default: 5): bars ahead where the target zone is drawn. It only moves the drawing, not the price target.showBeam,showTarget,showDots,showFibs(default: 1): projection beam, target zone, path markers and Fibonacci extensions.fib1On…fib5Onandfib1…fib5(defaults: on 1.0, on 1.272, on 1.618, off 2.0, off 2.618): the five extension levels.bullR/G/B,bearR/G/B: support and resistance colours.prjR/G/B: forecast colour (beam, centre line, markers and target).fibR/G/B: Fibonacci colour.
Code
//---------------------------------------------------------------
//PRC_Swing-Structure-Forecast
//version = 0
//28.09.2026
//Iván González @ www.prorealcode.com
//Author: BOSWaves
//Sharing ProRealTime knowledge
//--------------------------------------------------------------------//
defparam drawonlastbaronly = true
//--------------------------------------------------------------------//
// SETTINGS
//--------------------------------------------------------------------//
// Detection
swingLen = 16          // bars used to identify swing highs and lows (min 10)
// Support / Resistance
showLevels = 1         // 1 = show S/R zones
zoneATR = 0.3          // zone height as a multiple of ATR(200) (0.05 to 0.5)
maxAge = 300           // bars an unbroken level stays on the chart (broken: 30)
// Forecast
samples = 20           // completed swing legs used for the forecast (3 to 20)
method = 0             // 0 = Weighted, 1 = Average, 2 = Median
fwdBars = 5            // bars ahead of the forecast target (min 5)
showBeam = 1           // projection beam
showTarget = 1         // target zone
showDots = 1           // path markers
showFibs = 1           // Fibonacci extensions
fib1On = 1
fib1 = 1.0
fib2On = 1
fib2 = 1.272
fib3On = 1
fib3 = 1.618
fib4On = 0
fib4 = 2.0
fib5On = 0
fib5 = 2.618
// Colours
bullR = 0
bullG = 255
bullB = 0
bearR = 255
bearG = 0
bearB = 0
prjR = 66
prjG = 165
prjB = 245
fibR = 255
fibG = 235
fibB = 59
//--------------------------------------------------------------------//
// INPUT GUARDS
//--------------------------------------------------------------------//
swingLen = max(10, round(swingLen))
samples = max(3, min(20, round(samples)))
fwdBars = max(5, round(fwdBars))
maxAge = max(30, round(maxAge))
atrV = averagetruerange[200](close)
//--------------------------------------------------------------------//
// SWING DETECTION
//--------------------------------------------------------------------//
hhV = highest[swingLen](high)
llV = lowest[swingLen](low)
once swDir = 0
once hiP = undefined
once hiX = undefined
once loP = undefined
once loX = undefined
once nSw = 0
IF barindex >= swingLen THEN
   IF high = hhV THEN
      swDir = 1
   ENDIF
   IF low = llV THEN
      swDir = 0
   ENDIF
   IF high[1] = hhV[1] AND high < hhV THEN
      hiX = barindex - 1
      hiP = high[1]
   ENDIF
   IF low[1] = llV[1] AND low > llV THEN
      loX = barindex - 1
      loP = low[1]
   ENDIF
ENDIF
//--------------------------------------------------------------------//
// SWING RECORDING AND S/R ZONES
// Pure assignments indexed by a scalar counter: a tick that is rolled
// back only leaves an unused slot, never a duplicated swing
//--------------------------------------------------------------------//
IF barindex > swingLen AND swDir <> swDir[1] THEN
   IF hiP <> undefined AND loP <> undefined THEN
      nSw = nSw + 1
      IF swDir = 0 THEN
         $swPct[nSw] = abs((hiP - loP) / loP * 100)
      ELSE
         $swPct[nSw] = abs((loP - hiP) / hiP * 100)
      ENDIF
      $swBars[nSw] = abs(hiX - loX)
      // zone created by this swing
      $zMade[nSw] = barindex
      IF atrV <> undefined THEN
         $zW[nSw] = atrV * zoneATR
      ELSE
         $zW[nSw] = 0
      ENDIF
      IF swDir = 1 THEN
         $zRes[nSw] = 1
         $zPrice[nSw] = hiP
         $zStart[nSw] = hiX
      ELSE
         $zRes[nSw] = 0
         $zPrice[nSw] = loP
         $zStart[nSw] = loX
      ENDIF
   ENDIF
ENDIF
//--------------------------------------------------------------------//
// DRAWING (last bar only)
//--------------------------------------------------------------------//
IF islastbarupdate THEN
   //--- S/R zones: state at the last bar rebuilt from the history
   IF showLevels = 1 AND nSw > 0 THEN
      FOR k = nSw DOWNTO 1 DO
         IF $zMade[k] < barindex - maxAge THEN
            BREAK
         ENDIF
         zP = $zPrice[k]
         zAge = barindex - $zStart[k]
         // first close beyond the level since the zone was created
         brk = 0
         brkBar = 0
         FOR b = $zMade[k] TO barindex DO
            IF brk = 0 THEN
               ofs = barindex - b
               IF $zRes[k] = 1 AND close[ofs] > zP THEN
                  brk = 1
                  brkBar = b
               ENDIF
               IF $zRes[k] = 0 AND close[ofs] < zP THEN
                  brk = 1
                  brkBar = b
               ENDIF
            ENDIF
         NEXT
         alive = 1
         IF zAge > maxAge OR (brk = 1 AND zAge > 30) THEN
            alive = 0
         ENDIF
         IF alive = 1 THEN
            IF $zRes[k] = 1 THEN
               zR = bearR
               zG = bearG
               zB = bearB
               zSide = 1
            ELSE
               zR = bullR
               zG = bullG
               zB = bullB
               zSide = 0 - 1
            ENDIF
            IF brk = 1 THEN
               // a broken zone stops extending on the bar before the break
               zRight = max($zMade[k], brkBar - 1) + 5
               aOut = round(255 * 4 / 100)
               aIn = round(255 * 6 / 100)
               aLine = round(255 * 20 / 100)
            ELSE
               zRight = barindex + 5
               fade = min(zAge / maxAge, 1)
               aOut = round(255 * (100 - floor(90 + 10 * fade)) / 100)
               aIn = round(255 * (100 - floor(82 + 18 * fade)) / 100)
               aLine = round(255 * (100 - floor(45 + 55 * fade)) / 100)
            ENDIF
            zOut = zP + zSide * $zW[k]
            zIn = zP + zSide * $zW[k] * 0.35
            zX = $zStart[k]
            DRAWRECTANGLE(zX, zOut, zRight, zP) COLOURED(zR, zG, zB, 0) FILLCOLOR(zR, zG, zB, aOut)
            DRAWRECTANGLE(zX, zIn, zRight, zP) COLOURED(zR, zG, zB, 0) FILLCOLOR(zR, zG, zB, aIn)
            IF brk = 1 THEN
               DRAWSEGMENT(zX, zP, zRight, zP) COLOURED(zR, zG, zB, aLine) STYLE(dottedline, 1)
            ELSE
               DRAWSEGMENT(zX, zP, zRight, zP) COLOURED(zR, zG, zB, aLine) STYLE(line, 1)
            ENDIF
         ENDIF
      NEXT
   ENDIF
   //--- forecast from the last completed swing legs
   nUse = min(samples, nSw)
   IF nUse >= 2 THEN
      kFirst = nSw - nUse + 1
      IF method = 0 THEN
         tw = 0
         wp = 0
         wb = 0
         FOR k = kFirst TO nSw DO
            wgt = k - kFirst + 1
            wp = wp + $swPct[k] * wgt
            wb = wb + $swBars[k] * wgt
            tw = tw + wgt
         NEXT
         fPct = wp / tw
         fBars = wb / tw
      ELSIF method = 2 THEN
         // median: sorted copies of the window
         FOR k = 0 TO nUse - 1 DO
            $srtP[k] = $swPct[kFirst + k]
            $srtB[k] = $swBars[kFirst + k]
         NEXT
         FOR k = 0 TO nUse - 2 DO
            FOR m = 0 TO nUse - 2 - k DO
               IF $srtP[m] > $srtP[m + 1] THEN
                  tmp = $srtP[m]
                  $srtP[m] = $srtP[m + 1]
                  $srtP[m + 1] = tmp
               ENDIF
               IF $srtB[m] > $srtB[m + 1] THEN
                  tmp = $srtB[m]
                  $srtB[m] = $srtB[m + 1]
                  $srtB[m + 1] = tmp
               ENDIF
            NEXT
         NEXT
         midK = floor(nUse / 2)
         IF nUse MOD 2 = 1 THEN
            fPct = $srtP[midK]
            fBars = $srtB[midK]
         ELSE
            fPct = ($srtP[midK - 1] + $srtP[midK]) / 2
            fBars = ($srtB[midK - 1] + $srtB[midK]) / 2
         ENDIF
      ELSE
         sumP = 0
         sumB = 0
         FOR k = kFirst TO nSw DO
            sumP = sumP + $swPct[k]
            sumB = sumB + $swBars[k]
         NEXT
         fPct = sumP / nUse
         fBars = sumB / nUse
      ENDIF
      varSum = 0
      FOR k = kFirst TO nSw DO
         dv = $swPct[k] - fPct
         varSum = varSum + dv * dv
      NEXT
      sdPct = sqrt(varSum / nUse)
      //--- orgP, target and uncertainty band
      IF swDir = 0 THEN
         isBear = 1
         orgP = hiP
         oIdx = hiX
         tgt = orgP * (1 - fPct / 100)
      ELSE
         isBear = 0
         orgP = loP
         oIdx = loX
         tgt = orgP * (1 + fPct / 100)
      ENDIF
      tIdx = barindex + fwdBars
      bandHalf = orgP * sdPct / 100
      IF atrV <> undefined THEN
         bandHalf = max(bandHalf, atrV * 0.1)
      ENDIF
      //--- layered beam: 12 steps, each step a quad split in two triangles
      IF showBeam = 1 THEN
         FOR ly = 0 TO 2 DO
            IF ly = 0 THEN
               lyMult = 1.5
               aFill = round(255 * 7 / 100)
            ELSIF ly = 1 THEN
               lyMult = 1.0
               aFill = round(255 * 13 / 100)
            ELSE
               lyMult = 0.5
               aFill = round(255 * 22 / 100)
            ENDIF
            FOR sIdx = 0 TO 11 DO
               t1 = sIdx / 12
               t2 = (sIdx + 1) / 12
               e1 = t1 * t1 * (3 - 2 * t1)
               e2 = t2 * t2 * (3 - 2 * t2)
               x1 = oIdx + floor((tIdx - oIdx) * t1)
               x2 = oIdx + floor((tIdx - oIdx) * t2)
               yc1 = orgP + (tgt - orgP) * e1
               yc2 = orgP + (tgt - orgP) * e2
               sp1 = bandHalf * lyMult * e1
               sp2 = bandHalf * lyMult * e2
               DRAWTRIANGLE(x1, yc1 + sp1, x2, yc2 + sp2, x2, yc2 - sp2) COLOURED(prjR, prjG, prjB, 0) FILLCOLOR(prjR, prjG, prjB, aFill)
               DRAWTRIANGLE(x1, yc1 + sp1, x2, yc2 - sp2, x1, yc1 - sp1) COLOURED(prjR, prjG, prjB, 0) FILLCOLOR(prjR, prjG, prjB, aFill)
               IF ly = 1 THEN
                  // outline of the middle layer
                  DRAWSEGMENT(x1, yc1 + sp1, x2, yc2 + sp2) COLOURED(prjR, prjG, prjB, 51)
                  DRAWSEGMENT(x1, yc1 - sp1, x2, yc2 - sp2) COLOURED(prjR, prjG, prjB, 51)
                  IF sIdx = 11 THEN
                     DRAWSEGMENT(x2, yc2 + sp2, x2, yc2 - sp2) COLOURED(prjR, prjG, prjB, 51)
                  ENDIF
               ENDIF
            NEXT
         NEXT
      ENDIF
      //--- centre trajectory
      DRAWSEGMENT(oIdx, orgP, tIdx, tgt) COLOURED(prjR, prjG, prjB, 179) STYLE(dottedline2, 1)
      //--- path markers
      IF showDots = 1 THEN
         FOR sIdx = 1 TO 4 DO
            t1 = sIdx / 5
            e1 = t1 * t1 * (3 - 2 * t1)
            dX = oIdx + floor((tIdx - oIdx) * t1)
            dY = orgP + (tgt - orgP) * e1
            dotT = floor(25 + 45 * (1 - t1))
            aDot = round(255 * (100 - dotT) / 100)
            DRAWTEXT("●", dX, dY, Dialog, Standard, 7) COLOURED(prjR, prjG, prjB, aDot)
         NEXT
      ENDIF
      //--- target zone
      IF showTarget = 1 THEN
         tgtTop = tgt + bandHalf * 0.6
         tgtBot = tgt - bandHalf * 0.6
         DRAWRECTANGLE(tIdx - 3, tgtTop + bandHalf * 0.3, tIdx + 6, tgtBot - bandHalf * 0.3) COLOURED(prjR, prjG, prjB, 0) FILLCOLOR(prjR, prjG, prjB, 26)
         DRAWRECTANGLE(tIdx - 2, tgtTop, tIdx + 5, tgtBot) COLOURED(prjR, prjG, prjB, 153) FILLCOLOR(prjR, prjG, prjB, 51)
         pctTxt = round(fPct * 100) / 100
         tgtTxt = tgt
         IF isBear = 1 THEN
            DRAWTEXT("▼ #pctTxt#%  #tgtTxt#", tIdx + 16, tgt, Dialog, Bold, 11) COLOURED(prjR, prjG, prjB, 255)
         ELSE
            DRAWTEXT("▲ #pctTxt#%  #tgtTxt#", tIdx + 16, tgt, Dialog, Bold, 11) COLOURED(prjR, prjG, prjB, 255)
         ENDIF
      ENDIF
      //--- Fibonacci extensions of the projected move
      IF showFibs = 1 THEN
         fullMove = tgt - orgP
         $fibOn[1] = fib1On
         $fibOn[2] = fib2On
         $fibOn[3] = fib3On
         $fibOn[4] = fib4On
         $fibOn[5] = fib5On
         $fibV[1] = fib1
         $fibV[2] = fib2
         $fibV[3] = fib3
         $fibV[4] = fib4
         $fibV[5] = fib5
         $fibT[1] = 30
         $fibT[2] = 45
         $fibT[3] = 30
         $fibT[4] = 55
         $fibT[5] = 65
         FOR k = 1 TO 5 DO
            IF $fibOn[k] = 1 THEN
               fRatio = $fibV[k]
               fPrice = orgP + fullMove * fRatio
               aFib = round(255 * (100 - $fibT[k]) / 100)
               IF fRatio = 1 THEN
                  DRAWSEGMENT(barindex, fPrice, tIdx + 20, fPrice) COLOURED(fibR, fibG, fibB, aFib) STYLE(line, 1)
               ELSE
                  DRAWSEGMENT(barindex, fPrice, tIdx + 20, fPrice) COLOURED(fibR, fibG, fibB, aFib) STYLE(dottedline2, 1)
               ENDIF
               DRAWTEXT("#fRatio#  #fPrice#", tIdx + 30, fPrice, Dialog, Standard, 9) COLOURED(fibR, fibG, fibB, 230)
            ENDIF
         NEXT
      ENDIF
   ENDIF
ENDIF
RETURN
Conclusion
Swing Structure Forecast gives a number to the rhythm of the market: how far the recent legs travelled, how consistent they were, and where the current leg would end if it behaves the same way. With the swing zones on the same chart, you see at once where price has been turning and where it is statistically heading.