Holographic Market Microstructure
Introduction
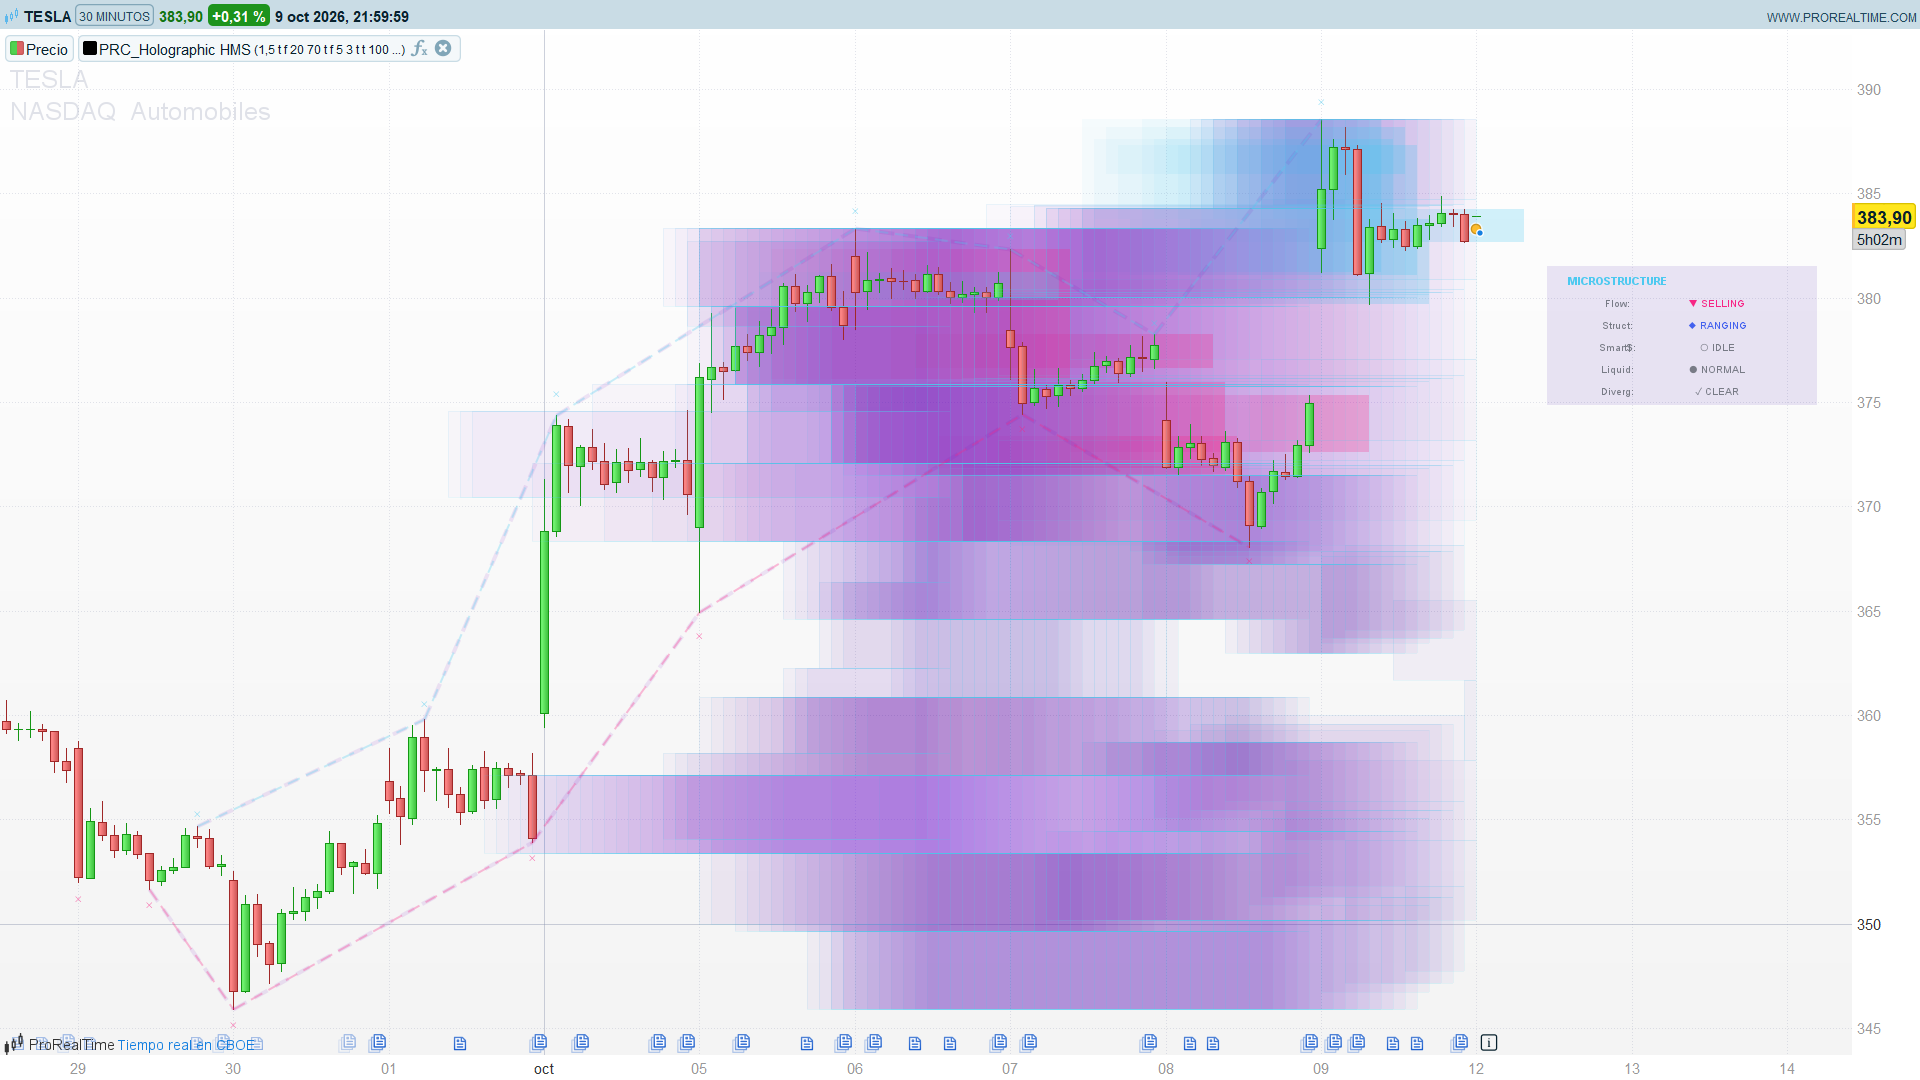
Holographic Market Microstructure is an all-in-one overlay that puts five reads of the market’s internal activity on the price chart: where volume has been traded, which bars moved a lot on little volume, when price and volume accelerate together, how the swing structure is evolving, and when price and volume start to disagree. A compact HUD panel sums up the state of each layer for the current bar.
The goal is not to give a single signal but to show context at a glance. A breakout that happens on top of a heavy volume area, with smart money activity and a clean fractal structure, reads very differently from one that crosses a thin, low-volume zone with a price/volume divergence.
Theory Behind the Indicator
Volume heat map
On every bar the indicator builds a small volume profile of the last 100 bars: the range between their highest high and lowest low is split into 10 price levels, and each bar adds its volume to the level that contains its midpoint (high + low) / 2. Each level is then drawn as a horizontal bar that starts at the current bar and extends to the left, with a length proportional to its share of the busiest level (40 bars at most). The colour goes from the dark tone of the theme for quiet levels to its glow tone for the busiest one.
Because a new profile is drawn on every bar and only the most recent 500 boxes are kept, the heat maps of the last bars overlap. The result is a cloud that is denser where volume has stayed concentrated over the last few dozen bars.
Liquidity voids
A liquidity void is a bar whose range is larger than ATR(14) x the liquidity threshold (1.5 by default) while its volume is below 70% of the 20-bar average volume: price travelled a long way with little participation. The void is marked with a soft box over that bar, plus a second, fainter box when the pulse effect is on.
Smart money zones
The smart money index compares the rate of change of price and of volume over the same period (20 bars). When price is up and volume has grown more than the accumulation threshold (70%), the bar is flagged as accumulation; when price is down with the same volume surge, as distribution. Each flagged bar draws five stepped boxes with its high-low range, starting 20 bars back, in the primary colour for accumulation and the secondary colour for distribution.
Fractal structure
A fractal high is a bar whose high is the highest of the 11 bars centred on it (period 5); a fractal low is the mirror case. Fractals are marked with a small cross above or below the bar. The last three fractal highs and the last three fractal lows are joined with dashed lines, drawn over a wider “glow” line. The structure score compares each pair of consecutive fractals of each side and adds +1 or -1.
Order flow and divergence
The order flow of a bar is its buying volume minus its selling volume, estimated from the position of the close inside the bar: volume x (close – low) / (high – low) for buyers and volume x (high – close) / (high – low) for sellers. Its cumulative sum is compared with its 20-bar average and normalised by the standard deviation of that gap, which gives a z-score. The divergence check compares the end points of a 20-bar linear regression of price and of volume: when they have opposite signs, a warning sign is printed above the bar.
Key Features at a Glance
- Volume heat map of the last 100 bars, redrawn on every bar and blended over the most recent ones.
- Liquidity voids: wide bars on thin volume, highlighted with one or two boxes.
- Smart money accumulation and distribution zones based on price and volume rate of change.
- Fractal highs and lows with dashed structure lines and a glow effect.
- Price/volume divergence warnings.
- Optional background shading by the normalised order flow.
- HUD panel with Flow, Structure, Smart Money, Liquidity and Divergence status.
- Six colour themes: Aeon, Cyber, Quantum, Neural, Plasma and Crystal.
How to Read the Indicator
- Heat map. The longest and brightest bars are the price levels where volume has concentrated. Price returning to them often slows down or reacts; price moving away from them into short, dark levels tends to move faster.
- Liquidity voids. A void is a move that was not backed by volume. Such moves are often retraced, at least partially, so the area of the void is worth watching as a possible magnet.
- Smart money zones. Clusters of accumulation boxes after a decline, or distribution boxes after a rally, point to strong participation that may anticipate a change of direction.
- Structure lines. They show the sequence of the last swing highs and lows. The HUD turns that sequence into BULLISH, BEARISH or RANGING when all the comparisons agree.
- HUD. Flow shows BUYING or SELLING when the normalised order flow is beyond +1 or -1 standard deviation; Smart$ shows ACCUM or DISTRIB on the current bar; Liquid shows VOID when the current bar is a liquidity void; Diverg shows ALERT when price and volume regressions disagree.
Practical Applications
- Context filter for entries. Prefer breakouts that leave a heavy volume area in the direction of the trade, and be careful with entries inside a liquidity void.
- Spotting participation. Smart money zones and a strong order flow reading highlight the bars where volume really supports the move.
- Structure tracking. The fractal lines give an immediate picture of the recent swing sequence without drawing it by hand.
Indicator Configuration
Microstructure:
- liqThreshold (default: 1.5): a bar is a liquidity void when its range exceeds ATR(14) x this value (1.0 to 3.0) and its volume is below 70% of the 20-bar average.
- showLiqVoids (default: 1): 1 shows the liquidity voids.
- showOrderFlow (default: 0): 1 shades the background with the normalised order flow.
Smart money tracking:
- smLength (default: 20): period of the price and volume rate of change, of the order flow average and of the divergence regressions (10 to 100).
- accumThreshold (default: 70): minimum volume rate of change, in %, for an accumulation or distribution bar (50 to 90).
- showSmartMoney (default: 1): 1 shows the smart money zones.
- showDivergence (default: 1): 1 shows the price/volume divergence marks.
Fractal structure:
- fractalPeriod (default: 5): bars on each side of a fractal (3 to 15).
- structureDepth (default: 3): number of fractal highs and lows joined by the structure lines (1 to 5).
- showFractals (default: 1): 1 shows the fractal crosses.
- showStructure (default: 1): 1 shows the structure lines.
Volume heat map:
- heatmapBars (default: 100): bars used to build each profile (50 to 300).
- heatmapLevels (default: 10): number of price levels (5 to 20).
- showHeatmap (default: 1): 1 shows the heat map.
- heatmapOpacity (default: 95): transparency of the busiest level, from 50 (more visible) to 100 (invisible).
Visuals:
- theme (default: 0): 0 Aeon, 1 Cyber, 2 Quantum, 3 Neural, 4 Plasma, 5 Crystal.
- glowEffect (default: 1): 1 draws a wide glow line under each structure line.
- pulseAnimation (default: 1): 1 draws a second, softer box on each liquidity void.
- showHUD (default: 1): 1 shows the HUD panel.
- hudPos (default: 3): 0 top left, 1 top right, 2 middle left, 3 middle right.
- hudMidY (default: -250): distance in pixels from the top of the chart for the middle positions.
- maxBoxes, maxLines, maxLabels (default: 500): number of the most recent boxes, structure lines and divergence marks kept on the chart.
Code
//---------------------------------------------------------------
// PRC_Holographic HMS
// version = 0
// 12.10.2026
// Iván González @ www.prorealcode.com
// Author: AlphaNatt
// Sharing ProRealTime knowledge
//--------------------------------------------------------------------//
defparam drawonlastbaronly = true
//--------------------------------------------------------------------//
// Microstructure
//--------------------------------------------------------------------//
liqThreshold = 1.5      // Liquidity threshold: bar range above ATR(14) x this value (1.0 - 3.0)
showLiqVoids = 1        // 1 = show liquidity voids
showOrderFlow = 0       // 1 = shade the background with the normalised order flow
//--------------------------------------------------------------------//
// Smart money tracking
//--------------------------------------------------------------------//
smLength = 20           // Smart money period (10 - 100)
accumThreshold = 70     // Accumulation threshold: volume rate of change in % (50 - 90)
showSmartMoney = 1      // 1 = show smart money zones
showDivergence = 1      // 1 = show price/volume divergence marks
//--------------------------------------------------------------------//
// Fractal structure
//--------------------------------------------------------------------//
fractalPeriod = 5       // Fractal period (3 - 15)
structureDepth = 3      // Structure depth: fractals kept per side (1 - 5)
showFractals = 1        // 1 = show fractal marks
showStructure = 1       // 1 = show the market structure lines
//--------------------------------------------------------------------//
// Volume heat map
//--------------------------------------------------------------------//
heatmapBars = 100       // Heat map bars (50 - 300)
heatmapLevels = 10      // Heat map levels (5 - 20)
showHeatmap = 1         // 1 = show the volume heat map
heatmapOpacity = 95     // Heat map transparency of the busiest level (50 - 100, 100 = invisible)
//--------------------------------------------------------------------//
// Visuals
//--------------------------------------------------------------------//
theme = 0               // 0 = Aeon, 1 = Cyber, 2 = Quantum, 3 = Neural, 4 = Plasma, 5 = Crystal
glowEffect = 1          // 1 = draw a wide glow line under each structure line
pulseAnimation = 1      // 1 = draw a second, softer box on each liquidity void
showHUD = 1             // 1 = show the HUD panel
hudPos = 3              // HUD position: 0 = top left, 1 = top right, 2 = middle left, 3 = middle right
hudMidY = -250          // Distance in pixels from the top of the chart for the middle positions
maxBoxes = 500          // Boxes kept on the chart (the most recent ones)
maxLines = 500          // Structure lines kept on the chart
maxLabels = 500         // Divergence marks kept on the chart
//--------------------------------------------------------------------//
// Colour themes: primary, secondary, accent, glow, dark
//--------------------------------------------------------------------//
IF theme = 0 THEN
   primR = 76
   primG = 201
   primB = 240
   secR = 247
   secG = 37
   secB = 133
   accR = 67
   accG = 97
   accB = 238
   glwR = 114
   glwG = 9
   glwB = 183
   drkR = 58
   drkG = 12
   drkB = 163
ELSIF theme = 1 THEN
   primR = 0
   primG = 255
   primB = 255
   secR = 255
   secG = 0
   secB = 255
   accR = 255
   accG = 255
   accB = 0
   glwR = 0
   glwG = 255
   glwB = 0
   drkR = 0
   drkG = 0
   drkB = 51
ELSIF theme = 2 THEN
   primR = 65
   primG = 105
   primB = 225
   secR = 255
   secG = 20
   secB = 147
   accR = 0
   accG = 255
   accB = 127
   glwR = 255
   glwG = 165
   glwB = 0
   drkR = 0
   drkG = 0
   drkB = 34
ELSIF theme = 3 THEN
   primR = 127
   primG = 255
   primB = 0
   secR = 255
   secG = 105
   secB = 180
   accR = 0
   accG = 206
   accB = 209
   glwR = 255
   glwG = 215
   glwB = 0
   drkR = 0
   drkG = 17
   drkB = 34
ELSIF theme = 4 THEN
   primR = 255
   primG = 0
   primB = 255
   secR = 0
   secG = 255
   secB = 255
   accR = 255
   accG = 105
   accB = 180
   glwR = 127
   glwG = 255
   glwB = 0
   drkR = 17
   drkG = 0
   drkB = 34
ELSE
   primR = 0
   primG = 191
   primB = 255
   secR = 255
   secG = 99
   secB = 71
   accR = 50
   accG = 205
   accB = 50
   glwR = 255
   glwG = 215
   glwB = 0
   drkR = 0
   drkG = 0
   drkB = 68
ENDIF
//--------------------------------------------------------------------//
// Order flow: cumulative buy - sell volume, normalised
//--------------------------------------------------------------------//
IF high > low THEN
   ofiBar = volume * (close - low) / (high - low) - volume * (high - close) / (high - low)
ELSE
   ofiBar = 0           // no range: the bar adds nothing to the cumulative flow
ENDIF
IF barindex = 0 THEN
   ofiCum = ofiBar
ELSE
   ofiCum = ofiCum[1] + ofiBar
ENDIF
ofiMA = average[smLength](ofiCum)
ofiDev = ofiCum - ofiMA
ofiSd = std[smLength](ofiDev)
ofiOk = 0
ofiNorm = 0
IF barindex >= 2 * smLength - 2 THEN
   IF ofiSd > 0 THEN
      ofiOk = 1
      ofiNorm = ofiDev / ofiSd
   ENDIF
ENDIF
//--------------------------------------------------------------------//
// Liquidity voids: wide bar on thin volume
//--------------------------------------------------------------------//
myAtr = averagetruerange[14](close)
volAvg20 = average[20](volume)
isVoid = 0
IF barindex >= 19 THEN
   IF (high - low) > myAtr * liqThreshold AND volAvg20 * 0.7 > volume THEN
      isVoid = 1
   ENDIF
ENDIF
//--------------------------------------------------------------------//
// Smart money index: price and volume rate of change
//--------------------------------------------------------------------//
smIdx = 0
IF barindex >= smLength THEN
   IF close[smLength] > 0 AND volume[smLength] > 0 THEN
      priceRoc = 100 * (close - close[smLength]) / close[smLength]
      volRoc = 100 * (volume - volume[smLength]) / volume[smLength]
      IF priceRoc > 0 AND volRoc > accumThreshold THEN
         smIdx = 1
      ELSIF 0 > priceRoc AND volRoc > accumThreshold THEN
         smIdx = -1
      ENDIF
   ENDIF
ENDIF
//--------------------------------------------------------------------//
// Fractals: stored as events (index = counter, so a tick that undoes a fractal undoes it here too)
//--------------------------------------------------------------------//
ONCE nFh = 0
ONCE nFl = 0
ONCE nDv = 0
fHigh = 0
fLow = 0
IF barindex >= 2 * fractalPeriod THEN
   IF high[fractalPeriod] = highest[2 * fractalPeriod + 1](high) THEN
      fHigh = 1
   ENDIF
   IF low[fractalPeriod] = lowest[2 * fractalPeriod + 1](low) THEN
      fLow = 1
   ENDIF
ENDIF
IF fHigh = 1 THEN
   nFh = nFh + 1
   $fhX[nFh] = barindex - fractalPeriod
   $fhY[nFh] = high[fractalPeriod]
   $fhM[nFh] = high[fractalPeriod] + 0.3 * myAtr[fractalPeriod]
   $fhD[nFh] = barindex
ENDIF
IF fLow = 1 THEN
   nFl = nFl + 1
   $flX[nFl] = barindex - fractalPeriod
   $flY[nFl] = low[fractalPeriod]
   $flM[nFl] = low[fractalPeriod] - 0.3 * myAtr[fractalPeriod]
   $flD[nFl] = barindex
ENDIF
// Micro trend over the last structureDepth fractals of each side.
// As in the original, an older point above the newer one adds +1.
microTrend = 0
IF structureDepth >= 2 THEN
   FOR i = 0 TO structureDepth - 2 DO
      iaH = nFh - (structureDepth - 1) + i
      IF iaH >= 1 THEN
         IF $fhY[iaH] > $fhY[iaH + 1] THEN
            microTrend = microTrend + 1
         ELSE
            microTrend = microTrend - 1
         ENDIF
      ENDIF
      iaL = nFl - (structureDepth - 1) + i
      IF iaL >= 1 THEN
         IF $flY[iaL] > $flY[iaL + 1] THEN
            microTrend = microTrend + 1
         ELSE
            microTrend = microTrend - 1
         ENDIF
      ENDIF
   NEXT
ENDIF
//--------------------------------------------------------------------//
// Price / volume divergence: opposite slopes of the regression endpoints
//--------------------------------------------------------------------//
pTrend = LinearRegression[smLength](close)
vTrend = LinearRegression[smLength](volume)
isDiv = 0
IF showDivergence = 1 AND barindex >= smLength - 1 THEN
   IF (pTrend > 0 AND 0 > vTrend) OR (0 > pTrend AND vTrend > 0) THEN
      isDiv = 1
   ENDIF
ENDIF
IF isDiv = 1 THEN
   nDv = nDv + 1
   $dvX[nDv] = barindex
   $dvY[nDv] = high
ENDIF
winHi = highest[heatmapBars](high)
winLo = lowest[heatmapBars](low)
//--------------------------------------------------------------------//
// Background shaded by the order flow (optional)
//--------------------------------------------------------------------//
IF showOrderFlow = 1 AND ofiOk = 1 THEN
   bgT = max(0, min(100, 95 - abs(ofiNorm) * 10))
   bgA = round(255 * (100 - bgT) / 100)
   IF ofiNorm > 0 THEN
      BACKGROUNDCOLOR(primR, primG, primB, bgA)
   ELSE
      BACKGROUNDCOLOR(secR, secG, secB, bgA)
   ENDIF
ENDIF
//--------------------------------------------------------------------//
// Drawing: every object is rebuilt on the last bar.
// Like the original, only the most recent maxBoxes / maxLines / maxLabels survive.
//--------------------------------------------------------------------//
IF islastbarupdate THEN
   //----------------------------------------------------------------//
   // Boxes: heat map, liquidity voids and smart money zones of each bar,
   // walked from the newest bar back until the box budget runs out
   //----------------------------------------------------------------//
   budget = maxBoxes
   kb = 0
   WHILE budget > 0 AND barindex >= kb DO
      tBar = barindex - kb
      // smart money zones (created last in their bar)
      IF showSmartMoney = 1 AND abs(smIdx[kb]) = 1 THEN
         FOR i = 4 DOWNTO 0 DO
            IF budget > 0 THEN
               zA = round(255 * (5 + i * 5) / 100)
               zX1 = tBar - smLength + i * 5
               IF smIdx[kb] = 1 THEN
                  DRAWRECTANGLE(zX1, high[kb], zX1 + 5, low[kb]) COLOURED(primR, primG, primB, 0) FILLCOLOR(primR, primG, primB, zA)
               ELSE
                  DRAWRECTANGLE(zX1, high[kb], zX1 + 5, low[kb]) COLOURED(secR, secG, secB, 0) FILLCOLOR(secR, secG, secB, zA)
               ENDIF
               budget = budget - 1
            ENDIF
         NEXT
      ENDIF
      // liquidity void of the previous bar
      IF showLiqVoids = 1 AND tBar >= 1 THEN
         IF isVoid[kb + 1] = 1 THEN
            IF pulseAnimation = 1 AND budget > 0 THEN
               DRAWRECTANGLE(tBar - 1, high[kb + 1], tBar, low[kb + 1]) COLOURED(accR, accG, accB, 51) FILLCOLOR(accR, accG, accB, 5)
               budget = budget - 1
            ENDIF
            IF budget > 0 THEN
               DRAWRECTANGLE(tBar - 1, high[kb + 1], tBar, low[kb + 1]) COLOURED(accR, accG, accB, 128) FILLCOLOR(accR, accG, accB, 13)
               budget = budget - 1
            ENDIF
         ENDIF
      ENDIF
      // volume heat map of that bar
      IF showHeatmap = 1 AND tBar >= heatmapBars - 1 AND budget > 0 THEN
         hiK = winHi[kb]
         loK = winLo[kb]
         IF hiK > loK THEN
            lvH = (hiK - loK) / heatmapLevels
            FOR i = 0 TO heatmapLevels - 1 DO
               $hv[i] = 0
            NEXT
            jMax = min(heatmapBars - 1, tBar)
            FOR j = 0 TO jMax DO
               bPx = (high[kb + j] + low[kb + j]) / 2
               lvI = floor((bPx - loK) / lvH)
               IF lvI >= 0 AND heatmapLevels - 1 >= lvI THEN
                  $hv[lvI] = $hv[lvI] + volume[kb + j]
               ENDIF
            NEXT
            maxV = 0
            FOR i = 0 TO heatmapLevels - 1 DO
               maxV = max(maxV, $hv[i])
            NEXT
            IF maxV > 0 THEN
               FOR i = heatmapLevels - 1 DOWNTO 0 DO
                  IF $hv[i] > 0 AND budget > 0 THEN
                     vRat = $hv[i] / maxV
                     boxW = floor(vRat * 40)
                     hR = round(drkR + (glwR - drkR) * vRat)
                     hG = round(drkG + (glwG - drkG) * vRat)
                     hB = round(drkB + (glwB - drkB) * vRat)
                     hT = 95 + (heatmapOpacity - 95) * vRat
                     hA = round(255 * (100 - hT) / 100)
                     lvMid = loK + i * lvH + lvH / 2
                     DRAWRECTANGLE(tBar - boxW, lvMid + lvH / 2, tBar, lvMid - lvH / 2) COLOURED(primR, primG, primB, 26) FILLCOLOR(hR, hG, hB, hA)
                     budget = budget - 1
                  ENDIF
               NEXT
            ENDIF
         ENDIF
      ENDIF
      kb = kb + 1
   WEND
   //----------------------------------------------------------------//
   // Structure lines: each bar redraws the lines between its last fractals,
   // so the same segment is stacked once per bar, as in the original
   //----------------------------------------------------------------//
   IF showStructure = 1 AND structureDepth >= 2 THEN
      budgetL = maxLines
      kb = 0
      phE = nFh
      plE = nFl
      WHILE budgetL > 0 AND barindex >= kb DO
         tBar = barindex - kb
         WHILE phE >= 1 AND $fhD[phE] > tBar DO
            phE = phE - 1
         WEND
         WHILE plE >= 1 AND $flD[plE] > tBar DO
            plE = plE - 1
         WEND
         IF 1 > phE + plE THEN
            budgetL = 0      // no fractal before this bar: no older lines
         ENDIF
         FOR i = structureDepth - 2 DOWNTO 0 DO
            iaL = plE - (structureDepth - 1) + i
            IF iaL >= 1 THEN
               IF glowEffect = 1 AND budgetL > 0 THEN
                  DRAWSEGMENT($flX[iaL], $flY[iaL], $flX[iaL + 1], $flY[iaL + 1]) COLOURED(glwR, glwG, glwB, 26) STYLE(dottedline2, 4)
                  budgetL = budgetL - 1
               ENDIF
               IF budgetL > 0 THEN
                  DRAWSEGMENT($flX[iaL], $flY[iaL], $flX[iaL + 1], $flY[iaL + 1]) COLOURED(secR, secG, secB, 77) STYLE(dottedline2, 2)
                  budgetL = budgetL - 1
               ENDIF
            ENDIF
            iaH = phE - (structureDepth - 1) + i
            IF iaH >= 1 THEN
               IF glowEffect = 1 AND budgetL > 0 THEN
                  DRAWSEGMENT($fhX[iaH], $fhY[iaH], $fhX[iaH + 1], $fhY[iaH + 1]) COLOURED(glwR, glwG, glwB, 26) STYLE(dottedline2, 4)
                  budgetL = budgetL - 1
               ENDIF
               IF budgetL > 0 THEN
                  DRAWSEGMENT($fhX[iaH], $fhY[iaH], $fhX[iaH + 1], $fhY[iaH + 1]) COLOURED(primR, primG, primB, 77) STYLE(dottedline2, 2)
                  budgetL = budgetL - 1
               ENDIF
            ENDIF
         NEXT
         kb = kb + 1
      WEND
   ENDIF
   //----------------------------------------------------------------//
   // Fractal marks (all of them) and divergence marks (the most recent maxLabels)
   //----------------------------------------------------------------//
   IF showFractals = 1 THEN
      FOR i = 1 TO nFh DO
         DRAWTEXT("✕", $fhX[i], $fhM[i], SansSerif, Standard, 8) COLOURED(primR, primG, primB, 179)
      NEXT
      FOR i = 1 TO nFl DO
         DRAWTEXT("✕", $flX[i], $flM[i], SansSerif, Standard, 8) COLOURED(secR, secG, secB, 179)
      NEXT
   ENDIF
   IF nDv >= 1 THEN
      dvFrom = max(1, nDv - maxLabels + 1)
      FOR i = nDv DOWNTO dvFrom DO
         DRAWTEXT("⚠", $dvX[i], $dvY[i], SansSerif, Bold, 16) COLOURED(accR, accG, accB, 255)
      NEXT
   ENDIF
   //----------------------------------------------------------------//
   // HUD panel
   //----------------------------------------------------------------//
   IF showHUD = 1 THEN
      IF hudPos >= 2 THEN
         hy = hudMidY
      ELSE
         hy = -20
      ENDIF
      // status codes: 1 = bullish, -1 = bearish, 0 = neutral
      flowSt = 0
      IF ofiOk = 1 AND ofiNorm > 1 THEN
         flowSt = 1
      ELSIF ofiOk = 1 AND -1 > ofiNorm THEN
         flowSt = -1
      ENDIF
      structSt = 0
      IF microTrend > 2 THEN
         structSt = 1
      ELSIF -2 > microTrend THEN
         structSt = -1
      ENDIF
      IF hudPos = 1 OR hudPos = 3 THEN
         // ---- right side ----
         hx = -300
         hv = -200
         DRAWRECTANGLE(-370, hy + 14, -100, hy - 125) ANCHOR(TOPRIGHT, XSHIFT, YSHIFT) COLOURED(drkR, drkG, drkB, 0) FILLCOLOR(drkR, drkG, drkB, 26)
         DRAWTEXT("MICROSTRUCTURE", hx, hy, SansSerif, Bold, 11) ANCHOR(TOPRIGHT, XSHIFT, YSHIFT) COLOURED(primR, primG, primB, 255)
         DRAWTEXT("Flow:", hx, hy - 22, SansSerif, Standard, 10) ANCHOR(TOPRIGHT, XSHIFT, YSHIFT) COLOURED(120, 123, 134, 255)
         DRAWTEXT("Struct:", hx, hy - 44, SansSerif, Standard, 10) ANCHOR(TOPRIGHT, XSHIFT, YSHIFT) COLOURED(120, 123, 134, 255)
         DRAWTEXT("Smart$:", hx, hy - 66, SansSerif, Standard, 10) ANCHOR(TOPRIGHT, XSHIFT, YSHIFT) COLOURED(120, 123, 134, 255)
         DRAWTEXT("Liquid:", hx, hy - 88, SansSerif, Standard, 10) ANCHOR(TOPRIGHT, XSHIFT, YSHIFT) COLOURED(120, 123, 134, 255)
         DRAWTEXT("Diverg:", hx, hy - 110, SansSerif, Standard, 10) ANCHOR(TOPRIGHT, XSHIFT, YSHIFT) COLOURED(120, 123, 134, 255)
         IF flowSt = 1 THEN
            DRAWTEXT("▲ BUYING", hv, hy - 22, SansSerif, Standard, 10) ANCHOR(TOPRIGHT, XSHIFT, YSHIFT) COLOURED(primR, primG, primB, 255)
         ELSIF flowSt = -1 THEN
            DRAWTEXT("▼ SELLING", hv, hy - 22, SansSerif, Standard, 10) ANCHOR(TOPRIGHT, XSHIFT, YSHIFT) COLOURED(secR, secG, secB, 255)
         ELSE
            DRAWTEXT("◆ NEUTRAL", hv, hy - 22, SansSerif, Standard, 10) ANCHOR(TOPRIGHT, XSHIFT, YSHIFT) COLOURED(accR, accG, accB, 255)
         ENDIF
         IF structSt = 1 THEN
            DRAWTEXT("▲ BULLISH", hv, hy - 44, SansSerif, Standard, 10) ANCHOR(TOPRIGHT, XSHIFT, YSHIFT) COLOURED(primR, primG, primB, 255)
         ELSIF structSt = -1 THEN
            DRAWTEXT("▼ BEARISH", hv, hy - 44, SansSerif, Standard, 10) ANCHOR(TOPRIGHT, XSHIFT, YSHIFT) COLOURED(secR, secG, secB, 255)
         ELSE
            DRAWTEXT("◆ RANGING", hv, hy - 44, SansSerif, Standard, 10) ANCHOR(TOPRIGHT, XSHIFT, YSHIFT) COLOURED(accR, accG, accB, 255)
         ENDIF
         IF smIdx = 1 THEN
            DRAWTEXT("◈ ACCUM", hv, hy - 66, SansSerif, Standard, 10) ANCHOR(TOPRIGHT, XSHIFT, YSHIFT) COLOURED(primR, primG, primB, 255)
         ELSIF smIdx = -1 THEN
            DRAWTEXT("◈ DISTRIB", hv, hy - 66, SansSerif, Standard, 10) ANCHOR(TOPRIGHT, XSHIFT, YSHIFT) COLOURED(secR, secG, secB, 255)
         ELSE
            DRAWTEXT("○ IDLE", hv, hy - 66, SansSerif, Standard, 10) ANCHOR(TOPRIGHT, XSHIFT, YSHIFT) COLOURED(120, 123, 134, 255)
         ENDIF
         IF isVoid = 1 THEN
            DRAWTEXT("⚡ VOID", hv, hy - 88, SansSerif, Standard, 10) ANCHOR(TOPRIGHT, XSHIFT, YSHIFT) COLOURED(accR, accG, accB, 255)
         ELSE
            DRAWTEXT("● NORMAL", hv, hy - 88, SansSerif, Standard, 10) ANCHOR(TOPRIGHT, XSHIFT, YSHIFT) COLOURED(120, 123, 134, 255)
         ENDIF
         IF isDiv = 1 THEN
            DRAWTEXT("⚠ ALERT", hv, hy - 110, SansSerif, Standard, 10) ANCHOR(TOPRIGHT, XSHIFT, YSHIFT) COLOURED(glwR, glwG, glwB, 255)
         ELSE
            DRAWTEXT("✓ CLEAR", hv, hy - 110, SansSerif, Standard, 10) ANCHOR(TOPRIGHT, XSHIFT, YSHIFT) COLOURED(120, 123, 134, 255)
         ENDIF
      ELSE
         // ---- left side ----
         hx = 70
         hv = 170
         DRAWRECTANGLE(10, hy + 14, 240, hy - 125) ANCHOR(TOPLEFT, XSHIFT, YSHIFT) COLOURED(drkR, drkG, drkB, 0) FILLCOLOR(drkR, drkG, drkB, 26)
         DRAWTEXT("MICROSTRUCTURE", hx, hy, SansSerif, Bold, 11) ANCHOR(TOPLEFT, XSHIFT, YSHIFT) COLOURED(primR, primG, primB, 255)
         DRAWTEXT("Flow:", hx, hy - 22, SansSerif, Standard, 10) ANCHOR(TOPLEFT, XSHIFT, YSHIFT) COLOURED(120, 123, 134, 255)
         DRAWTEXT("Struct:", hx, hy - 44, SansSerif, Standard, 10) ANCHOR(TOPLEFT, XSHIFT, YSHIFT) COLOURED(120, 123, 134, 255)
         DRAWTEXT("Smart$:", hx, hy - 66, SansSerif, Standard, 10) ANCHOR(TOPLEFT, XSHIFT, YSHIFT) COLOURED(120, 123, 134, 255)
         DRAWTEXT("Liquid:", hx, hy - 88, SansSerif, Standard, 10) ANCHOR(TOPLEFT, XSHIFT, YSHIFT) COLOURED(120, 123, 134, 255)
         DRAWTEXT("Diverg:", hx, hy - 110, SansSerif, Standard, 10) ANCHOR(TOPLEFT, XSHIFT, YSHIFT) COLOURED(120, 123, 134, 255)
         IF flowSt = 1 THEN
            DRAWTEXT("▲ BUYING", hv, hy - 22, SansSerif, Standard, 10) ANCHOR(TOPLEFT, XSHIFT, YSHIFT) COLOURED(primR, primG, primB, 255)
         ELSIF flowSt = -1 THEN
            DRAWTEXT("▼ SELLING", hv, hy - 22, SansSerif, Standard, 10) ANCHOR(TOPLEFT, XSHIFT, YSHIFT) COLOURED(secR, secG, secB, 255)
         ELSE
            DRAWTEXT("◆ NEUTRAL", hv, hy - 22, SansSerif, Standard, 10) ANCHOR(TOPLEFT, XSHIFT, YSHIFT) COLOURED(accR, accG, accB, 255)
         ENDIF
         IF structSt = 1 THEN
            DRAWTEXT("▲ BULLISH", hv, hy - 44, SansSerif, Standard, 10) ANCHOR(TOPLEFT, XSHIFT, YSHIFT) COLOURED(primR, primG, primB, 255)
         ELSIF structSt = -1 THEN
            DRAWTEXT("▼ BEARISH", hv, hy - 44, SansSerif, Standard, 10) ANCHOR(TOPLEFT, XSHIFT, YSHIFT) COLOURED(secR, secG, secB, 255)
         ELSE
            DRAWTEXT("◆ RANGING", hv, hy - 44, SansSerif, Standard, 10) ANCHOR(TOPLEFT, XSHIFT, YSHIFT) COLOURED(accR, accG, accB, 255)
         ENDIF
         IF smIdx = 1 THEN
            DRAWTEXT("◈ ACCUM", hv, hy - 66, SansSerif, Standard, 10) ANCHOR(TOPLEFT, XSHIFT, YSHIFT) COLOURED(primR, primG, primB, 255)
         ELSIF smIdx = -1 THEN
            DRAWTEXT("◈ DISTRIB", hv, hy - 66, SansSerif, Standard, 10) ANCHOR(TOPLEFT, XSHIFT, YSHIFT) COLOURED(secR, secG, secB, 255)
         ELSE
            DRAWTEXT("○ IDLE", hv, hy - 66, SansSerif, Standard, 10) ANCHOR(TOPLEFT, XSHIFT, YSHIFT) COLOURED(120, 123, 134, 255)
         ENDIF
         IF isVoid = 1 THEN
            DRAWTEXT("⚡ VOID", hv, hy - 88, SansSerif, Standard, 10) ANCHOR(TOPLEFT, XSHIFT, YSHIFT) COLOURED(accR, accG, accB, 255)
         ELSE
            DRAWTEXT("● NORMAL", hv, hy - 88, SansSerif, Standard, 10) ANCHOR(TOPLEFT, XSHIFT, YSHIFT) COLOURED(120, 123, 134, 255)
         ENDIF
         IF isDiv = 1 THEN
            DRAWTEXT("⚠ ALERT", hv, hy - 110, SansSerif, Standard, 10) ANCHOR(TOPLEFT, XSHIFT, YSHIFT) COLOURED(glwR, glwG, glwB, 255)
         ELSE
            DRAWTEXT("✓ CLEAR", hv, hy - 110, SansSerif, Standard, 10) ANCHOR(TOPLEFT, XSHIFT, YSHIFT) COLOURED(120, 123, 134, 255)
         ENDIF
      ENDIF
   ENDIF
ENDIF
RETURN