







SwiftTrend Structure
Introduction
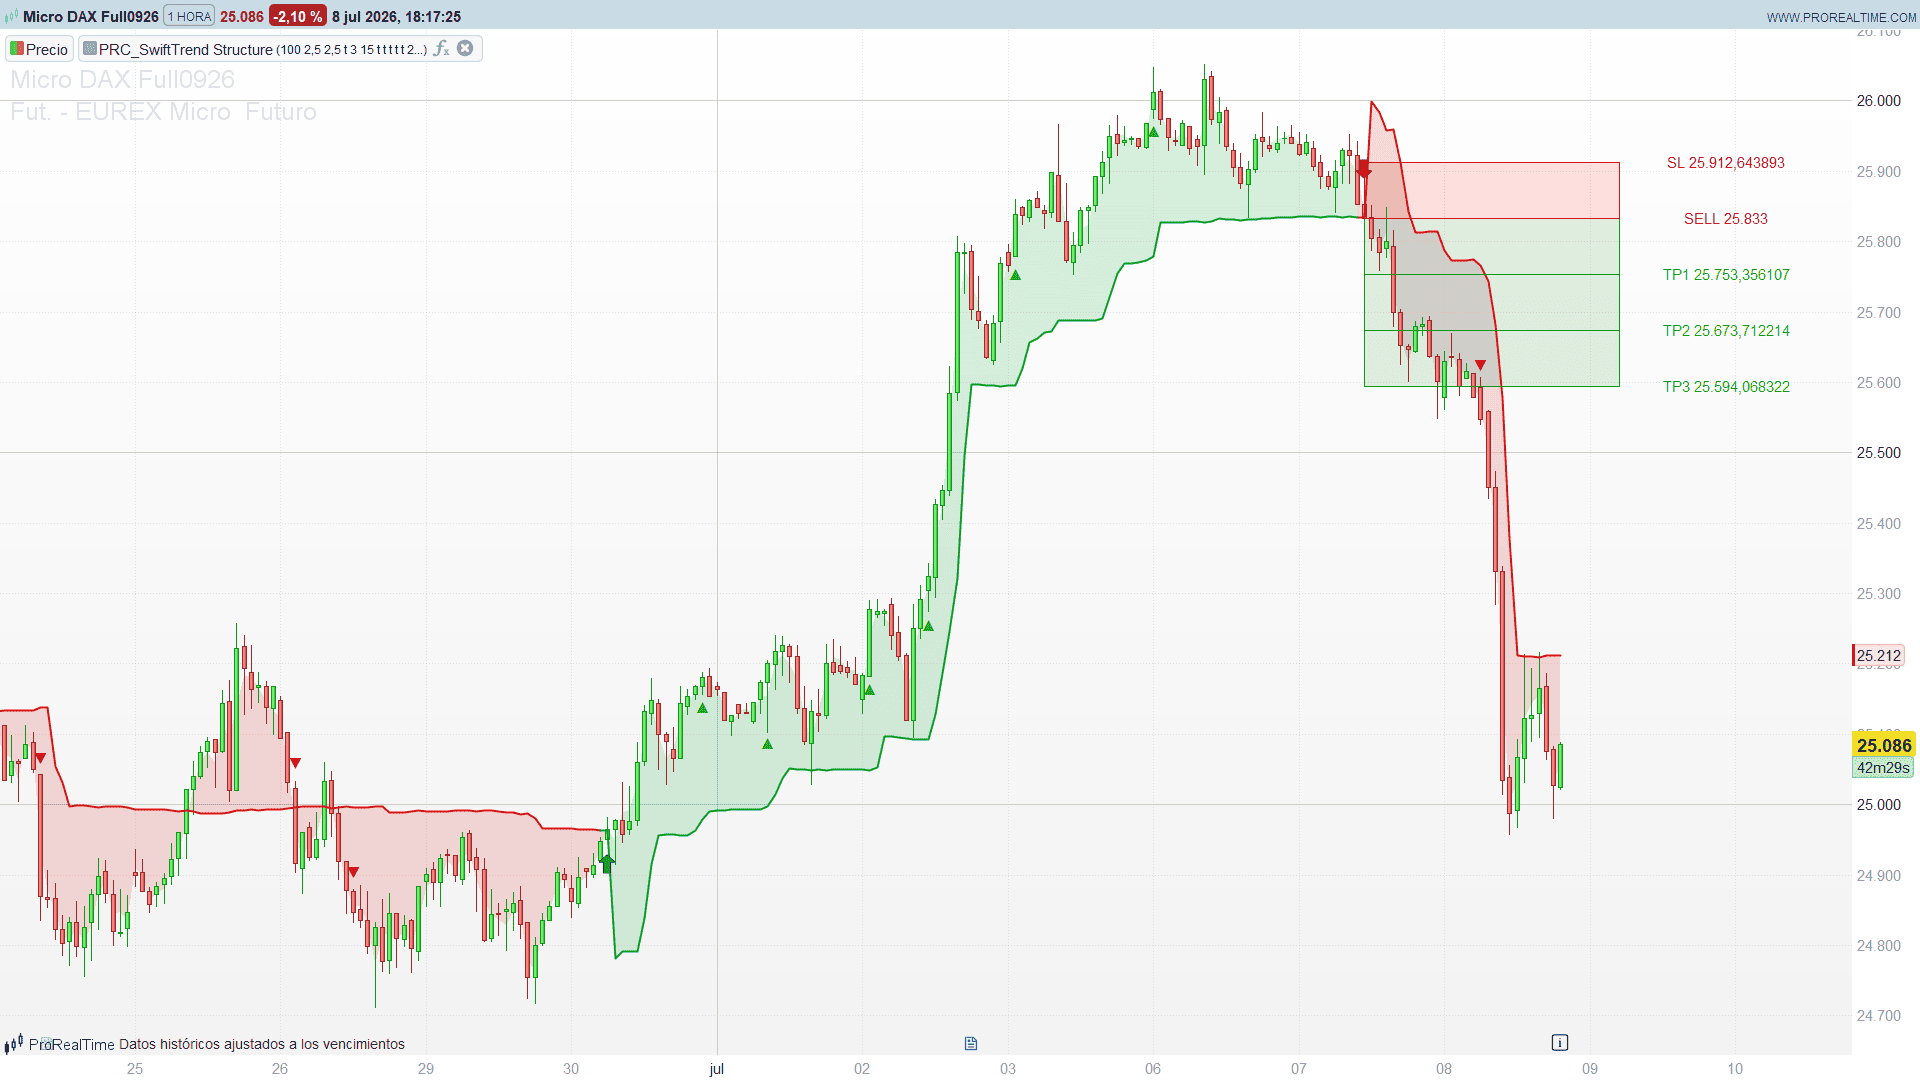
Most trend-following overlays trail price with a fixed multiple of the ATR. SwiftTrend Structure, by Uncle_the_shooter, does something slightly different and rather elegant: it trails price with a multiple of the average candle body, and it refuses to flip the trend on a simple line touch — a reversal is only accepted once the market also breaks its own pivot structure (a Break of Structure / Change of Character, BoS/ChoCh). On top of that, every confirmed signal projects a full trade plan: entry, stop-loss and three take-profit targets by risk-reward ratio.
This ProBuilder port keeps all of that: the adaptive baseline, the optional pivot confirmation with its “waiting” state, the BoS/ChoCh signals, and — for the last signal — the TP/SL block drawn live on the chart.
Theory Behind the Indicator
1. A baseline anchored to the candle body, not the ATR
The volatility unit here is the mean body size over period bars:
avgBody = SMA(|open - close|, period)
bodyMid = (open + close) / 2
Around the mid-body the indicator builds a band, and the trailing line avgLine is only ever allowed to move in favour of the current trend:
basicUpper = bodyMid[1] + bandMultiplier * avgBody[1]
basicLower = bodyMid[1] - bandMultiplier * avgBody[1]

uptrend   -> avgLine = max(basicLower, avgLine[1])   // a floor that only rises
downtrend -> avgLine = min(basicUpper, avgLine[1])   // a ceiling that only falls
The plotted line sits one tolerance band away: marginLineBase = uptrend ? avgLine - tolerance : avgLine + tolerance. It is the SuperTrend trailing idea, measured on candle conviction (body) rather than range, and not reset on a flip.
2. The raw break and the “waiting” state
A raw break happens when the close crosses to the wrong side of the margin line. With pivot confirmation off, a raw break flips the trend immediately. With confirmation on (default), a raw break only arms a pending state; the trend flips only once the market also prints a structure break in the new direction. If price recovers first, the pending state is disarmed. This armed/disarmed logic is what stops the indicator whipsawing on a single violating candle.
3. BoS / ChoCh — the confirmation and the signals
Structure is read from pivots at two lookbacks (fast and slow). Each fresh pivot arms a level; when the close then breaks it, the indicator fires a BoS/ChoCh. The confirmed trend flip prints an up/down arrow (the strong signal); intermediate structure breaks print small ▲ / ▼ triangles (the secondary signal).
4. The trade plan (TP/SL)
On each confirmed Buy/Sell the indicator computes a full plan from the entry close:
risk = useAtrSl ? ATR(14) * slAtrMult : entry * (slPercent / 100)
SL   = buy ? entry - risk          : entry + risk
TPn  = buy ? entry + risk * rrTPn  : entry - risk * rrTPn     (n = 1,2,3)
and draws it — entry/SL/TP lines, price labels, and a red risk zone (entry→SL) and green reward zone (entry→furthest TP) — for the last signal.
How to Read the Indicator
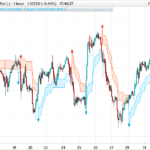
- The coloured line is the trend. Green while the baseline trails below price (uptrend), red while above (downtrend). The shaded fill runs from the line to the mid-price.
- Arrows are confirmed flips (Buy/Sell). The higher-quality reversal — a line break also confirmed by a structure break — and the signals that carry a TP/SL plan.
- ▲ / ▼ triangles are intermediate BoS/ChoCh. Structure breaks that are not a full flip; use them as continuation cues. (Hidden on a flip bar to avoid overlapping the arrow.)
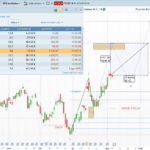
- The TP/SL block belongs to the last signal. Entry, SL and TP1/TP2/TP3 with prices, plus risk (red) and reward (green) zones. It stays on screen until the next signal replaces it.
- Slow by design. Body-based trailing plus structure confirmation means the line sits through shallow pullbacks — fewer, cleaner flips.
Practical Applications
- A trade plan at a glance. The last-signal TP/SL turns the indicator from a trend read into an actionable setup.
- Trend filter for another system. Use the trend colour as a regime gate: longs only while green, shorts only while red.
- Structure-confirmed entries. Combine the arrow (line break and structure break) with your own execution rules.
- Pullback continuation. In an established trend, a same-direction ▲/▼ after a pause is a classic continuation trigger.
Indicator Configuration
period= 100: lookback for the average body, and the warm-up window (first ~100 bars have no reliable line).bandMult= 2.5 /tolMult= 2.5: how far the band and tolerance sit from the mid-body. Higher = looser line, fewer flips.usePivotConf= 1: require a structure break to confirm a flip. Set to 0 for an immediate flip on the line break.bosLen1= 3 /bosLen2= 15: fast and slow pivot lookbacks (confirm withbosLenbars of lag).maxSignals= 250: how many historical signals are redrawn on the last bar (raise to see older ones).showBos/filterByTrend/showLabels/showLine/fillShade: display toggles.- TP/SL:
showTargets= 1;useAtrSl= 1 (ATR SL) or 0 (percent);slAtrMult= 1.5;slPercent= 1.0;rrTp1/2/3= 1.0/2.0/3.0;showSl/showTp1/2/3.
A note on rendering. The indicator uses defparam drawonlastbaronly = true so the TP/SL labels stay crisp on low timeframes (without it, ProBuilder repaints and overlaps the text on every tick). Because that defparam would otherwise hide inline drawings on past bars, the historical arrows and triangles are stored in arrays and redrawn in a loop on the last bar; the trend line and the fill are not affected by the defparam and render across the whole history.
What was adapted or dropped. The trend/structure/TP-SL engine is intact; three elements have no clean ProBuilder equivalent:
- Per-signal historical TP/SL → last signal only. The Pine version redraws the TP/SL box for every signal (deleting the previous) and freezes the lines on an SL/TP hit. ProBuilder has no dynamic line management, so the port keeps the last signal’s plan in persistent state and draws it on the last bar. You lose the historical boxes and the hit-detection; you keep the live setup.
- Dynamic pivot-line arrays → last unbroken pivot per lookback. The original keeps the full ladder of pending pivots; the port keeps only the most recent per length, giving a slightly more conservative BoS. The break information still shows as ▲/▼.
- Bar-coloring and alerts.
barcolorcannot recolor the chart candles from a ProBuilder indicator; alerts are set from the ProRealTime UI.bosUp/bosDn/trendChangedare left as clean flags.
Code
//--------------------------------------------
// PRC_SwiftTrend Structure (by Uncle_the_shooter)
// version = 0
// 08.07.2026
// Iván González @ www.prorealcode.com
// Sharing ProRealTime knowledge
//--------------------------------------------
defparam drawonlastbaronly = true
//--------------------------------------------
// --- Inputs ---
period       = 100   // Average Body Periods
bandMult     = 2.5   // Band Multiplier
tolMult      = 2.5   // Tolerance Multiplier
usePivotConf = 1     // Confirm trend change with pivot breakout (1/0)
bosLen1      = 3     // Pivot Length #1
bosLen2      = 15    // Pivot Length #2
showBos      = 1     // Show BOS/ChoCh triangles (1/0)
filterByTrend = 0    // Only signals aligned with trend (1/0)
showLabels   = 1     // Show Buy/Sell trend-change arrows (1/0)
showLine     = 1     // Show trend line (1/0)
fillShade    = 1     // Fill shade (1/0)
maxSignals   = 250   // Max historical signals redrawn on last bar
// --- TP/SL (drawn for the LAST Buy/Sell signal) ---
showTargets  = 1     // Show TP/SL block (1/0)
useAtrSl     = 1     // SL from ATR (1) or % of entry (0)
slAtrMult    = 1.5   // ATR multiplier for SL
slPercent    = 1.0   // SL % from entry (if useAtrSl = 0)
rrTp1        = 1.0   // Risk-Reward TP1
rrTp2        = 2.0   // Risk-Reward TP2
rrTp3        = 3.0   // Risk-Reward TP3
showSl       = 1
showTp1      = 1
showTp2      = 1
showTp3      = 1
// --- Colors (R,G,B) ---
upR = 6
upG = 162
upB = 47
downR = 207
downG = 23
downB = 23
//--------------------------------------------
once isUptrend = 1
once pendHigh1On = 0
once pendLow1On = 0
once pendHigh2On = 0
once pendLow2On = 0
once tpslDir = 0
once tpslEntry = 0
once tpslEntryBar = 0
once tpslSL = 0
once tpslTP1 = 0
once tpslTP2 = 0
once tpslTP3 = 0
once nSig = 0
//--------------------------------------------
atr14 = averagetruerange[14](close)
//--------------------------------------------
// --- SwiftTrend engine: adaptive trailing baseline ---
body    = abs(open - close)
avgBody = average[period](body)
bodyMid = (open + close) / 2
basicUpper = bodyMid[1] + bandMult * avgBody[1]
basicLower = bodyMid[1] - bandMult * avgBody[1]
tolerance  = tolMult * avgBody


IF barindex <= period THEN
   avgLine = basicLower
   isUptrend = 1
ELSIF isUptrend = 1 THEN
   avgLine = max(basicLower, avgLine[1])
ELSE
   avgLine = min(basicUpper, avgLine[1])
ENDIF


IF isUptrend = 1 THEN
   marginLineBase = avgLine - tolerance
ELSE
   marginLineBase = avgLine + tolerance
ENDIF


rawBreak = 0
IF isUptrend = 1 AND close < marginLineBase THEN
   rawBreak = 1
ENDIF
IF isUptrend = 0 AND close > marginLineBase THEN
   rawBreak = 1
ENDIF
//--------------------------------------------
// --- Pivot BoS/ChoCh engine (last unbroken pivot per length) ---
win1 = 2 * bosLen1 + 1
win2 = 2 * bosLen2 + 1


bosUp1 = 0
bosDn1 = 0
IF barindex > win1 THEN
   IF high[bosLen1] >= highest[win1](high) THEN
      pendHigh1 = high[bosLen1]
      pendHigh1On = 1
   ENDIF
   IF low[bosLen1] <= lowest[win1](low) THEN
      pendLow1 = low[bosLen1]
      pendLow1On = 1
   ENDIF
ENDIF
IF pendHigh1On = 1 AND close > pendHigh1 AND close[1] <= pendHigh1 THEN
   bosUp1 = 1
   pendHigh1On = 0
ENDIF
IF pendLow1On = 1 AND close < pendLow1 AND close[1] >= pendLow1 THEN
   bosDn1 = 1
   pendLow1On = 0
ENDIF


bosUp2 = 0
bosDn2 = 0
IF barindex > win2 THEN
   IF high[bosLen2] >= highest[win2](high) THEN
      pendHigh2 = high[bosLen2]
      pendHigh2On = 1
   ENDIF
   IF low[bosLen2] <= lowest[win2](low) THEN
      pendLow2 = low[bosLen2]
      pendLow2On = 1
   ENDIF
ENDIF
IF pendHigh2On = 1 AND close > pendHigh2 AND close[1] <= pendHigh2 THEN
   bosUp2 = 1
   pendHigh2On = 0
ENDIF
IF pendLow2On = 1 AND close < pendLow2 AND close[1] >= pendLow2 THEN
   bosDn2 = 1
   pendLow2On = 0
ENDIF


bosUp = 0
IF bosUp1 = 1 OR bosUp2 = 1 THEN
   bosUp = 1
ENDIF
bosDn = 0
IF bosDn1 = 1 OR bosDn2 = 1 THEN
   bosDn = 1
ENDIF
//--------------------------------------------
// --- Trend change: raw break + optional pivot confirmation ---
confirmUp = 0
confirmDown = 0
IF usePivotConf = 1 THEN
   confirmUp = bosUp
   confirmDown = bosDn
ENDIF


trendChanged = 0
IF usePivotConf = 1 THEN
   IF rawBreak = 1 THEN
      pending = 1
      IF isUptrend = 1 AND confirmDown = 1 THEN
         isUptrend = 0
         trendChanged = 1
         pending = 0
      ELSIF isUptrend = 0 AND confirmUp = 1 THEN
         isUptrend = 1
         trendChanged = 1
         pending = 0
      ENDIF
   ELSE
      pending = 0
   ENDIF
ELSE
   pending = 0
   IF rawBreak = 1 THEN
      IF isUptrend = 1 THEN
         isUptrend = 0
      ELSE
         isUptrend = 1
      ENDIF
      trendChanged = 1
   ENDIF
ENDIF
//--------------------------------------------
// --- TP/SL levels: recomputed on each confirmed Buy/Sell ---
IF showTargets = 1 AND trendChanged = 1 THEN
   IF isUptrend = 1 THEN
      tpslDir = 1
   ELSE
      tpslDir = -1
   ENDIF
   tpslEntry = close
   tpslEntryBar = barindex
   IF useAtrSl = 1 THEN
      riskDist = atr14 * slAtrMult
   ELSE
      riskDist = close * (slPercent / 100)
   ENDIF
   IF tpslDir = 1 THEN
      tpslSL  = tpslEntry - riskDist
      tpslTP1 = tpslEntry + riskDist * rrTp1
      tpslTP2 = tpslEntry + riskDist * rrTp2
      tpslTP3 = tpslEntry + riskDist * rrTp3
   ELSE
      tpslSL  = tpslEntry + riskDist
      tpslTP1 = tpslEntry - riskDist * rrTp1
      tpslTP2 = tpslEntry - riskDist * rrTp2
      tpslTP3 = tpslEntry - riskDist * rrTp3
   ENDIF
ENDIF
//--------------------------------------------
// --- Record signals into arrays (every bar) ---
// type 1 = Buy arrow, 2 = Sell arrow, 3 = BoS up, 4 = BoS down
IF showLabels = 1 AND trendChanged = 1 AND isUptrend = 1 THEN
   $sigX[nSig] = barindex
   $sigY[nSig] = low - atr14 * 0.6
   $sigType[nSig] = 1
   nSig = nSig + 1
ENDIF
IF showLabels = 1 AND trendChanged = 1 AND isUptrend = 0 THEN
   $sigX[nSig] = barindex
   $sigY[nSig] = high + atr14 * 0.6
   $sigType[nSig] = 2
   nSig = nSig + 1
ENDIF
sigUp = 0
IF showBos = 1 AND bosUp = 1 AND trendChanged = 0 THEN
   IF filterByTrend = 0 OR isUptrend = 1 THEN
      sigUp = 1
   ENDIF
ENDIF
IF sigUp = 1 THEN
   $sigX[nSig] = barindex
   $sigY[nSig] = low - atr14 * 0.3
   $sigType[nSig] = 3
   nSig = nSig + 1
ENDIF
sigDown = 0
IF showBos = 1 AND bosDn = 1 AND trendChanged = 0 THEN
   IF filterByTrend = 0 OR isUptrend = 0 THEN
      sigDown = 1
   ENDIF
ENDIF
IF sigDown = 1 THEN
   $sigX[nSig] = barindex
   $sigY[nSig] = high + atr14 * 0.3
   $sigType[nSig] = 4
   nSig = nSig + 1
ENDIF
//--------------------------------------------
// --- Colors + fill (not affected by drawonlastbaronly) ---
IF isUptrend = 1 THEN
   rC = upR
   gC = upG
   bC = upB
ELSE
   rC = downR
   gC = downG
   bC = downB
ENDIF


hl2 = (high + low) / 2
IF fillShade = 1 THEN
   colorbetween(marginLineBase, hl2, rC, gC, bC, 40)
ENDIF
//--------------------------------------------
// --- Draw on last bar: redraw signals from arrays + live TP/SL ---
IF islastbarupdate THEN
   startI = 0
   IF nSig > maxSignals THEN
      startI = nSig - maxSignals
   ENDIF
   FOR i = startI TO nSig - 1 DO
      IF $sigType[i] = 1 THEN
         drawarrowup($sigX[i], $sigY[i]) coloured(upR, upG, upB)
      ELSIF $sigType[i] = 2 THEN
         drawarrowdown($sigX[i], $sigY[i]) coloured(downR, downG, downB)
      ELSIF $sigType[i] = 3 THEN
         drawtext("▲", $sigX[i], $sigY[i]) coloured(0, 180, 0)
      ELSIF $sigType[i] = 4 THEN
         drawtext("▼", $sigX[i], $sigY[i]) coloured(200, 0, 0)
      ENDIF
   NEXT


   IF showTargets = 1 AND tpslDir <> 0 THEN
      xR = barindex + 8
      IF tpslDir = 1 THEN
         eR = upR
         eG = upG
         eB = upB
      ELSE
         eR = downR
         eG = downG
         eB = downB
      ENDIF
      IF showTp3 = 1 THEN
         rewardTop = tpslTP3
      ELSIF showTp2 = 1 THEN
         rewardTop = tpslTP2
      ELSIF showTp1 = 1 THEN
         rewardTop = tpslTP1
      ELSE
         rewardTop = tpslEntry
      ENDIF
      IF showSl = 1 THEN
         drawrectangle(tpslEntryBar, tpslSL, xR, tpslEntry) coloured("red") fillcolor("red", 30)
      ENDIF
      drawrectangle(tpslEntryBar, tpslEntry, xR, rewardTop) coloured("green") fillcolor("green", 30)
      drawsegment(tpslEntryBar, tpslEntry, xR, tpslEntry) coloured(eR, eG, eB)
      IF tpslDir = 1 THEN
         drawtext("BUY #tpslEntry#", xR, tpslEntry) coloured(eR, eG, eB)
      ELSE
         drawtext("SELL #tpslEntry#", xR, tpslEntry) coloured(eR, eG, eB)
      ENDIF
      IF showSl = 1 THEN
         drawsegment(tpslEntryBar, tpslSL, xR, tpslSL) coloured(downR, downG, downB)
         drawtext("SL #tpslSL#", xR, tpslSL) coloured(downR, downG, downB)
      ENDIF
      IF showTp1 = 1 THEN
         drawsegment(tpslEntryBar, tpslTP1, xR, tpslTP1) coloured(upR, upG, upB)
         drawtext("TP1 #tpslTP1#", xR, tpslTP1) coloured(upR, upG, upB)
      ENDIF
      IF showTp2 = 1 THEN
         drawsegment(tpslEntryBar, tpslTP2, xR, tpslTP2) coloured(upR, upG, upB)
         drawtext("TP2 #tpslTP2#", xR, tpslTP2) coloured(upR, upG, upB)
      ENDIF
      IF showTp3 = 1 THEN
         drawsegment(tpslEntryBar, tpslTP3, xR, tpslTP3) coloured(upR, upG, upB)
         drawtext("TP3 #tpslTP3#", xR, tpslTP3) coloured(upR, upG, upB)
      ENDIF
   ENDIF
ENDIF
//--------------------------------------------
// --- Trend line output (breaks on trend change) ---
IF trendChanged = 1 THEN
   plotLine = undefined
ELSE
   plotLine = marginLineBase
ENDIF


IF showLine = 1 THEN
   lineA = 255
ELSE
   lineA = 0
ENDIF
RETURN plotLine COLOURED(rC, gC, bC, lineA) STYLE(line, 2)
Comments
You must be logged in to post a comment.
merci Ivan pour cet algo. serait il possible de modifier les lignes "drawarrow" par des fleches modifiables en taille?
Oui. Il vous suffit de modifier les lignes 278 en 285.
Hi, I've copy/paste also and the indicator is working...

tout fonctionne chez moi

Rien ne s'affiche....
OK c'est parfait