1. Introduction
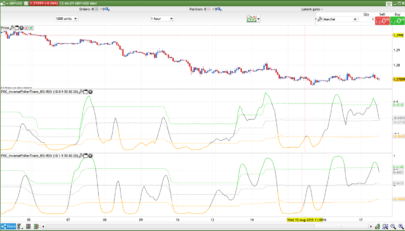
The RSI Trendlines with Breakouts (HoanGhetti) indicator combines classic RSI analysis with dynamic trendline detection to highlight potential reversal and continuation points directly on the RSI pane. By plotting trendlines through successive RSI pivots and marking clear breakouts with arrows, it helps traders spot momentum shifts earlier and more objectively.
2. Description & Fundamentals
-
Relative Strength Index (RSI): A momentum oscillator measuring speed and change of price movements on a scale of 0–100. Traditionally, readings above 70 indicate overbought conditions; below 30, oversold.
-
Pivot Points in RSI: Local highs and lows in the RSI series, detected over a configurable look-back period. These serve as anchors for drawing trendlines.
-
RSI Trendlines: Lines connecting two consecutive pivot highs (for a downtrend) or pivot lows (for an uptrend). A breakout of these lines often precedes notable price moves.
3. How It Works
-
Pivot Detection:
-
The script scans the RSI (14) values over the last BarLookBack = 8 bars.
-
When the current RSI equals the highest (or lowest) value over the look-back window, it registers a pivot high (or low).
-
-
Trendline Construction:
-
Maintains two arrays (
$plx/$plyfor lows,$phx/$phyfor highs) storing the bar indices and RSI values of the last two pivots. -
Calculates the slope-intercept form:
y=y1+(x−x1) y2−y1x2−x1
-
Draws the segment only if it confirms a valid uptrend (pivot low2 > low1) or downtrend (pivot high2 < high1).
-
-
Breakout Signals:
-
Bearish Breakout (Red): When RSI crosses below the up-trendline minus
RSIdiff = 2, it drops a red down-arrow above the RSI pane. -
Bullish Breakout (Green): When RSI crosses above the down-trendline plus
RSIdiff, it plots a green up-arrow below the RSI pane. -
After signaling, the trendline is extended in dotted style to the breakout bar.
-
4. Signal Interpretation
-
Red Down-Arrow (Sell Signal):
-
RSI has failed to maintain its uptrend and closed beneath the trendline by at least
RSIdiffpoints. -
Suggests weakening momentum—consider tightening stops or initiating short positions.
-
-
Green Up-Arrow (Buy Signal):
-
RSI recovers above its down-trendline by at least
RSIdiffpoints. -
Indicates renewed buying pressure—potential long entries or add-on opportunities.
-
-
Notes & Caveats:
-
Trendline breakouts can give false signals in choppy markets; combine with price action or volume filters.
-
Best used on well-defined trending instruments or timeframes where RSI reliably oscillates.
-
5. Configuration & Parameters
| Parameter | Default | Description |
|---|---|---|
| BarLookBack | 8 | Number of bars to look back for pivot detection. Smaller values detect tighter swings, more noise. |
| repaint | 0 | When set to 1, pivots are identified with a delay of BarLookBack bars (not recommended). |
| RSIdiff | 2 | Minimum distance (in RSI points) beyond the trendline required to trigger a breakout arrow. |
-
Adjusting BarLookBack:
-
Increase (e.g. 10–14) on higher timeframes to smooth trendlines.
-
Decrease (e.g. 5–6) on intraday charts for quicker signals.
-
-
Tweaking RSIdiff:
-
Larger values (3–4) reduce false breakouts but may lag.
-
Smaller values (1–1.5) catch earlier moves at the expense of more noise.
-
6. ProBuilder Code
|
1 2 3 4 5 6 7 8 9 10 11 12 13 14 15 16 17 18 19 20 21 22 23 24 25 26 27 28 29 30 31 32 33 34 35 36 37 38 39 40 41 42 43 44 45 46 47 48 49 50 51 52 53 54 55 56 57 58 59 60 61 62 63 64 65 66 67 68 69 70 71 |
//---------------------------------------------// //RSI Trendlines with Breakouts [HoanGhetti] //version = 0 //29.07.25 //Iván González @ www.prorealcode.com //Sharing ProRealTime knowledge //---------------------------------------------// defparam DRAWONLASTBARONLY=false //---------------------------------------------// //--- inputs //---------------------------------------------// BarLookBack = 8 repaint = 0 RSIdiff = 2 ////RSI myrsi = rsi[14](close) //---------------------------------------------// //--- pivots low //---------------------------------------------// IF myrsi[repaint*BarLookBack+1] = lowest[repaint*BarLookBack+BarLookBack+1](myrsi) THEN $ply[z] = myrsi[repaint*BarLookBack+1] $plx[z] = barindex-(repaint*BarLookBack+1) z=z+1 ENDIF //--- pivots low line //(x-x1)/(x2-x1) = (y-y1)/(y2-y1) y2 = $ply[max(z-1,1)] x2 = $plx[max(z-1,1)] y1 = $ply[max(z-2,1)] x1 = $plx[max(z-2,1)] xl = barindex yl = y1+(xl-x1)*(y2-y1)/(x2-x1) //draw line only when rsi is over the line if y2 > y1 then drawsegment(x1,y1,x2,y2)coloured("red") //look for the cross under if myrsi crosses under yl-RSIdiff then drawarrowdown(xl,yl+5)coloured("red") drawsegment(x2,y2,xl,yl)style(dottedline,2)coloured("red") endif endif //---------------------------------------------// //--- pivots high //---------------------------------------------// IF myrsi[repaint*BarLookBack+1] = highest[repaint*BarLookBack+BarLookBack+1](myrsi) THEN $phy[n] = myrsi[repaint*BarLookBack+1] $phx[n] = barindex-(repaint*BarLookBack+1) n=n+1 ENDIF //--- pivots high line //(x-x1)/(x2-x1) = (y-y1)/(y2-y1) y22 = $phy[max(n-1,1)] x22 = $phx[max(n-1,1)] y11 = $phy[max(n-2,1)] x11 = $phx[max(n-2,1)] xh = barindex yh = y11+(xh-x11)*(y22-y11)/(x22-x11) //draw line only when rsi is under the line if y22 < y11 then drawsegment(x11,y11,x22,y22)coloured("green") //look for the cross over if myrsi crosses over yh+RSIdiff then drawarrowup(xh,yh-5)coloured("green") drawsegment(x22,y22,xh,yh)style(dottedline,2)coloured("green") endif endif //---------------------------------------------// return myrsi as "RSI" coloured("black",255 )style(line,2) |
Share this
No information on this site is investment advice or a solicitation to buy or sell any financial instrument. Past performance is not indicative of future results. Trading may expose you to risk of loss greater than your deposits and is only suitable for experienced investors who have sufficient financial means to bear such risk.
ProRealTime ITF files and other attachments :
Find other exclusive trading pro-tools on ![]()
PRC is also on YouTube, subscribe to our channel for exclusive content and tutorials