RSI MultiPeriods HeatMap

v10.3
RSI MultiPeriods HeatMap

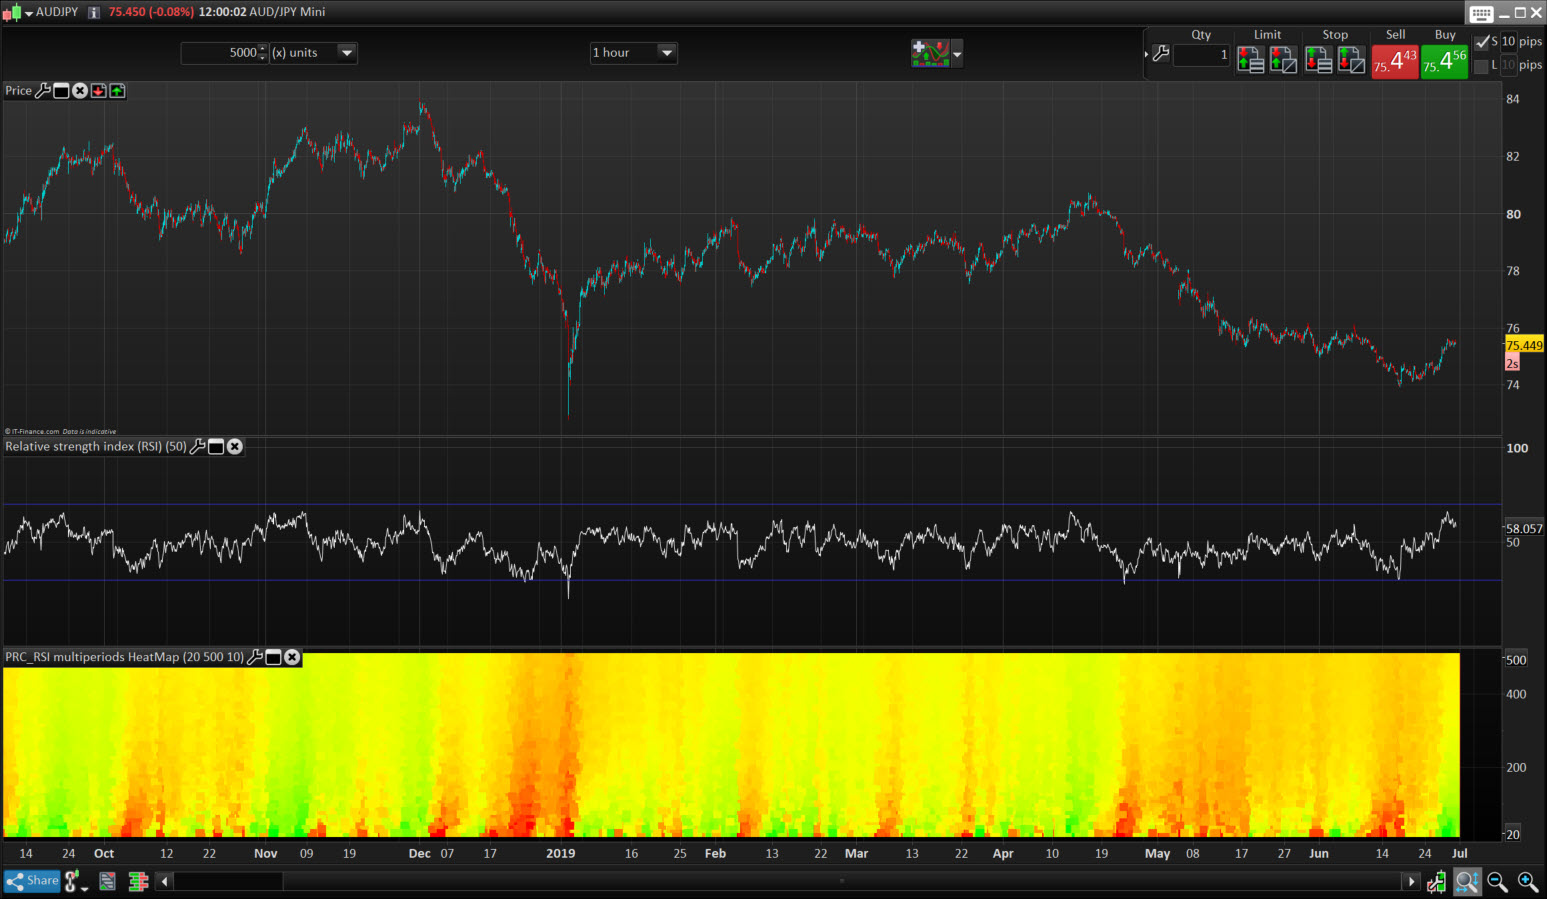
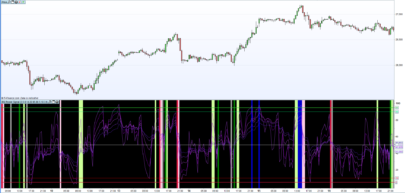
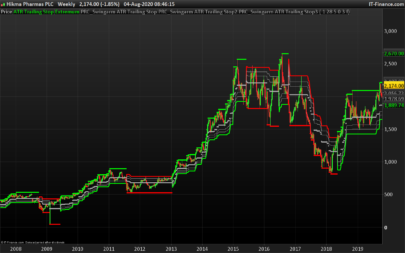
This “heatmap” type indicator plots the returned values of the RSI oscillator for all its calculated periods between the values of “StartPeriod” up to “MaxScale”. Each value is colored according to its degree of over-sold (in red) and over-bought (in green).

The ensemble thus forms a cloud of colored dots making it easy to better identify how the market behaves in the different dimensions.

It is thus possible to determine the best opportunities for positions in trend following or mean reversion without wondering what is the best period of observation with respect to the  instrument and the timeframe used. .

Many ideas can sprout from the observation of this type of indicator, I let you work 🙂

Idea came from another indicator development from that topic.


Share this

Risk disclosure:

No information on this site is investment advice or a solicitation to buy or sell any financial instrument. Past performance is not indicative of future results. Trading may expose you to risk of loss greater than your deposits and is only suitable for experienced investors who have sufficient financial means to bear such risk.

ProRealTime ITF files and other attachments : How to import ITF files into ProRealTime platform?

PRC is also on YouTube, subscribe to our channel for exclusive content and tutorials
  1. Maxime Baudin • 06/28/2019 #

    Very intresting! Thanks Nicolas

  2. Fr7 • 06/28/2019 #

    Es muy interesante….¿Podría realizar el screener que detecte los valores cuando en el heatmap está rojo o verde?

    • Nicolas • 06/28/2019 #

      Sí, pero podríamos estar limitados a los períodos debido a las limitaciones de 255 barras de ProScreener, pero ¿por qué no?

  3. Fr7 • 06/28/2019 #

    Podríamos probar el proscreener y así ayudaría a encontrar los valores que acaban de dar señal¿Cómo sería el screener Nicolas?

    • Nicolas • 06/28/2019 #

      Por favor, abra un tema en el foro para esta aplicación de filtro.

  4. ggolfet • 06/28/2019 #

    I tried to use it (with prorealtime version 11 – end of day version). I receive an error message regardind an infinite loop or too much iteractions. I tried decreasing the end period of the loop, but the error message still remains. I’m not able to find a solution, has anyone the same problem? thanks in advance

    • Nicolas • 06/28/2019 #

      Try to reduce the displayed units of the chart.
      MaxScale should always be superior to StartPeriod.

  5. ggolfet • 06/28/2019 #

    Thanks Nicolas, I imported the itf file and solved the problem.

  6. Hasardeur • 06/28/2019 #

    Hallo Nicolas,

    i tried to code the multi period heat map in combination with the Ehler’s market mode.
    https://www.prorealcode.com/prorealtime-indicators/market-mode/
    The code it self is easy to realize, but I see different results by
    – Calculation the market mode by using a single period for example 20
    – Calculation the heat map by using while loop
    Same I see by calculation other indicators.
    All are using band pass filter with look back days.
    I expect that the look back days [1] [2] [3] in combination with the while loop are causing the problem.
    It would be very helpful, if you could have a look for these problem.
    Many thanks in advance.

    Best regards
    Hasardeur

    • Nicolas • 06/28/2019 #

      Please open a new topic with the code in forum.

avatar
Register or

Likes

avatar avatar avatar avatar avatar avatar avatar avatar avatar avatar
Related users ' posts
Madrosat I Have not see a fully functioning automated strategy on your site?? Really have you???
juanj Hi Madrosat, why would it be on my site? I have developed it for my personal use and also to...
Madrosat ok I understood you are using prorealcode to hack the fish
mickey992 salut merci pour ton partage et ton travaille
patapouf Hi Vivien René I just discovered your “Ordered trend-following stocks Screener”. Great work...
afanitro424 its not plotting on chart but instead as it's own histogram directly below chart? How to fix...
Nicolas by adding the indicator on the chart :)
Nicolas Oui c'est possible. Merci de ne pas poster des demandes qui sont hors sujets. Pour les deman...
Igor Merci pour cet itf. Question : comment faire pour instruire un screener ?
Nicolas tester le croisement du Close avec la première valeur de l'indicateur : "TrailingStop", faci...
imonix Have been trying this on demo since Monday before deciding whether to go live with it. Using...
Roberto Blázquez I'm sorry, I've tried it since November 2012 and it's bad results.
Dunstan I would like to get guidance_ How do I access and attach this indicator to my MT5 platform...
Nicolas You can't, use prorealtime, it's way better
jc84 Thank you very much for this indicator , not provided by PRT I was actually working at thi...
Nicolas Oui le code est correct et il fonctionne, j'ai de bons résultats sur la liste NASDAQ par exe...
pincherman Bonjour :-) J'ai coller le script dans prorealtime pour jouer avec le supertrend et j'ai un...
Nicolas Vous l'avez sans doute collé au mauvais endroit, dans l'éditeur de code pour les stratégies,...
IV Mcm Bonjour, Je ne reconnais pas cette ligne dans le code, essayer de télécharger directement le...
Manu L. Bonjour, Possible de créer un screnner multiframe Mois dans Ichimoku semaine dans Ichimok...
Guillaume Mcm I gave the above message fix ;)
Tradingrob Is it possible to put the itf-file in the right way here in Prorealcode? so the right 'trend...
Guillaume Mcm Update link ;) https://www.prorealcode.com/topic/trend-histogramme-cci-mise-a-jour-suite-...
woktrade Superbe !
Vonasi An updated version with a bug fix can be found here: https://www.prorealcode.com/topic/dis...
snucke hey Vonasi is it possible you can help me get this indicator to show how much a market mo...
kbrooks323 Hello would someone be willing to release a scan code for this? that would be helpful as I s...
Nicolas You can do easily this screener by using the assisted creation tool. It would take you about...
kbrooks323 I just figured it out thanks!
Screw27 Salut nicolas j'aimerais savoir tes résulats grace a cettte methode
eva.g.forsgren It dose not work, I get a strap instead of candels???????????????????????????????????????????
Nicolas That indicator is the one below the chart. The indicator to put on the price chart is this o...
pyhrus P.S : IG , que j'ai contacté ,m'indique que la version V11 , ne sera pas disponible avant un...
Hasardeur Dear Nicolas, is there someting at the arry to modify in order to run the trend at the actu...
MALIMALO Dear Nicolas, just try touse your indicator with backtest but it's not working. is anybody...
ribes65 Bonjour Nicolas, Merci pour votre travail. Est-il envisageable de créer un screener pour ...
Nicolas Bien sûr, merci de formuler une demande dans le forum des screeners pour prorealtime. En res...
ipbvba Est il possible de le transformer en indicateur (pour ne plus avoir les lignes mais uniqueme...
Vinks_o_7 Vonasi you're a beast !!! ;-)))
pableitor Amazing indicator , you are pushing PRT to the limit! But looking at the scatter its not c...
Vinks_o_7 Thanks Doc !
Maxime Baudin Intresting, thank you!
Zigo
4 years ago
fifi743 Good morning, there is no mistake about the shorts c11=SMI[14,3,5](close)>-40
Zigo has to be c11=SMI[14,3,5] < -40 (indeed)
xar3 Thank you ;-) Zigo
Sapo Thank you very much. as always your indicators are extremely effective. kind regards Vonasi.
mitsu21 Hi, it looks nice. I'll try it tomorrow thank you for your share kind regards bruno
kj1988 Thank you Vonasi for sharing this indicator. Very useful as a comfirmation to the price act...
Byggtrader Hi Nicolas! How do I get the indicator in the price chart? It only stays under i new chart.
Nicolas Just add it on the price chart by using the wrench on the left upper side of the chart (pric...

Top