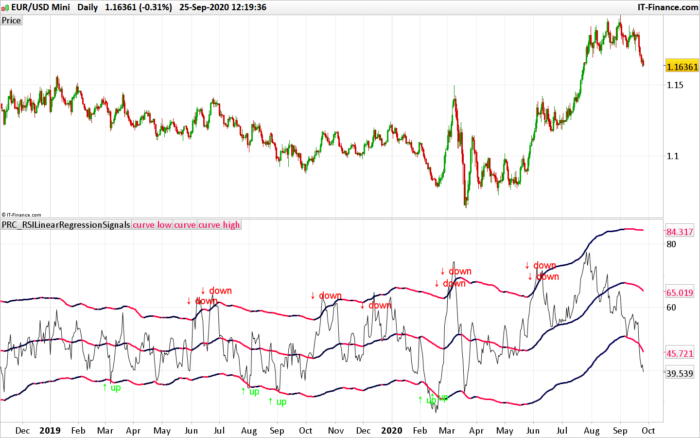
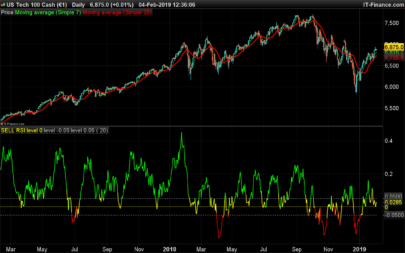
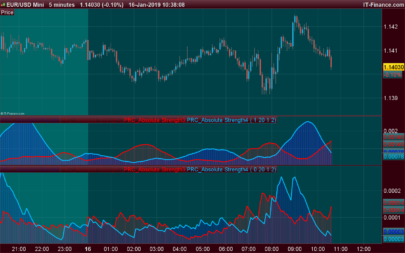
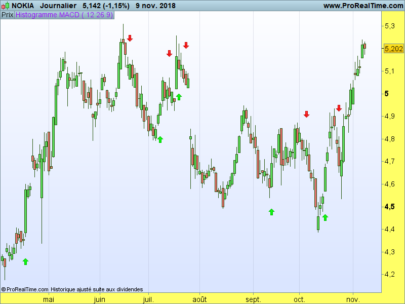
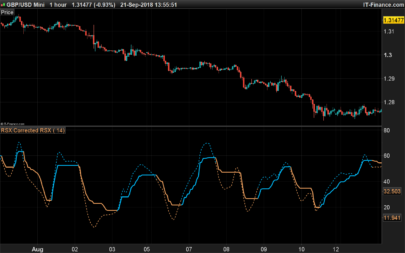
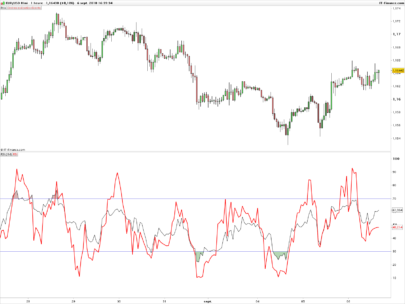
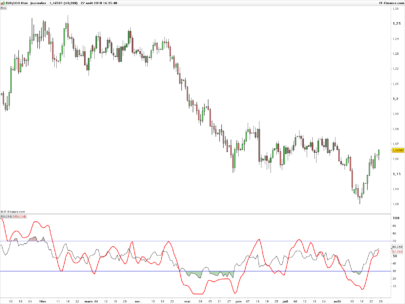
Trading signals based upon a linear regression channel applied to a classic RSI indicator.
If the RSI exceeds the upper band, the price should reverse to its mean and therefore a sell signals is announced.
If the RSI breaks the lower band, the price should reverse to its mean and a buy signals is plotted on the indicator.
You can adjust the RSI period of calculation (with variable ‘len’) and the linear regression channel period with “period”. The upper and lower band spread can be adjusted with the “deviations” setting (default is a 2 times multiplier from the mean).
|
1 2 3 4 5 6 7 8 9 10 11 12 13 14 15 16 17 18 19 20 21 22 23 24 25 26 27 28 29 30 31 32 33 34 35 36 37 38 39 40 41 42 43 44 45 46 47 48 49 50 51 52 53 54 55 56 57 58 59 60 61 62 63 64 65 66 |
//PRC_RSILinearRegressionSignals| indicator //25.09.2020 //Nicolas @ www.prorealcode.com //Sharing ProRealTime knowledge //converted from tradingview //https://www.prorealcode.com/topic/rsi-linear-regresion/ // --- settings len = 21 //RSI Length period = 200 //Period deviations = 2.0 //Deviation(s) // --- end of settings irsi = rsi[len](close) periodMinusOne = period-1 Ex = 0.0 Ey = 0.0 Ex2 = 0.0 Exy = 0.0 for i=0 to periodMinusOne closeI = (irsi[i]) Ex = Ex + i Ey = Ey + closeI Ex2 = Ex2 + (i * i) Exy = Exy + (closeI * i) ExEx = Ex * Ex next //slope if Ex2=ExEx then slope = 0.0 else slope= (period * Exy - Ex * Ey) / (period * Ex2 - ExEx) endif ilinearRegression = (Ey - slope * Ex) / period intercept = ilinearRegression + barindex * slope deviation = 0.0 for i=0 to periodMinusOne deviation = deviation + square((irsi[i]) - (intercept - slope * (barindex[i]))) next deviation = deviations * sqrt(deviation / periodMinusOne) startingPointY = ilinearRegression + slope / periodMinusOne //lineColor if startingPointY > startingPointY[1] then //color.blue r=0 b=255 else //color.red r=255 b=0 endif a = startingPointY-deviation c1 = startingPointY b = startingPointY+deviation up=irsi crosses over a down=irsi crosses under b if up then drawtext("↑ up",barindex,irsi-5,dialog,standard,20) coloured(0,255,0) endif if down then drawtext("↓ down",barindex,irsi+5,dialog,standard,20) coloured(255,0,0) endif return irsi, a coloured(r,0,b) style(line,3) as "curve low",c1 coloured(r,0,b) style(line,3) as "curve", b coloured(r,0,b) style(line,3) as "curve high" |
Share this
No information on this site is investment advice or a solicitation to buy or sell any financial instrument. Past performance is not indicative of future results. Trading may expose you to risk of loss greater than your deposits and is only suitable for experienced investors who have sufficient financial means to bear such risk.
ProRealTime ITF files and other attachments :
Find other exclusive trading pro-tools on ![]()
PRC is also on YouTube, subscribe to our channel for exclusive content and tutorials


On this way of exploiting the RSI, read the article by Samuel Rondot:
https://www.abcbourse.com/analyses/chronique-80_de_taux_de_reussite_sur_le_cac_40_en_15_ans-203.
Thanks .
How can I made a difference betteen the high and low deviation?
In this article, the author uses the standard deviation from the mean of the RSI, in this case this indicator is not the same, use this one instead: https://www.prorealcode.com/prorealtime-indicators/rsi-self-adjusting-bands/
Hello ,
is it possible to use this in a MTF screener without getting this fault?
This ProScreener market scan cannot be executed because there is an infinite loop within the program code.
An infinite loop is a sequence of instructions which repeats itself endlessly when the code is executed. This may happen if:
– the loop doesn’t have a termination condition
– the termination condition can never be met
– the termination causes the loop to start over
To run the scan, modify the code of your ProScreener.
Sure, please open a new topic in the ProScreener section of the forum for that specific query. Please respect the posting rules also. Thanks.
I try to ad this indicator on DAX or EurUSD on M5 and on tick chart but nothing appears on the price chart. What can be the problem ?
Try to expand the units displayed on your chart. Or use this simplified code which is the same: https://www.prorealcode.com/topic/infinite-loop-issue/#post-146094
how would one incorporate an alarm at the buy/sell signal?
Change the last line with: return irsi, a coloured(r,0,b) style(line,3) as “curve low”,c1 coloured(r,0,b) style(line,3) as “curve”, b coloured(r,0,b) style(line,3) as “curve high”,up,down
and use the alert tool from the platform with “up” and “down” returned signals.
Thank you sir!!
Nicolas…….does this mean that I will now automatically have an alarm on every buy/sell signal? or will I have to manually reset it for every buy/ sell signal?
….also note in the alarm settings that for this indicator you cannot get an email email notification?
email notification are not available for custom indicators.
You are using variables “r” abd “b” for the color red and blue but unfortunately after setting r or b to 255, you reset b with
b = startingPointY+deviation
Do you rely on prorealcode knowing difference between integer b (255) and floating point b (deviation), or was this a mistake?
good spot! indeed, that’s a mistake. Change the variable name for the b color, while I don’t think it would change the calculation result of the indicator itself.
Bonjour Nicolas, comment coder un indicateur de rsi de Divergence? Merci pour ta réponse
En apprenant la programmation 🙂 Plus sérieusement, il y a quantité d’exemples dans la library et dans les forums.
Bonjour Nicolas,
Très bel indicateur! Bravo!
Awesome work Nicolas! By any chance, do you have the Screener version for this “RSI and Linear Regression trading signals”. I tried to convert the indicator to screener by replacing the drawing at the end i.e. “SCREENER[Signal](Signal AS “1=↑, 2=↓”)”, where I use the Signal =1 or 2 to replace the two condition of drawing in the codes … but at the end I always get the error “Syntax error: This variable is not used in the {did not show any further info}”. It would complete your indicator perfectly if you can add the screener here for us. Thank you and Best regards.
Please open a topic in ProScreener forum with your query, I’ll reply you there. Thank you.
Thanks Nicolas, I post my question, along with the codes I am trying to convert from your indicator, in the ProScreener Forum… So please review there. Thanks again.
I replied to your post here: https://www.prorealcode.com/topic/screener-for-rsi-and-linear-regression-trading-signals/#post-218189