1. Introduction
The QQE, or Quantitative Qualitative Estimation, is a technical indicator that combines a smoothed RSI with trend-following elements to provide clearer, more visual signals regarding market momentum and direction shifts.
This indicator enhances its detection capabilities by using two independent smoothed RSI calculations, adaptive dynamic bands, and a color-coded signal system that makes it easy to spot favorable market conditions for entry or exit.
The result is a more visual, intuitive, and versatile indicator—ideal for traders looking to confirm trend reversals or support trend-following strategies with a clean momentum read.
2. Indicator Logic
The QQE is primarily based on the calculation of a smoothed RSI, which is then enveloped by dynamic trailing-stop-style bands. These bands define whether the RSI has broken previous structure and is entering a new market phase, interpreted in terms of bullish or bearish trend.
The core logic is to measure the RSI’s volatility using a calculation similar to the ATR, forming a kind of “comfort zone” around the RSI line. A break of that zone indicates a potential momentum or trend shift.
In this version, two independent QQE calculations are used:
- The first one to detect trend changes.
- The second to strengthen the signal using additional filters, including overbought/oversold conditions and Bollinger Bands.
3. QQE Components
This indicator is built from several layers working together to generate accurate and visual signals:
-
RSI1 and trend definition: A short-period RSI (default: 6) is calculated and smoothed with an exponential average. From this, two bands (longband and shortband) are built, acting as dynamic breakout levels. When the RSI crosses one of them, the indicator detects a trend phase shift.
-
RSI2 as a confirmation signal: A second smoothed RSI is used as a filter layer. Its value relative to the 50 level helps determine whether bullish or bearish momentum is dominant.
-
Bollinger Bands on the QQE: Bollinger Bands are applied to the Fast QQE line (RSI1), centered around its value minus 50. These bands highlight overbought or oversold conditions relative to recent market behavior.
-
Signal and color logic: The main visual cue is the qqe histogram, which only changes color when two conditions are met:
- RSI2 indicates strong momentum (above or below threshold).
- RSI1 breaks out of the Bollinger Bands.
When both are true, a strong signal is generated in blue (bullish) or fuchsia (bearish). Otherwise, the histogram remains neutral in grey.
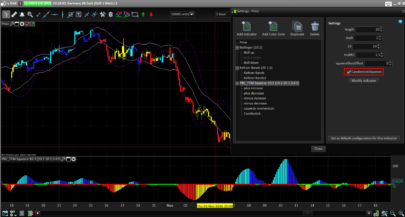
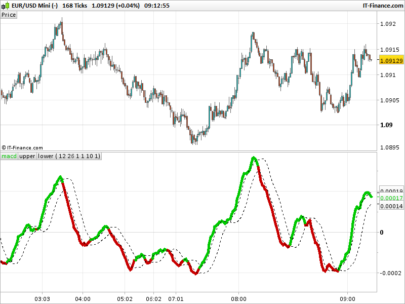
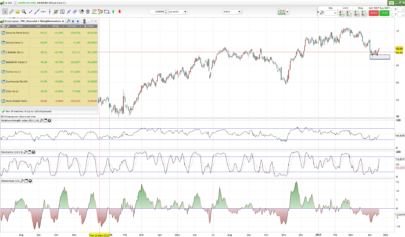
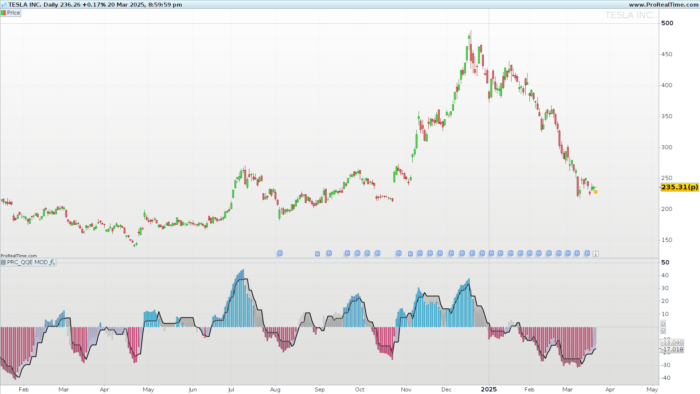
4. Chart Interpretation
The indicator shows three key visual elements:
-
Main histogram (QQE): Centered on level 0 (which corresponds to RSI level 50). A colored histogram (blue or fuchsia) signals strong impulse; a grey one indicates neutral or weak confirmation.
-
Trendline (QQE Line): Displays the dynamic band of RSI2, adjusted to center around 0. It helps detect overall direction and potential reversals.
-
Background histogram (Histo2): Shows the centered value of RSI2. It can help anticipate momentum shifts but should not be used as a standalone signal.
Reading all three together provides a comprehensive view of momentum, trend direction, and potential exhaustion points.
5. Indicator Settings
The QQE comes with several customizable parameters to suit different trading styles and instruments:
rsiPeriod(default 6): RSI period for RSI1.SF(default 5): Smoothing factor for RSI1.QQE(default 3): Multiplier for RSI1 dynamic band.ThreshHold(default 3): Threshold for signal triggering.length(default 50): Period for Bollinger Bands.mult(default 0.35): Standard deviation multiplier for Bollinger Bands.
For the second RSI (RSI2), similar parameters are provided, with QQE2 set by default to 1.61 for increased sensitivity.
Tuning tips:
- For lower timeframes (1 min, 5 min), reduce RSI periods and increase the threshold slightly to filter out noise.
- For higher timeframes (4H, daily), default values work well, though you may adjust
multto control Bollinger Band tightness.
This indicator is especially useful as a confirmation filter in trend-following strategies or as a signal generator in momentum-based scalping systems. Its modular, color-coded design allows for quick interpretation even in volatile market conditions.
|
1 2 3 4 5 6 7 8 9 10 11 12 13 14 15 16 17 18 19 20 21 22 23 24 25 26 27 28 29 30 31 32 33 34 35 36 37 38 39 40 41 42 43 44 45 46 47 48 49 50 51 52 53 54 55 56 57 58 59 60 61 62 63 64 65 66 67 68 69 70 71 72 73 74 75 76 77 78 79 80 81 82 83 84 85 86 87 88 89 90 91 92 93 94 95 96 97 98 99 100 101 102 103 104 105 106 107 108 109 110 111 112 113 114 115 116 117 118 119 120 121 122 123 124 125 126 127 128 129 130 131 132 133 134 135 136 137 138 139 140 141 142 143 144 145 146 147 |
//PRC_QQE MOD //version = 0 //08.04.24 //Iván González @ www.prorealcode.com //Sharing ProRealTime knowledge //-----Inputs-----------------------------------------------// rsiPeriod=6//RSI Length SF=5//RSI Smoothing QQE=3//Fast QQE Factor length=50//Bollinger Length mult=0.35//BB Multiplier rsiPeriod2=6//RSI Length SF2=5//RSI Smoothing QQE2=1.61//Fast QQE Factor ThreshHold2=3//Thresh-hold src=close src2=close //----------------------------------------------------------// //-----RSI1 calculations and trend definition---------------// WildersPeriod = rsiPeriod*2-1 myrsi=rsi[rsiPeriod](src) rsiMA=average[SF,1](myrsi) atrRSI=abs(rsiMA[1]-rsiMA) MAatrRSI=average[WildersPeriod,1](atrRSI) dar = average[WildersPeriod,1](MAatrRSI)*QQE longband=0 shortband=0 trend=0 DeltaFastAtrRsi = dar RSIndex = rsiMA newshortband = RSIndex + DeltaFastAtrRsi newlongband = RSIndex - DeltaFastAtrRsi if RSIndex[1] > longband[1] and RSIndex > longband[1] then longband=max(longband[1],newlongband) else longband=newlongband endif if RSIndex[1] < shortband[1] and RSIndex < shortband[1] then shortband=min(shortband[1], newshortband) else shortband=newshortband endif cross1 = longband[1] crosses over RSIndex or longband[1] crosses under RSIndex if shortband[1] crosses over RSIndex or shortband[1] crosses under RSIndex then trend=1 FastAtrRsiTL=longband elsif cross1 then trend=-1 FastAtrRsiTL=shortband else trend=trend[1] endif //----------------------------------------------------------// //-----Bollinger Bands--------------------------------------// basis=average[length,0](FastAtrRsiTL-50) dev=mult*std[length](FastAtrRsiTL-50) upper=basis+dev lower=basis-dev //----------------------------------------------------------// //-----RSI2 calculations and trend definition---------------// WildersPeriod2 = rsiPeriod2*2-1 myrsi2=rsi[rsiPeriod2](src2) rsiMA2=average[SF2,1](myrsi2) atrRSI2=abs(rsiMA2[1]-rsiMA2) MAatrRSI2=average[WildersPeriod2,1](atrRSI2) dar2 = average[WildersPeriod2,1](MAatrRSI2)*QQE2 longband2=0 shortband2=0 trend2=0 DeltaFastAtrRsi2 = dar2 RSIndex2 = rsiMA2 newshortband2 = RSIndex2 + DeltaFastAtrRsi2 newlongband2 = RSIndex2 - DeltaFastAtrRsi2 if RSIndex2[1] > longband2[1] and RSIndex2 > longband2[1] then longband2=max(longband2[1],newlongband2) else longband2=newlongband2 endif if RSIndex2[1] < shortband2[1] and RSIndex2 < shortband2[1] then shortband2=min(shortband2[1], newshortband2) else shortband2=newshortband2 endif cross2 = longband2[1] crosses over RSIndex2 or longband2[1] crosses under RSIndex2 if shortband2[1] crosses over RSIndex2 or shortband2[1] crosses under RSIndex2 then trend2=1 FastAtrRsiTL2=longband2 elsif cross2 then trend2=-1 FastAtrRsiTL2=shortband2 else trend2=trend2[1] endif //----------------------------------------------------------// //-----Color definition------------------------------------// if rsiMA2-50>ThreshHold2 then r=178 g=181 b=190 a=100 elsif rsiMA2-50<0-ThreshHold2 then r=178 g=181 b=190 a=100 else r=178 g=181 b=190 a=0 endif //----------------------------------------------------------// //-----Checkings and colors---------------------------------// greenbar1=rsiMA2-50>ThreshHold2 greenbar2=rsiMA-50>upper redbar1=RsiMa2-50<0-ThreshHold2 Redbar2 =RsiMa-50<lower if greenbar1 and greenbar2 then qqe=rsiMA2-50 rb=0 gb=195 bb=255 elsif redbar1 and redbar2 then qqe=rsiMA2-50 rb=255 gb=0 bb=98 else qqe=0 rb=120 gb=123 bb=134 endif //----------------------------------------------------------// zero=0 return qqe as "QQE" coloured(rb,gb,bb)style(histogram),FastAtrRsiTL2-50 as "QQE Line"coloured("Black")style(line,2),rsiMA2-50 as"Histo2"coloured(r,g,b,a)style(histogram) ,zero as "Zero" coloured("white")style(dottedline) |
Share this
No information on this site is investment advice or a solicitation to buy or sell any financial instrument. Past performance is not indicative of future results. Trading may expose you to risk of loss greater than your deposits and is only suitable for experienced investors who have sufficient financial means to bear such risk.
ProRealTime ITF files and other attachments :
Find other exclusive trading pro-tools on ![]()
PRC is also on YouTube, subscribe to our channel for exclusive content and tutorials