




More from ProRealCode
ProRealCode - Trading & Coding with ProRealTime™
The ProRealTime™ community on the web! Officially sharing ProRealTime knowledge to Worldwide users since 2015!



TTM Squeeze fired screener
May 1, 2017, 3:08 PM
Screeners
1 Comment
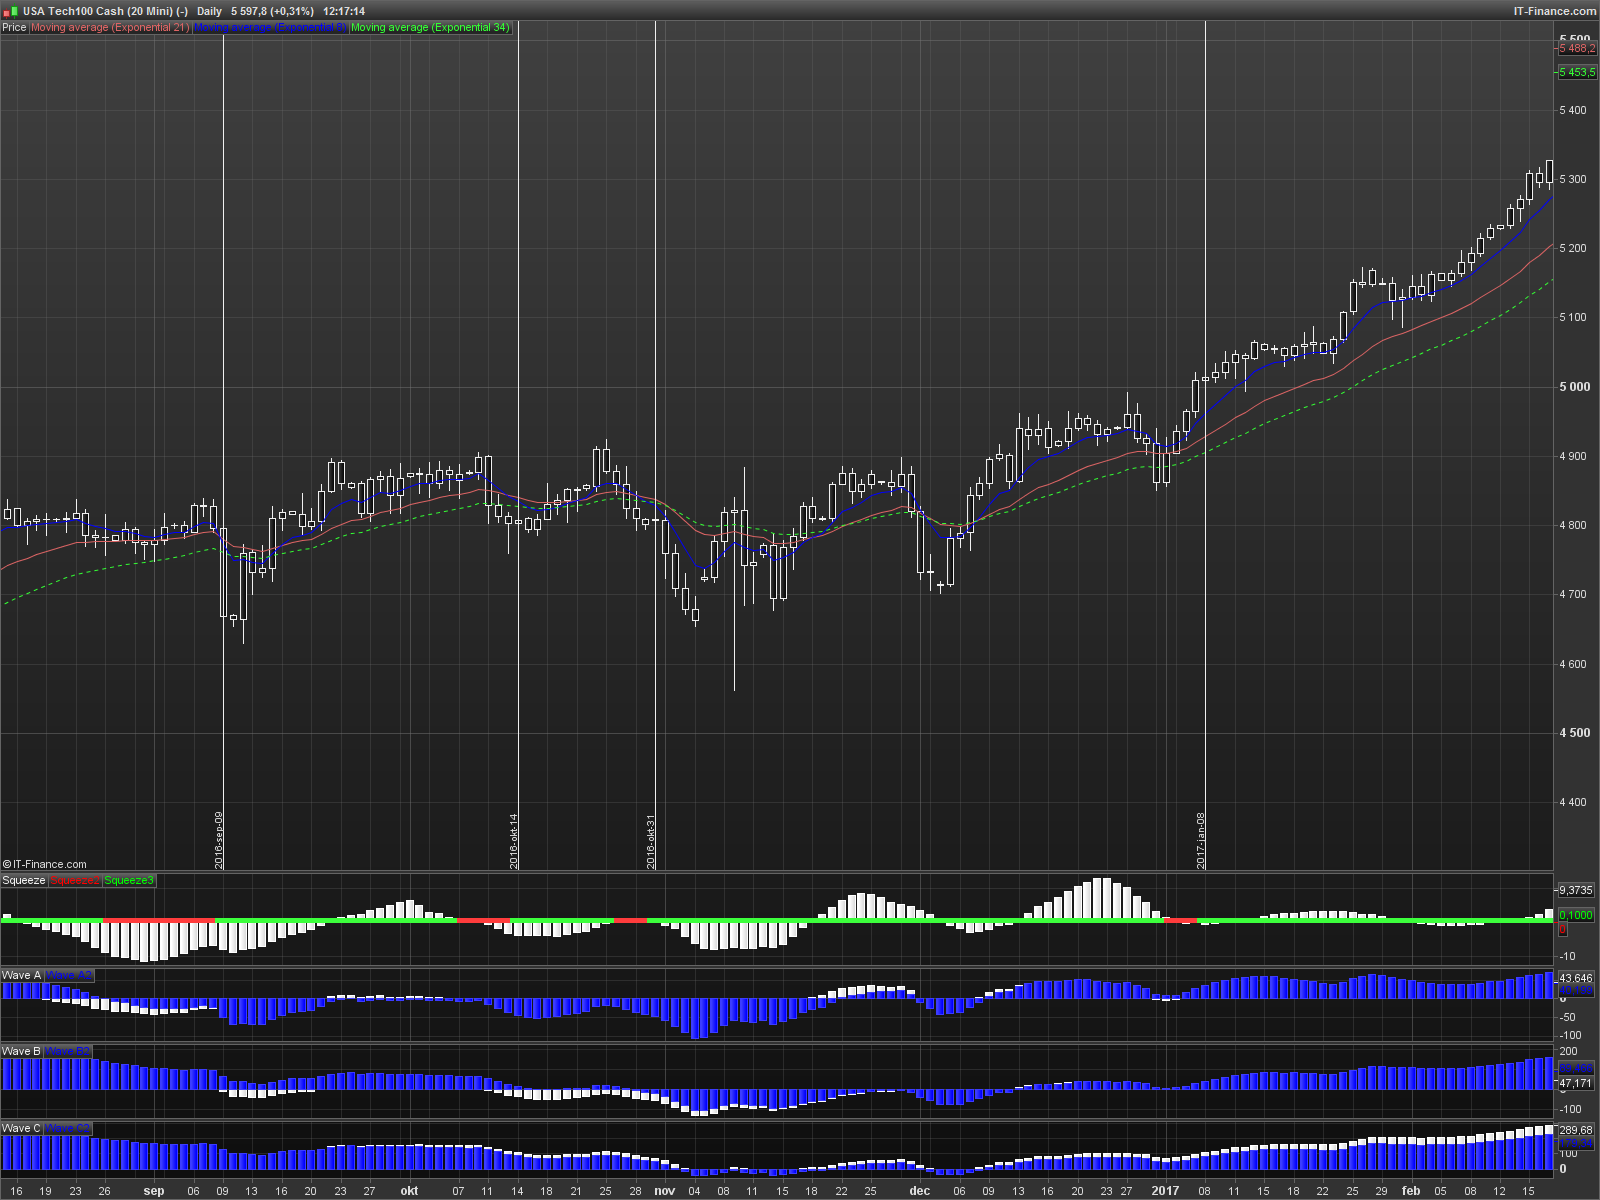
This screener returns John Carters squeeze indicator that have left a “squeezed state”.
The indicator goes from red to green, meaning that it Bollinger bands are going from inside the Keltner channel to outside.
This indicates more volatility could be expected going forward.
// Indata
DUpperKC = exponentialaverage [20](close) + 1.5*averagetruerange[20](close)
DLowerKC = exponentialaverage [20](close) - 1.5*averagetruerange[20](close)
BolUp = BollingerUp[20](close)
BolDown = bollingerdown[20](close)

// Check bollinger bands inside Keltner chanel
c1 = bolup[1] < DUpperKC[1]
c2 = boldown[1] > DLowerKC[1]

// Check bollinger band outside Keltner chanel
c3 = bolup > DUpperKC
c4 = boldown < DLowerKC
fired = c3 or c4

//Check if trend is weak
adx14 = adx[14] < 20

// Return squeeze fired and weak trend
screener[c1 and c2 and fired and adx14]
Download
Filename:
Squeeze-fired.itf
Downloads:
440
Average
Developer by day, aspiring writer by night. Still compiling my bio... Error 404: presentation not found.
Author’s Profile
Similar code
Macd-Squeeze.Indicators
Squeeze LightIndicators
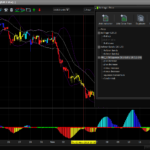
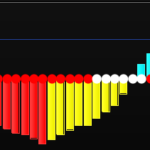
TTM Squeeze ProIndicators
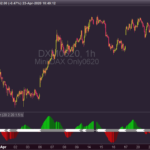
Squeeze Momentum IndicatorIndicators
Loading...
An answer to a query that has been posted in the squeeze indicator: https://www.prorealcode.com/prorealtime-indicators/ttm-squeeze-oscillator-price-version/#comment-4334 To get a "fired" that occurred during the last 5 bars, the line 14 could be changed to fired = highest[5](c3 or c4)=1 Of course the "5" bars lookback quantity could be changed to any other value.