

Parabolic RSI Indicator
1. Introduction
The Parabolic RSI is a custom technical indicator designed to combine two of the most recognized tools in technical analysis: the Relative Strength Index (RSI) and the Parabolic SAR, applied in an innovative way. Instead of applying the Parabolic SAR to prices, this indicator calculates it directly on the RSI value, allowing for more precise detection of directional changes in the market’s relative strength.
This hybrid approach facilitates the identification of potential trend reversal points before they are directly reflected in price, providing traders with an additional tool to anticipate market moves. Ideal for both short- and medium-term traders, the Parabolic RSI is especially useful in high-volatility scenarios or when more refined entry and exit signals are needed.
2. What is the Parabolic RSI?
To understand how the Parabolic RSI works, it is necessary to briefly explain the two indicators that compose it:
- RSI (Relative Strength Index): an oscillator that measures the speed and change of price movements. It ranges from 0 to 100 and is commonly interpreted as overbought when RSI exceeds 70 and oversold when it falls below 30.
- Parabolic SAR (Stop and Reverse): a trend-following indicator used to determine entry and exit points. It is plotted as a series of dots on the chart, appearing below price during an uptrend and above price during a downtrend.
The innovation of the Parabolic RSI lies in using the RSI value instead of price to apply the Parabolic SAR calculation. This allows for more sensitive detection of shifts in market dynamics, anticipating potential trend changes through the evolution of relative strength rather than just price.
3. Indicator Logic
The Parabolic RSI calculates a Parabolic SAR not on price, as is traditional, but directly on the RSI value. This adaptation follows the same mechanics as the standard SAR, but with RSI as the data source.
Here is a summary of the process:
- Calculation Start: At the beginning of the historical data, necessary variables are initialized: the RSI value as a base, the movement extremes (highs and lows), the initial acceleration factor (
initial), and its limit (limite). - SAR Update: Depending on the movement direction (bullish or bearish), the indicator adjusts its SAR:
- If the trend is bullish, the SAR is adjusted toward the most recent RSI high.
- If the trend is bearish, the SAR moves closer to the most recent RSI low.
- Conditions are included to prevent the SAR from exceeding previous values, in order to avoid false signals.
- Reversal: A direction change occurs when the RSI value crosses the calculated SAR level. At that point:
- The trend direction (
islong) is reversed. - Extremes are reset, and the acceleration factor is reinitialized.
- The trend direction (
- Dynamic Adjustment of the Acceleration Factor (
af): This factor increases as the movement continues in the same direction, causing the SAR to move closer to the RSI more quickly, enabling faster trend reversal detection.
This logic turns the Parabolic RSI into an adaptive tool, capable of dynamically responding to shifts in market strength, detecting both trend continuations and potential reversals in the RSI.
4. Generated Signals
The Parabolic RSI not only provides a visual representation of the RSI trend through Parabolic SAR-style dots but also generates clear entry and exit signals:
- Buy Signal (sigUp): Triggered when the direction changes from bearish to bullish (the Parabolic SAR on RSI shifts from above to below the RSI), and the SAR value is below the oversold threshold (level 30). This combination suggests a possible bullish reversal with increasing strength.
- Sell Signal (sigDn): Triggered when the direction changes from bullish to bearish and the SAR value exceeds the overbought threshold (level 70). This condition signals a possible bearish correction or the end of buying strength.
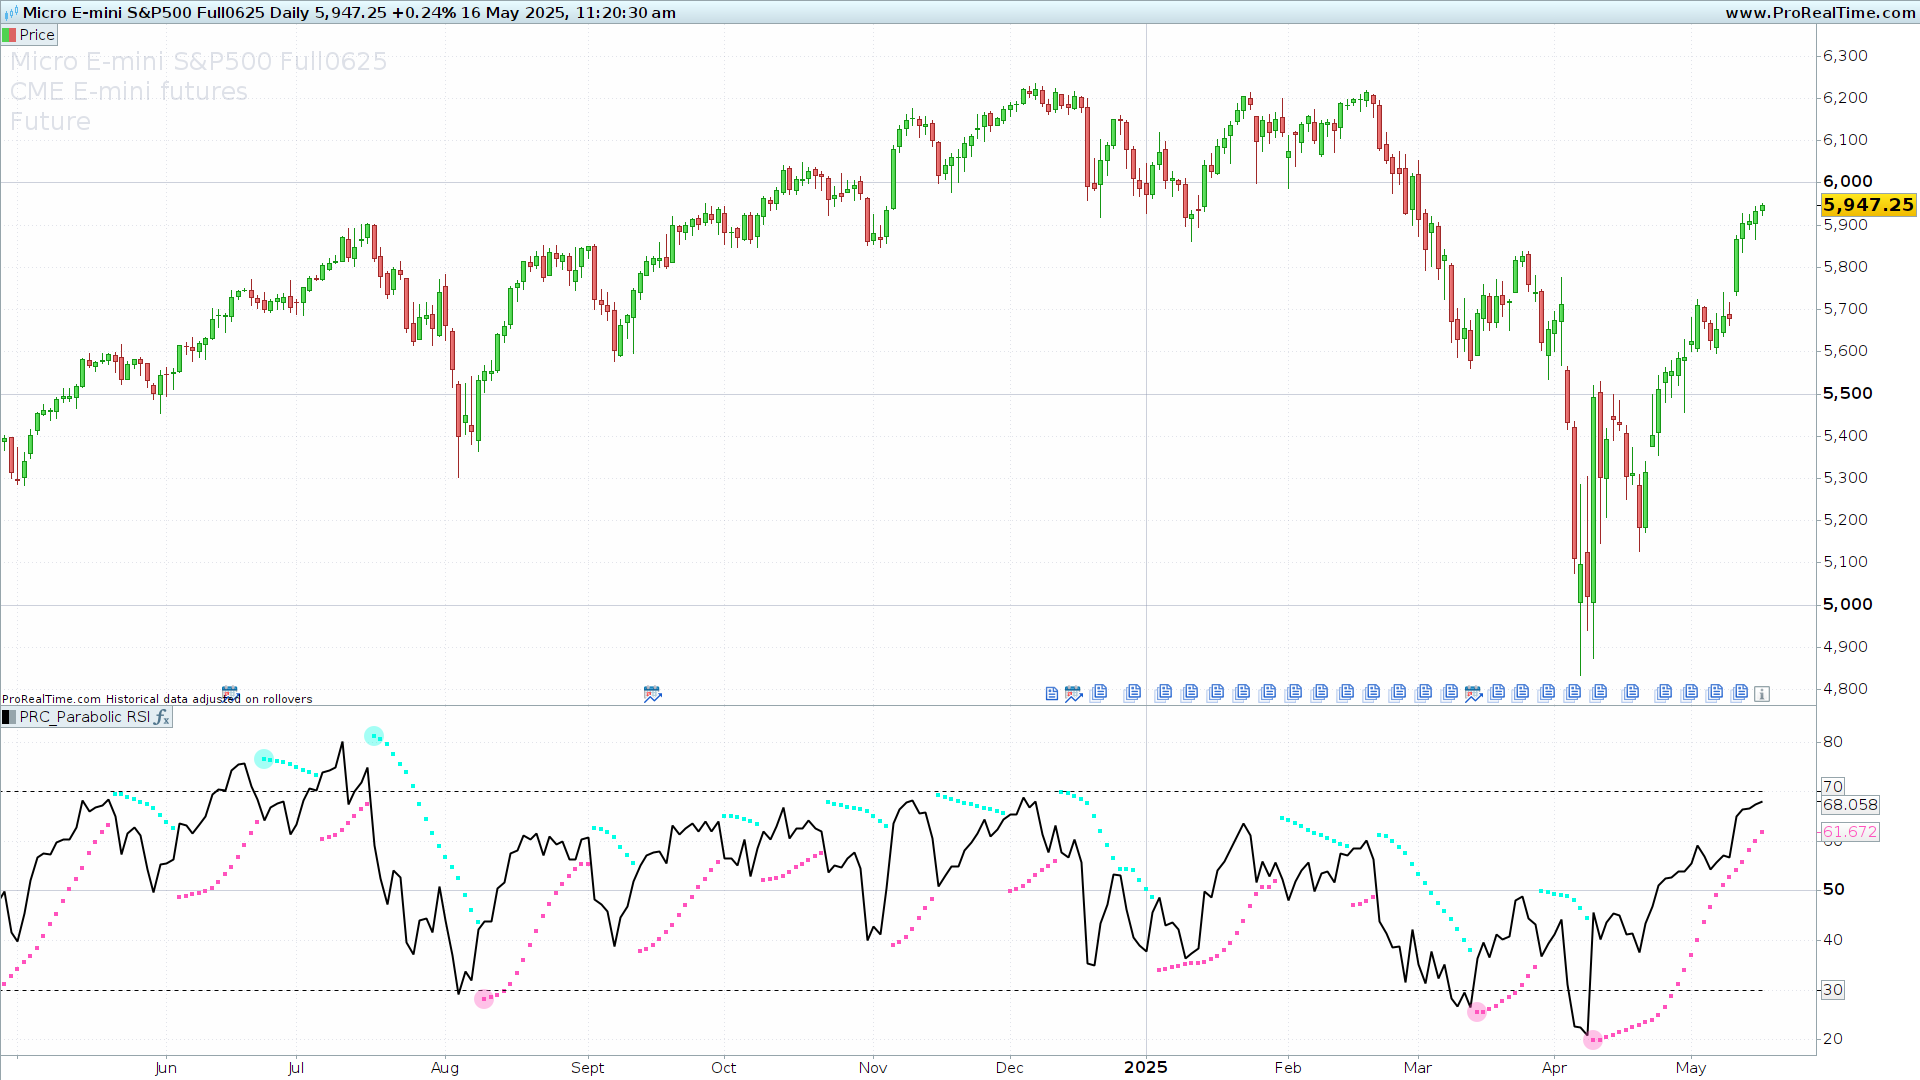
Both signals are displayed on the chart using distinct colored dots:
- Pink (RGB: 255,82,189) for bullish trend signals.
- Turquoise blue (RGB: 0,255,229) for bearish trend signals.
This signaling system allows traders to quickly identify entry or exit opportunities, integrating the strength of the movement (measured by RSI) with the directional change dynamics of the Parabolic SAR.
5. Indicator Settings
The Parabolic RSI allows users to adjust several parameters that directly affect the indicator’s sensitivity and precision. These are the default configurable values:
len = 14
This is the number of periods used to calculate the RSI. It is the standard value and typically provides a good balance between sensitivity and stability.upper = 70
Overbought level. If the RSI or SAR exceeds this level, the asset is considered overbought, which may anticipate a correction.lower = 30
Oversold level. If the RSI or SAR falls below this threshold, the asset is considered oversold, which may anticipate a rebound.initial = 0.02
Initial acceleration factor value for the SAR. The lower it is, the further the SAR is from the RSI, making it respond more slowly.increment = 0.02
Amount added to the acceleration factor each time a new extreme (RSI high or low) is reached. The higher the increment, the faster the SAR will adjust.limite = 0.2
Maximum limit for the acceleration factor. It prevents the SAR from getting too close too quickly and generating false signals.
These parameters can be modified according to each user’s trading style. For example, in more volatile markets, the upper and lower levels can be lowered, or initial can be increased for more conservative signals. For aggressive scalping strategies, len and initial could be reduced to improve response speed.
6. Code
//------------------------------------------//

//PRC_Parabolic RSI
//version = 0
//14.05.2025
//Iván González @ www.prorealcode.com
//Sharing ProRealTime knowledge
//------------------------------------------//
// Inputs
//------------------------------------------//
//--- RSI
len=14 // RSI Length
upper=70 // Overbought level
lower=30 // Oversold level
//--- PSAR
increment = 0.02
initial = 0.02
limite = 0.2
//------------------------------------------//
// RSI calculation
//------------------------------------------//
src=rsi[len](close)
//------------------------------------------//
// Parabolic SAR (RSI)
//------------------------------------------//
srchigh=src+1
srclow=src-1

if barindex<=len+2 then
Lparabolic=srclow
islong=1
af=limite
hp=srchigh
lp=srclow
else
if islong then
Lparabolic=Lparabolic+af*(hp-Lparabolic)
Lparabolic=min(Lparabolic,srclow[1])
Lparabolic=min(Lparabolic,srclow[2])
else
Sparabolic=Sparabolic+af*(lp-Sparabolic)
Sparabolic=max(Sparabolic,srchigh[1])
Sparabolic=max(Sparabolic,srchigh[2])
endif

reverse=0

if islong then
if srclow<Lparabolic then
isLong=0
reverse=1
Sparabolic=hp
lp=srclow
af=initial
endif
else
if srchigh>Sparabolic then
islong=1
reverse=1
Lparabolic=lp
hp=srchigh
af=initial
endif
endif

if reverse=0 then
if islong then
if srchigh>hp then
hp=srchigh
af=af+increment
af=min(af,limite)
endif
else
if srclow<lp then
lp=srclow
af=af+increment
af=min(af,limite)
endif
endif
endif
endif

if islong then
psarRSI=Lparabolic
r=255
g=82
b=189
else
psarRSI=Sparabolic
r=0
g=255
b=229
endif
//------------------------------------------//
// Signals
//------------------------------------------//
sigUp=islong<>islong[1] and islong and psarRSI<=lower
sigDn=islong<>islong[1] and islong=0 and psarRSI>=upper
if sigUP or sigDn then
drawpoint(barindex,psarRSI,5)coloured(r,g,b,90)
endif

//------------------------------------------//
return src as "RSI" style(line,2), psarRSI as "Parabolic SAR rsi" style(point,2)coloured(r,g,b), upper as "OB level" style(dottedline),lower as "OS level" style(dottedline)