

Saty Phase Oscillator
Introduction
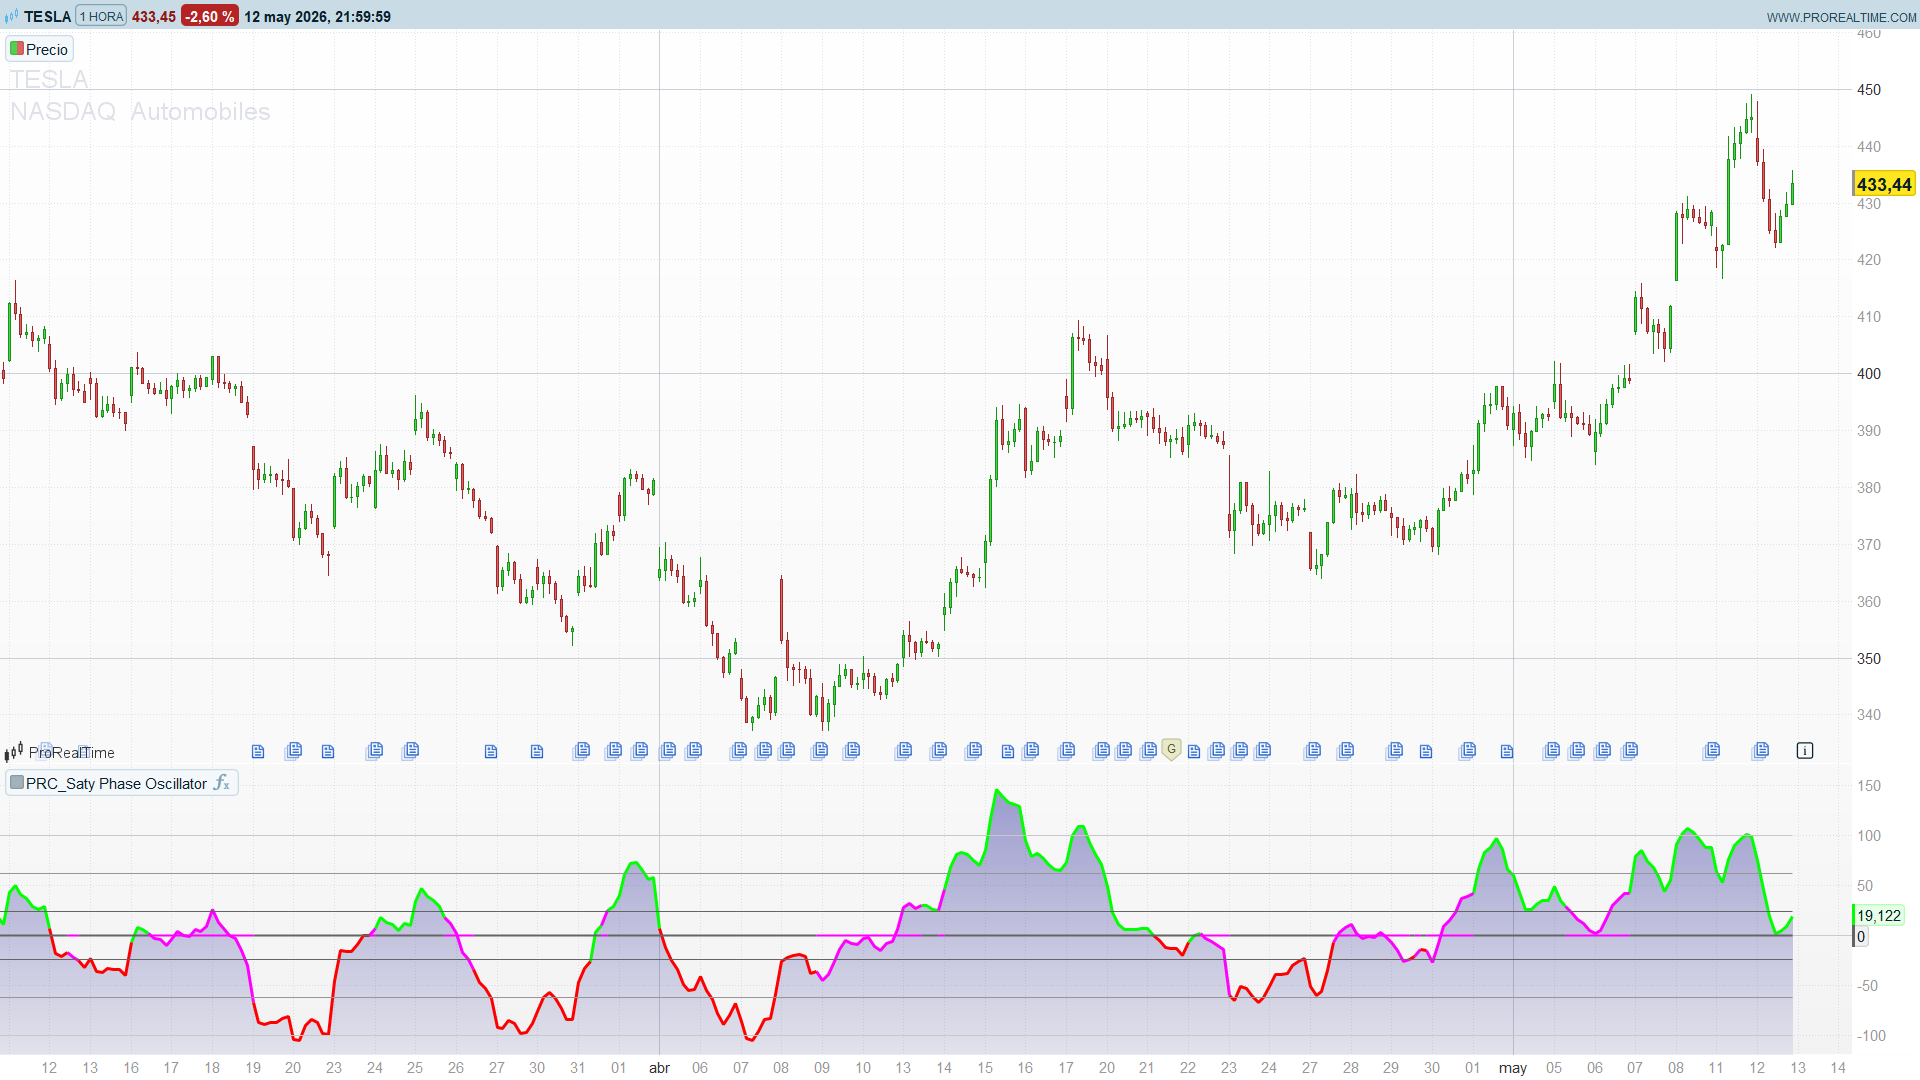
The Saty Phase Oscillator, designed by Saty Mahajan, condenses three classical building blocks — an EMA pivot, Average True Range and Bollinger Bands — into a single, easy-to-read oscillator that classifies the market into four operational phases: accumulation, mark-up, distribution and mark-down. On top of the phase reading, the indicator includes a compression detector that highlights low-volatility regimes where Bollinger Bands collapse inside the ATR envelope — typically the prelude to an expansion move.
It is a tool designed for traders who think in terms of where the market is in its cycle rather than in terms of overbought/oversold thresholds. The reading is always normalised — ±100 represents an extended move worth fading, ±61.8 marks the boundary between mark-up/mark-down and the extended zones, and ±23.6 defines the neutral band around the pivot.
Theory Behind the Indicator
The Pivot and the Normalised Distance
The oscillator is built around a simple anchor: an EMA(21) of the close, used as the dynamic pivot of the current swing. From there, the distance of price to the pivot is normalised by ATR(14):
raw_signal  = (close - pivot) / (3 * ATR(14)) * 100
oscillator  = EMA(3) of raw_signal
Dividing by 3 × ATR rescales price excursion into a roughly bounded range — most readings naturally fall between -100 and +100. The final EMA(3) smoothing removes single-bar spikes without lagging the signal in any meaningful way.
The Four Phases
Six horizontal levels split the oscillator’s range into four phases:
| Reading | Phase | Market behaviour |
|---|---|---|
| `> +100` | Extended bullish | Move stretched well beyond average volatility — fade candidates |
| `+61.8 to +100` | Distribution | Bullish strength, but approaching exhaustion |
| `+23.6 to +61.8` | Mark-up | Healthy bullish trend |
| `-23.6 to +23.6` | Neutral | Price hovering around the pivot |
| `-61.8 to -23.6` | Mark-down | Healthy bearish trend |
| `< -61.8` | Accumulation | Bearish strength, but approaching exhaustion |
The 61.8 / 23.6 levels are deliberately Fibonacci-flavoured but the indicator does not require any Fibonacci interpretation — they simply provide an aesthetically clean partition of the normalised space.
The Bollinger Compression Signal
The second layer of the oscillator is a volatility compression detector. It compares the width of the Bollinger Bands (21-period, 2 standard deviations) against an ATR-based reference band:
compression  = bbandUp  - (pivot + 2 * ATR)        // when above pivot
             = (pivot - 2 * ATR) - bbandDown       // when below pivot
When compression <= 0, the standard-deviation envelope has collapsed inside the ATR envelope — a classic sign of a volatility squeeze. The oscillator line then turns magenta and an explicit “Compression” panel is drawn in the top-right corner of the indicator, alerting the trader that an expansion move is statistically due.
The expansion criterion (expansion AND inExpansionZone > 0) cleanly resets the tracker once volatility has resumed.
Key Features at a Glance
| Feature | Behaviour |
|---|---|
| Pivot | EMA(21) of close |
| Normalisation | Distance to pivot divided by 3·ATR(14) |
| Smoothing | EMA(3) on raw signal |
| Phase zones | ±23.6 / ±61.8 / ±100 |
| Compression | Bollinger(21, 2σ) collapsed inside ±2·ATR |
| Dynamic colour | Green (bullish), red (bearish), magenta (compression) |
| HUD panel | `"Compression"` label drawn in the top-right corner when active |
How to Read the Indicator
- Phase awareness first. Look at which band the oscillator currently sits in to identify the dominant phase. A reading above +23.6 is constructive; below -23.6 is corrective; inside the neutral band, price is consolidating.
- Treat ±61.8 as the exhaustion warning. Crossing into the extended bands (>+61.8 or <-61.8) signals that the trend is strong but stretched.
- Fade the ±100 line. Whenever the oscillator pierces the outer bands, the move is statistically extended relative to ATR. Reversion towards the pivot is the high-probability outcome.
- Magenta = caution, then opportunity. The compression colour is not a signal to enter — it is a signal to prepare. When the colour returns to green/red, the breakout direction is confirmed.
- Zero line crosses. A cross of zero is a clean trend-change marker, because it reflects the close moving above (or below) the EMA(21) pivot.
Indicator Configuration
| Parameter | Default | Description |
|---|---|---|
| `length` | 21 | Period of the EMA pivot and of the Bollinger Bands |
| `multbb` | 2 | Standard-deviation multiplier for the Bollinger Bands |
The ATR period is fixed at 14 in line with Saty Mahajan’s original specification, but it can be edited inside the code if required. The EMA(3) final smoothing is hard-coded — a value of 1 removes smoothing entirely; values of 5 or higher start to lag the signal noticeably.
Code
//--------------------------------------------------------//
//PRC_Saty Phase Oscillator
//version = 0
//11.06.24
//Iván González @ www.prorealcode.com
//Sharing ProRealTime knowledge
//--------------------------------------------------------//
//-----Inputs---------------------------------------------//
length=21
multbb=2
//--------------------------------------------------------//
//-----Pivot Data-----------------------------------------//
pivot=average[length,1](close)
AbovePivot=close>=pivot
//--------------------------------------------------------//
//-----Bollinger Band Compression Signal------------------//
bbandOffset=multbb*STD[length](close)
bbandUp=pivot+bbandOffset
bbandDown=pivot-bbandOffset
compressionThresholdUp=pivot+2*averagetruerange[14]
compressionThresholdDown=pivot-2*averagetruerange[14]
expansionThresholdUp=pivot+1.854*averagetruerange[14]
expansionThresholdDown=pivot-1.854*averagetruerange[14]
if abovepivot then
   compression=bbandUp-compressionThresholdUp
   inExpansionZone=bbandUp-expansionThresholdUp
else
   compression=compressionThresholdDown-bbandDown
   inExpansionZone=expansionThresholdDown-bbandDown
endif
expansion=compression[1]<=compression
compressionTracker=0
if expansion and inExpansionZone>0 then
   compressionTracker=0
elsif compression<=0 then
   compressionTracker=1
endif
//--------------------------------------------------------//
//-----Phases---------------------------------------------//
extendedUpZone=100
distributionZone=61.8
neutralUpZone=23.6
neutralDownZone=-23.6
accumulationZone=-61.8
extendedDownZone=-100
//--------------------------------------------------------//
//-----Saty Phase Oscillator Signal-----------------------//
rawSignal=(close-pivot)/(3*averagetruerange[14])*100
oscillator=average[3,1](rawSignal)
//--------------------------------------------------------//
//-----Phase Oscillator Colours---------------------------//
if compressionTracker then
   r=255
   g=0
   b=255
   rs=255
   gs=0
   bs=255
   if islastbarupdate then
      drawtext("Compression",-100,-80)anchor(topRIGHT ,XSHIFT ,YSHIFT )
      drawrectangle(-200,-60,-10,-100)anchor(topRIGHT ,XSHIFT ,YSHIFT )fillcolor(r,g,b,50)
   endif
else
   if oscillator >=0 then
      r=0
      g=255
      b=0
   else
      r=255
      g=0
      b=0
   endif
   rs=100
   gs=100
   bs=100
endif
//--------------------------------------------------------//
return oscillator as "Phase Oscillator" coloured(r,g,b)style(line,3),extendedUpZone coloured(200,200,200),distributionZone coloured(150,150,150),neutralUpZone coloured(100,100,100),neutralDownZone coloured(100,100,100),accumulationZone coloured(150,150,150),extendedDownZone coloured(200,200,200),0 coloured(rs,gs,bs)style(line,2)
